Have your costs to include Google maps in your application drastically increased with the pricing changes Google introduced last year? If so, you aren’t alone. This price increase has driven many iOS developers migrate to the ArcGIS Runtime SDK for iOS. There are a couple of reasons for this.
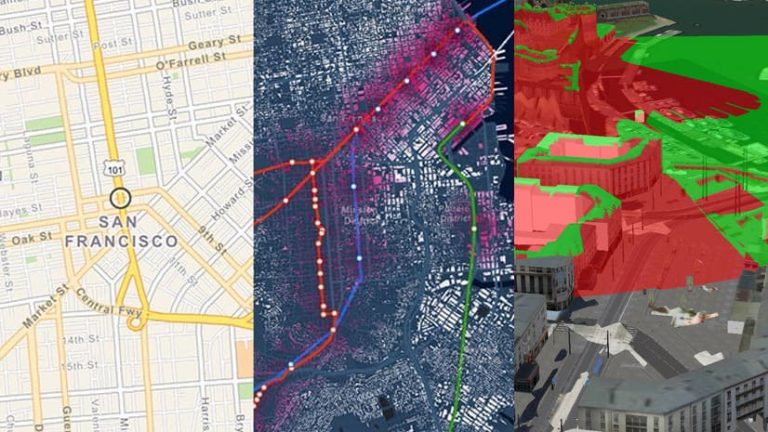
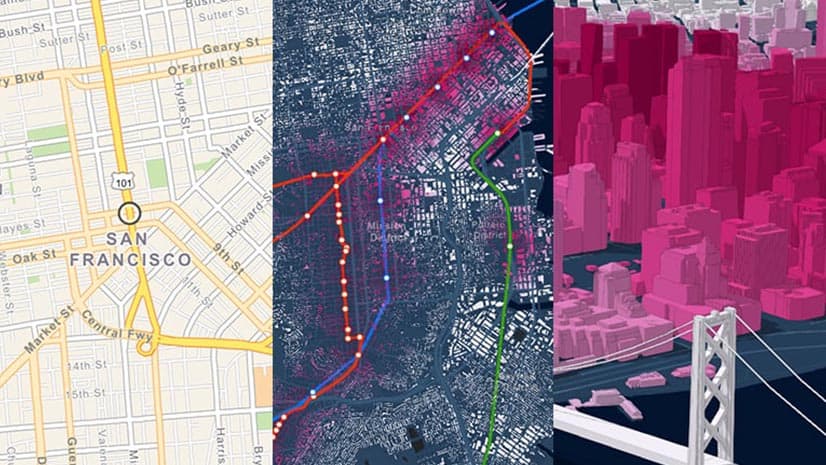
First, ArcGIS Runtime is a state-of-the-art mapping technology that provides support for many different types of map data. Not only can you visualize, explore and interact with large amounts of geospatial data in 2D and 3D, but you can also search for places and addresses, find the best routes between multiple locations, and manipulate all this spatial data on the client to build truly powerful interactive location based apps.
Second, you get a lot for free with an ArcGIS for Developers “Essentials” plan:
- 1,000,000 basemap and geosearch transactions per month
- Unlimited non-revenue generating apps (public or enterprise)
- Unlimited users
- Credits towards generating routes (up to 10,000 free each month)
- Style basemaps and manage your map content
- Host, query and analyze geographic content
- Take your maps and data offline
- Access a wide selection of rich content and services hosted in ArcGIS Online
- Use of all of Esri’s APIs and SDKs for web, native, and mobile platforms
Find out more about what’s included with the Essentials plan in our FAQ.
Get started with the Runtime SDK
Simply sign up for a free developer account at developers.arcgis.com (no payment info needed).
Next, download and install the SDK here (installation of the ArcGIS Runtime SDK for iOS via Cocoapods or manual install is covered in this guide topic).
It’s that easy. There’s no API key needed to get rolling. You’re ready to go.
Now let’s look at some common scenarios and how to translate from Google’s approach to the ArcGIS Runtime SDK.
Display a map
First of all, let’s add a map to an iOS application.

Here’s how you display a simple map using Google’s Maps SDK for iOS:
import UIKit
import GoogleMaps

class DemoViewController: UIViewController {
  override func loadView() {
    let camera = GMSCameraPosition.camera(withLatitude: 40.72,
                                            longitude: -74,
                                            zoom: 6.0)
    let mapView = GMSMapView.map(withFrame: .zero, camera: camera)
    view = mapView
  }
}
And here’s the same map using the ArcGIS Runtime SDK for iOS:
import UIKit
import ArcGIS

class DemoViewController: UIViewController {
  override func loadView() {
    let mapView = AGSMapView(frame: .zero)
    mapView.map = AGSMap(basemapType: .navigationVector,
                         latitude: 40.72, longitude: -74,
                         levelOfDetail: 6)
    view = mapView
  }
}
Notice the reference to a basemap. A basemap typically includes roads, buildings, satellite imagery, place names, boundaries etc. that give your application’s data some context.
You can choose from many ready-to-use basemaps from both Esri and third parties, and can style your own using the Vector Tile Style Editor.
Notice also that Runtime uses both a map and a map view. The map view is the UI component that handles user interactions and display of the map while the map is responsible for defining the data to be displayed (including the basemap).
Add a marker
Now we’ll add some information to the map.
In Google’s Maps SDK for iOS, you add a marker:
class DemoViewController: UIViewController {
  override func loadView() {
    ...
    // Create and add a marker
    let marker = GMSMarker()
    marker.position = CLLocationCoordinate2D(latitude: 40.72, longitude: -74)
    marker.title = "New York"
    marker.snippet = "USA"
    marker.map = mapView
The ArcGIS Runtime SDK equivalent is to add a graphic to a graphics overlay:
class DemoViewController: UIViewController {
  // Create a graphics overlay to contain graphics.
  let overlay = AGSGraphicsOverlay()

  override func loadView() {
    ...
    // Add the graphics overlay to the map view.
    mapView.graphicsOverlays.add(overlay)

    // Create a graphic and add it to the graphics overlay.
    let graphic = AGSGraphic(geometry: AGSPointMakeWGS84(40.72, -74),
                               symbol: AGSSimpleMarkerSymbol(style: .circle,
                                                                color: .red,
                                                                size: 10),
                               attributes: [ "city": "New York",
                                             "country": "USA" ])
    overlay.graphics.add(graphic)
A graphic is a combination of geometry (in this case a point, but it could be a polyline or polygon), attribute content (key-value pairs), and a display style (known as a symbol in the Runtime). Graphics are very flexible, and you can think of a marker as just a very simple point graphic.
You’ll notice that we need to configure the map view with a graphics overlay to contain the graphics we want to show. Graphics overlays and Layers provide a powerful model for data access and for displaying data from various sources. For more on this, see the guide topics on Maps and scenes and on Layers and tables.
Display information
In the Runtime SDK, you display information associated with a map location using a callout, which is associated with a map view, and which you must explicitly display or dismiss.

To show a callout when tapping a graphic:
- Make sure that the DemoViewController can respond to map view interactions by declaring conformance to AGSGeoViewTouchDelegate and setting the AGSMapView.touchDelegate appropriately.
- Implement the tap gesture delegate handler.
- Tell the Runtime to identify any graphics where the user tapped the map.
- Display a suitable callout if necessary.
class DemoViewController: UIViewController, AGSGeoViewTouchDelegate {
  override func loadView() {
    ...

    // Set the map view's touch delegate.
    mapView.touchDelegate = self
  }

  // Handle the AGSGeoViewTouchDelegate tap event.
  func geoView(_ geoView: AGSGeoView, didTapAtScreenPoint screenPoint: CGPoint, mapPoint: AGSPoint) {

    // Identify which graphic, if any, the user tapped on.
    geoView.identify(overlay, screenPoint: screenPoint,
                     tolerance: 20, returnPopupsOnly: false)
      { result in

      if let tappedGraphic = result.graphics.first {
        // Populate the configure the callout.
        geoView.callout.title = tappedGraphic.attributes["city"] as? String
        geoView.callout.detail = tappedGraphic.attributes["country"] as? String
        geoView.callout.isAccessoryButtonHidden = true

        // Show the callout.
        geoView.callout.show(for: tappedGraphic, tapLocation: mapPoint, animated: true)
      } else {
        // The user didn't tap on a graphic, so dismiss any existing callout.
        geoView.callout.dismiss()
      }
    }
  }
Callouts can display simple information by default, but can be configured to varying degrees. You can even specify a custom view to use.
The ArcGIS Runtime gives you full control over how you respond to user interactions with your map view, as well as convenient APIs for common responses to those interactions. In this case, we want to identify what was tapped and provide feedback using a callout.
Next steps & more resources
We’ve just scratched the surface of what the ArcGIS Runtime SDK can do for you. Here are some of the many resources available to you as you take the next steps in building location based apps with the Runtime:
- The Guide covers key Runtime concepts, including more details on the topics covered here.
- An open-source Samples App that covers over 100 Runtime capabilities.
- Hands-on DevLabs introduce you to components of the APIs. As a developer migrating from Google Maps, check these ones out in particular:
– Find Places
– Search and Geocode
– Directions and Routing - A detailed and searchable API Reference.
- Actively monitored forums. Join the GeoNet community and ask your questions there.
- Be sure to check out the “What can I do with 50 credits per month?” question in our FAQ.
One last thing. While this post has focused on the ArcGIS Runtime SDK for iOS, there are ArcGIS Runtime SDKs for Android, .NET (including Xamarin for cross-platform development), macOS, Java and Qt (again for cross-platform solutions) all of which provide the same great functionality in a consistent set of APIs.


Commenting is not enabled for this article.