-
-
-
-
-
-
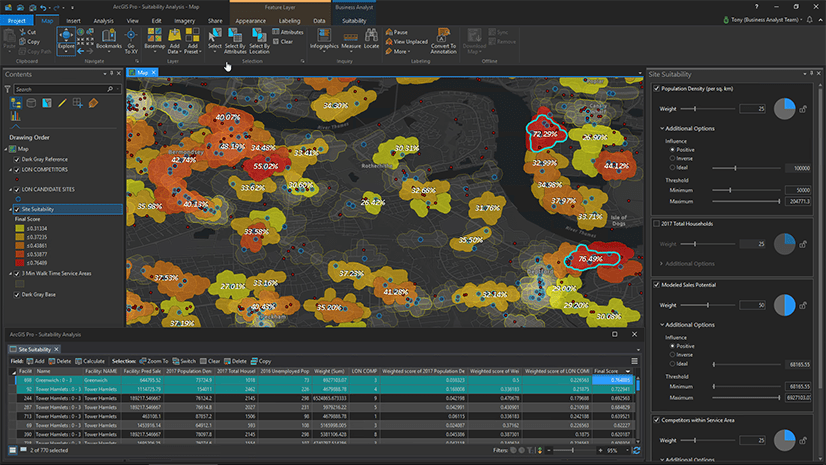
October 26, 2018
| Multiple Authors
|
Analytics
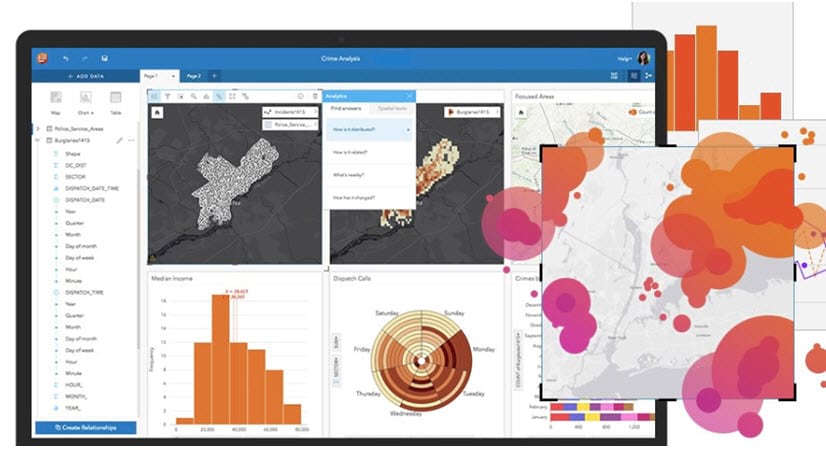
-
October 26, 2018
| Multiple Authors
|
Announcements
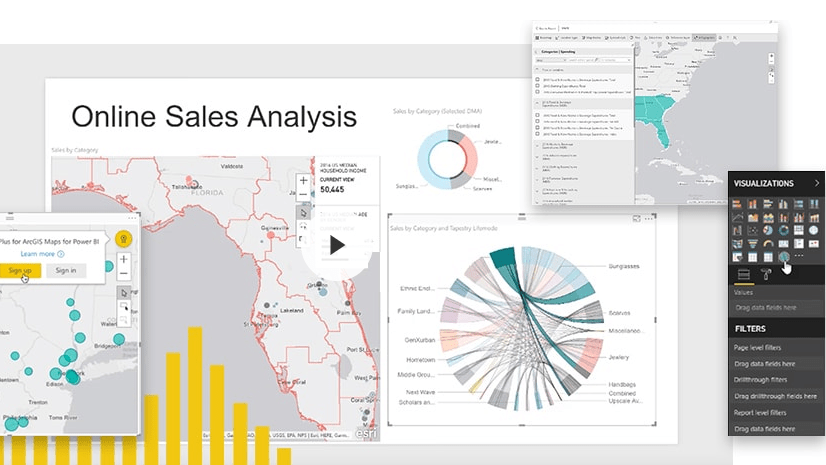
-
October 19, 2018
| Lucy Guerra
|
Analytics
-
-
-
-
-
-
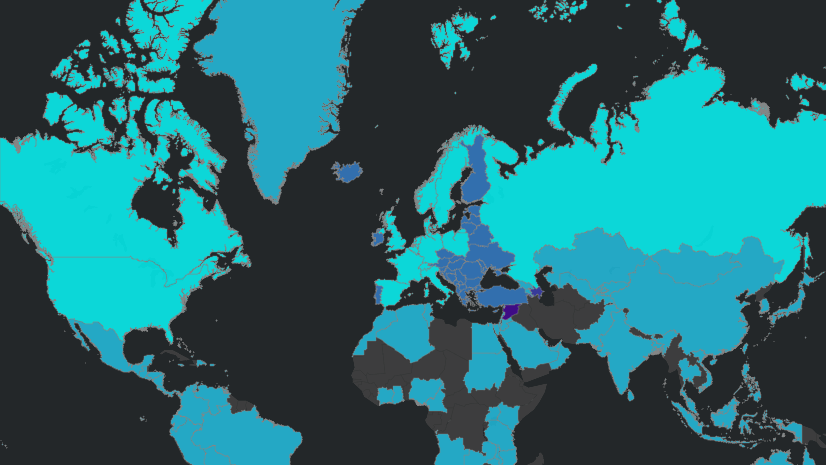
October 9, 2018
| Jordan Cullen
|
Business
-
-
October 1, 2018
| Multiple Authors
|
Announcements
-
-
September 28, 2018
| Doug Carroll
|
Analytics
-
-
-
September 27, 2018
| Greyson H.
|
Mapping
-
September 26, 2018
| Scott Ball
|
Analytics
-
September 24, 2018
| ismael
|
Field Operations
-
September 20, 2018
| Lucy Guerra
|
Announcements
opens in new window