The October 2020 release of ArcGIS Earth introduced capability for daylight rendering, allowing users to visualize how sunlight and shadows affect scenes during different times of the day and year. As a follow up to the high-level overview of this capability in our blog post What’s New in ArcGIS Earth, this article will offer a more detailed description of this powerful new feature in the context of a common potential use case: shadow impact in city planning.

Cities across the North America have some flavor of a planning code designed to protect specific and vulnerable areas (such as public parks) from shadows cast by surrounding high-rise structures. This concern is widespread in urban development, from San Francisco to Toronto to (perhaps most famously) New York City. San Fransisco’s Shadow Analysis Procedure states two criteria for necessitating an analysis prior to approval of development plans:
- If the proposed project would be over 40 feet tall, and could potentially cast new shadow on a property under the jurisdiction of the Recreation and Park Department, per San Francisco Planning Code Section 295; and/or
- If the proposed project is subject to review under the California Environmental Quality Act (CEQA) and would potentially cast new shadow on a park or open space such that the use or enjoyment of that park or open space could be adversely affected.
Requirements such as these are ultimately valuable to the general public and demonstrate a city’s commitment to thoughtful planning and development – but the accompanying procedures for analysis can be tedious and challenging.
Introducing Daylight
ArcGIS Earth can now expedite shadow analysis with some very simple configuration, allowing the user to view and even animate daylight as it cycles through the minutes in a day on the scene, or even months in a year, accounting for changes from season to season.
To enable this capability, take the following steps:
1. Turn on the Daylight effect for your scene using the toggle button.

2. Click the current time zone and choose from the drop-down list to select the appropriate time zone for your scene.

3. Drag the time slider left or right to adjust the time of day for your scene.

4. Click the Calendar drop-down menu to change the sun’s position at different times of the year.

5. Check the Animate sunlight and shadows over a year option to animate the daylight as it cycles through the months in a year. Check the Animate sunlight and shadows over a day option to animate as it cycles through the hours in a day.

6. Check Show shadows to illustrate shadows in your scene. You can change shadow effects by adjusting the date, time zone, and calendar options.

7. Click Start Animation to play the Daylight animation.

Now that our ArcGIS Earth scene is configured for Daylight analysis, we can look at an example scene – San Francisco’s Union Square – to observe shadow impact over the course of a year, changing with the seasons:

For closer comparative views, users can create a set of animations using the Bookmark tool. By creating Bookmarks for each of the above scenes, users can create an animated view of the shadow impact as the seasons change:

We can use this same workflow to generate animations anywhere in the world – for example, this animation of daylight and shadows by month over the course of one year in Lyon, France:

Or we can get a more granular view to look at daylight and shadow impact over the course of a single day:

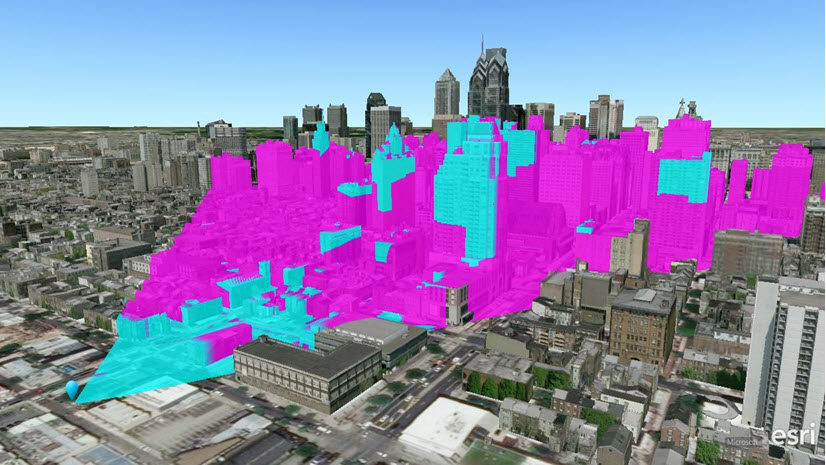
In a use case like city planning and development, the value of the Daylight feature is clear – but the implications for other workflows are also very exciting. For instance, paired with ArcGIS Earth’s powerful capability for visibility analysis with tools like Line-of-Sight and Viewshed, Daylight could help to inform decisions in the spheres of public or commercial security. You can learn more about how to use Line-of-Sight and Viewshed for visibility analysis in security workflows in our Learn Lesson, Perform visibility analysis to increase security, with a real-world use case based in the city of Philadelphia.
To learn more about ArcGIS Earth’s capabilities, visit the website. Users can also sharpen their skills and learn new techniques with a free discovery path available on the Resources page.
For a live demo of ArcGIS Earth followed by a Q&A with the product team, join the technical workshop at FedGIS on Wednesday, February 24. Visit the website to register.


Commenting is not enabled for this article.