Delivering new capabilities is fun and exciting. But making sure your ArcGIS systems are ready to support them? That’s often harder – and usually less exciting.
And as a result, purposeful design often gets pushed to the side. Sometimes you might get away with it – nothing breaks and users stay happy.
But with every additional untested and unvetted change you make to your system, you significantly increase the likelihood of negatively impacting performance, or breaking something altogether.
Like a game of Jenga, but with fewer laughs.

Adding capabilities is a system change, not a toggle
Changes to different parts of a system create different types of impact.
For example, you might expect that adding additional users to well-defined workflows would increase system utilization – across infrastructure, services, and data – in a predictable, linear way.
That’s what many teams expect. But in practice, it’s not necessarily what happens. For example, the additional load might cause the system to hit a bottleneck, creating cascading negative impacts.
Moreover, adding new capabilities or workflows tends to impact the system even more. Consider how new workflows can introduce new usage patterns, like:
- Different request types
- New peak usage times
- Additional dependencies (network, storage, services)
- New apps
- New users
- New automations or integrations
The more you deviate from the original use cases, the more likely the system is to struggle, sometimes in ways you won’t see until it’s already impacting users.
This is because the system wasn’t originally designed to support those additional users, workflows, or capabilities. Unfortunately, we frequently see teams add unvetted capabilities to an existing system in ways that degrade end user experience and productivty. In fact, we also see teams add capabilities to an existing system when they really should be supported by their own system.
What our system tests taught us
A while back we did some system tests to evaluate the impact of adding mobile capabilities to an existing foundational network information management system.
You can learn more about the details of the test study design and test methods here. However, in this blog I’d like to break down some of the key takeaways, regardless of your starting system or proposed added workflows.
In the pre-testing section of the test study, you will see the impacts of keeping the initial foundational system exactly as it was, while adding the new workflows.
Infrastructure-level metrics
In the diagrams below, you can see overall system utilization across components for our original system (left), well-within safe margins. However, on the right you can see dramatic impacts of adding the new workflows and users on the right across nearly every system component:
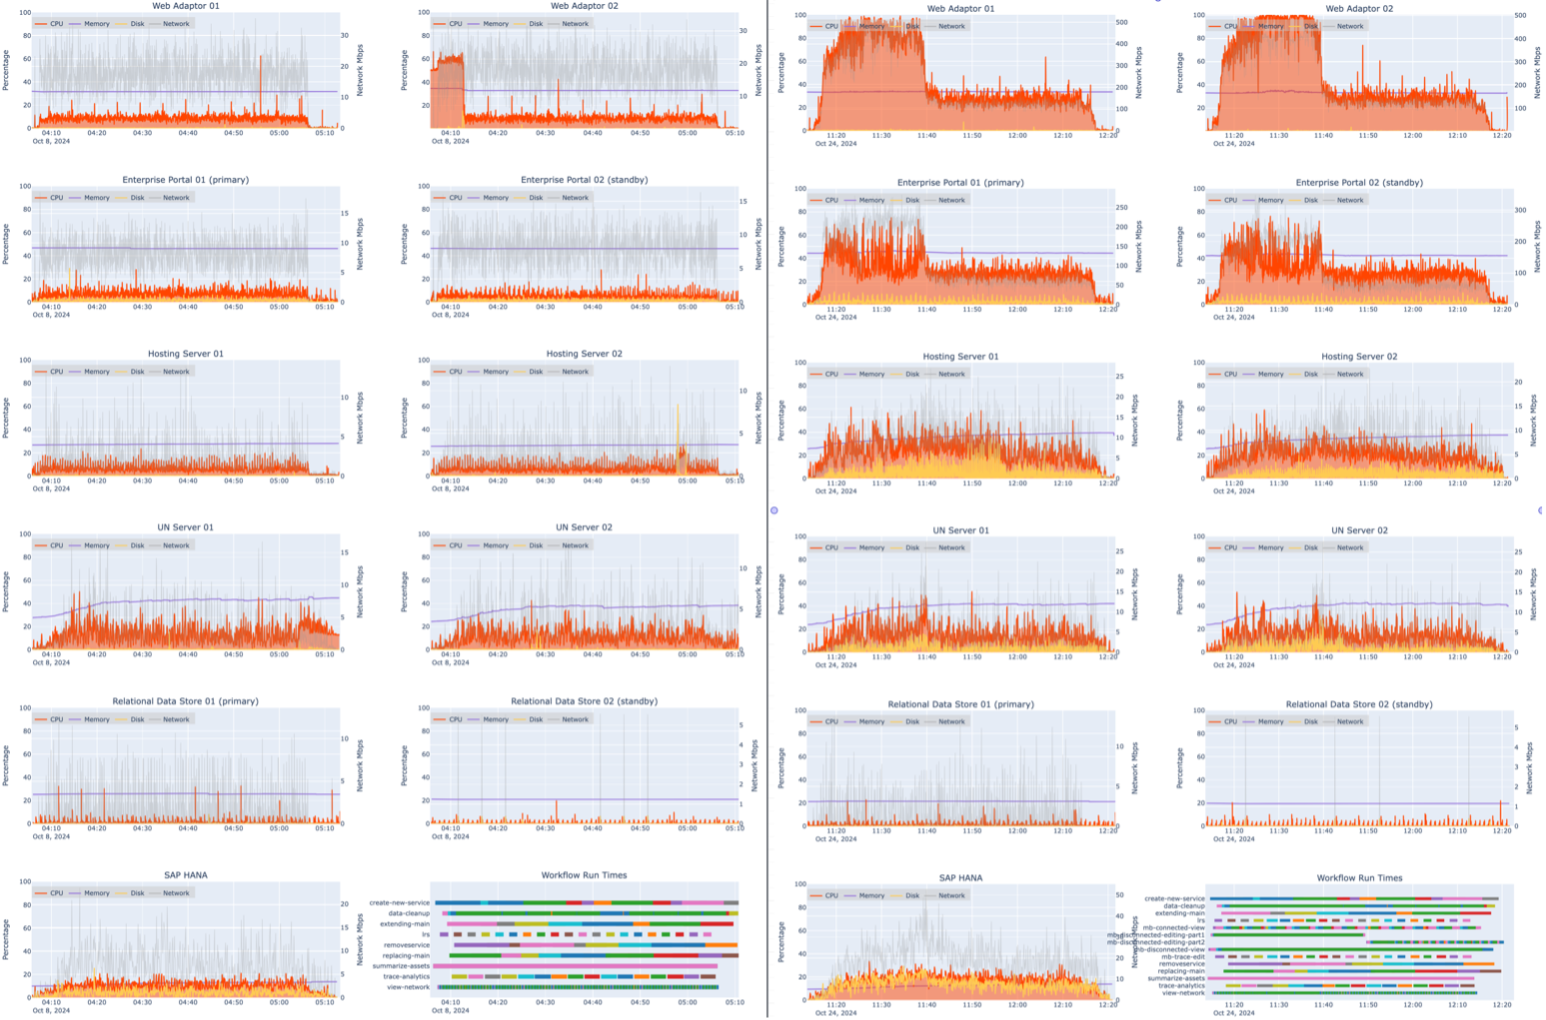
- Significantly higher CPU utilization in the ArcGIS Web Adaptors and Portal for ArcGIS instances – which slows request processing and increases the likelihood of timeouts
- All four GIS servers and the enterprise geodatabase are showing higher CPU utilization (orange) and disk usage (gold). This is resulting from the download and sync step of the offline workflows, where mobile workers download a 2.66 GB offline area.
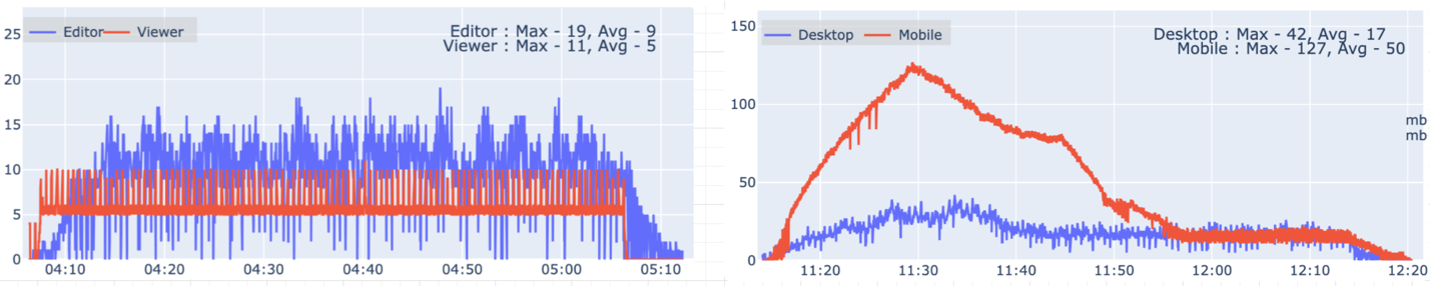
There is also significant impact when looking at open requests throughout the test period. In the graph below, you can see the original system supporting the foundational workflows well (left side), with requests opening and closing in an expected pattern.
However, with the added workflows (right side) requests ramp up significantly before downloads complete and the load drops off. This pattern indicates a bottleneck at this step in the workflow, with users waiting for offline area downloads to complete.
Workflow metrics
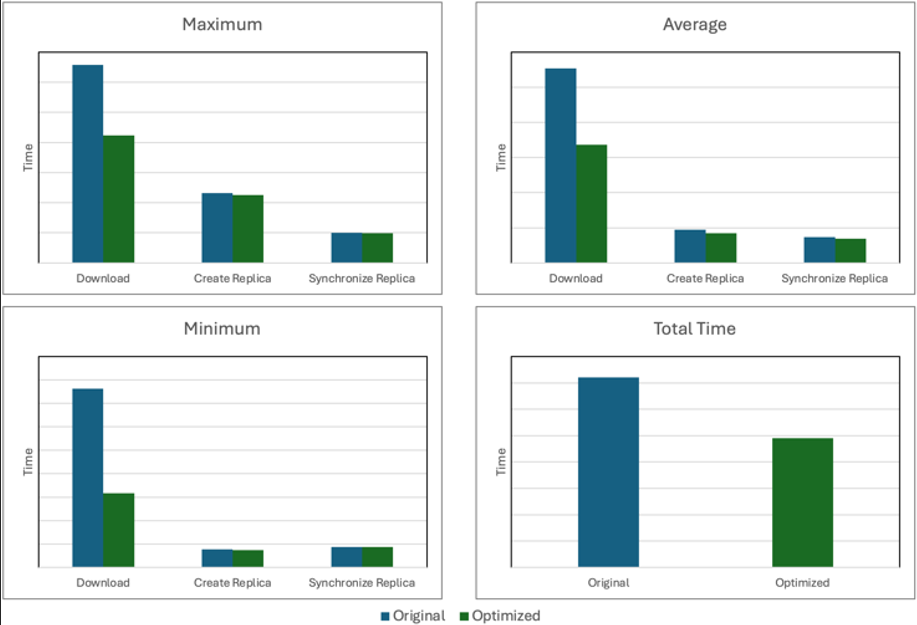
After identifying this bottleneck, we dug deeper. In the chart below, you can see the long download times for offline areas, which were upwards of 30 minutes (blue). We determined the issue stemmed from high CPU utilization on the ArcGIS Web Adaptor and Portal for ArcGIS instances (which you saw in the first set of charts), which was restricting throughput and causing downloads to timeout. To address this, we scaled those instances up:
- Web Adaptor – 2 vCPU to 8vCPU
- Portal – 4 vCPU to 8 vCPU
You can see the resulting time-saving improvements below (green).
Service-level metrics
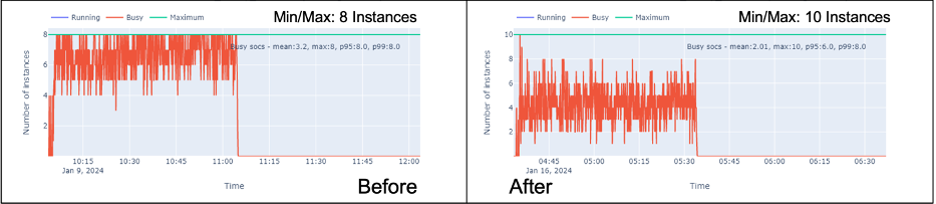
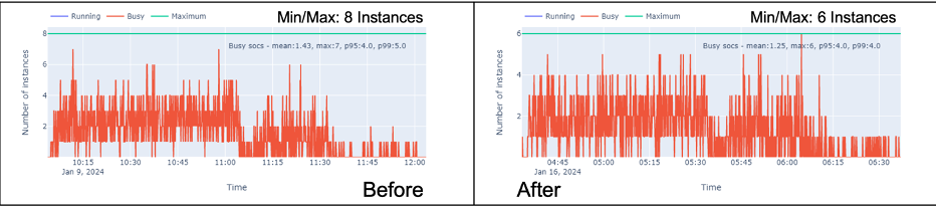
But it’s not just the hardware you need to pay attention to. Looking at the ArcSOC utilization charts below, you can see the positive improvements from reconfiguring the service instances to accomodate the new workloads. In our case, the read-only gas utility network service ran at maximum ArcSOC usage throughout most of pre-testing, whereas the mobile services had excess available ArcSOCs.
We achieved a more balanced distribution of resources:
- Mobile utility network service instances decreased from min/max 8 to min/max 6
- Service instances for gas utility network service increase from min/max 8 to min/max 10.
After this change, the charts (right) show a more even distribution between both services and user wait times measurably improved.
Lessons learned
In our tests, the original system could not adequately support the added workflows and users without redesign and reconfiguration. If this were a production system that we hadn’t tested beforehand, these bottlenecks would not have been visible until they impacted end-users. In our case, we made the following adjustments to optimize for the system changes:
- Web adaptor scaled up from 2 vCPUto 8 vCPU
- Portal scaled up from 4 vCPU to 8 vCPU
- Size of offline areas was optimized to make them as small as possible while covering necessary area
- ArcSOC configuration was adjusted to provide more even distribution of utilization to reduce wait times across workflows.
Your own systems will have different results. For example, you might find bottlenecks in different places of the system, or have different impacts. Or, maybe you find that the system can adequately support the new workloads without modification.
The key takeaway is not to look for the exact impacts we saw. Rather, do not assume a system designed for one set of use cases will support another without validation
All of this reinforces a simple point – new workflows can expose system limits that weren’t previously visible or impactful.
Getting started with your own test strategy
By now, you might be wondering, “well, what am I supposed to do exactly?”.
It’s worth saying first that our internal system testing is largely focused on performance testing to evaluate its impact on the end users’ ability to work productively without disruption. However, a thorough test strategy should encompass more than just performance testing. There are many kinds of testing for different purposes across the system lifecycle that should be performed in distinct compute environments. For example (but not exhaustive):
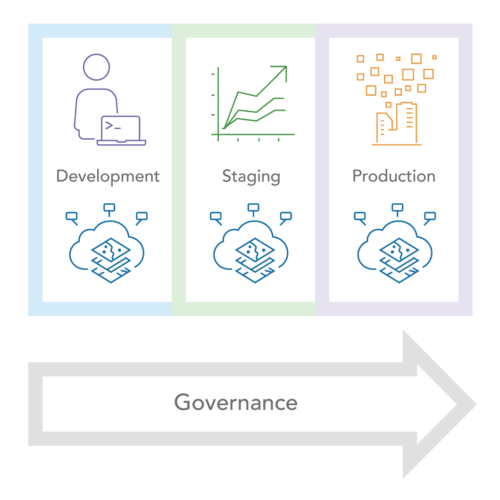
Development (does a piece work in isolation?)
- Unit testing
- Debugging
Testing / Staging (does everything work together correctly and at scale?)
- Performance testing
- Threshold testing
- Functional testing
Production (is it working reliably in the real world?)
- Post-release validation
- A/B, canary, or pilot releases (where applicable)
- Ongoing, proactive monitoring of performance, utilization, user experience
Many of these testing activities may not be done by your team. However, it is good to be aware of your organization’s standard processes, especially if you lead a GIS program.
To get started with your own test strategy:
- Establish a baseline, or how well your system behaves under normal conditions.
- Define the scope, tools, practices, and success criteria for your tests (the who, what, when, where, why, and how)
- Choose appropriate testing tools. For example, we use JMeter to simulate user workflows and measure performance under different load scenarios. For more information, see tools for performance testing.
- Collect and analyze telemetry data across the system’s infrastructure, apps, services, and data.
- Capture user experience measurements, like workflow execution time or screen recordings
- Make system adjustments as necessary based on results, as defined by your success criteria
Once you get to step 6, there’s any number of adjustments (if any) that could be appropriate to support the new capabilities. For example:

Any of these paths forward could be the right choice for your organization. The best approach is the one that optimizes cost, complexity, and value for your organization, and one that your teams are confident in and accountable for.
Design for change, not perfection
For most organizations, change is inevitable. Whether expanding to new user bases, delivering new capabilities, or establishing new integrations or otherwise. This is true now more than ever.
So, to evolve your ArcGIS systems rapidly with greater success, design for flexibility rather than trying to perfect your initial hardware sizing. This way, your organization can expand adoption and add capabilities with greater agility by “scaling up” and “scaling out” more easily. Our test study is a great example of the value of a scalable system for enabling change.
It is a good practice to test and validate your system whenever you want to introduce a change. This way, you can identify potential impacts before they are introduced into a production environment:
- Use well-defined test methods to evaluate and vet proposed changes
- Look for emerging system bottlenecks across system tiers
- Experiment with different settings and configurations in an iterative fashion (in a testing environment)
Organizations successfully add new capabilities and workflows to their ArcGIS systems every day. However, to be confident in that success, you need to test, observe, and make necessary adjustments before rolling out changes to your production system.
Systems designed for flexibility, combined with ongoing testing , are what enable teams to deliver new organizational value quickly, reliably, and with confidence.
Do you have ideas for how we can improve our resources in the future? Please share your thoughts with us!
➡️ You can also find our full catalog of test studies and blogs here
➡️ If you have questions or want to keep the conversation going, consider joining our LinkedIn group




Article Discussion: