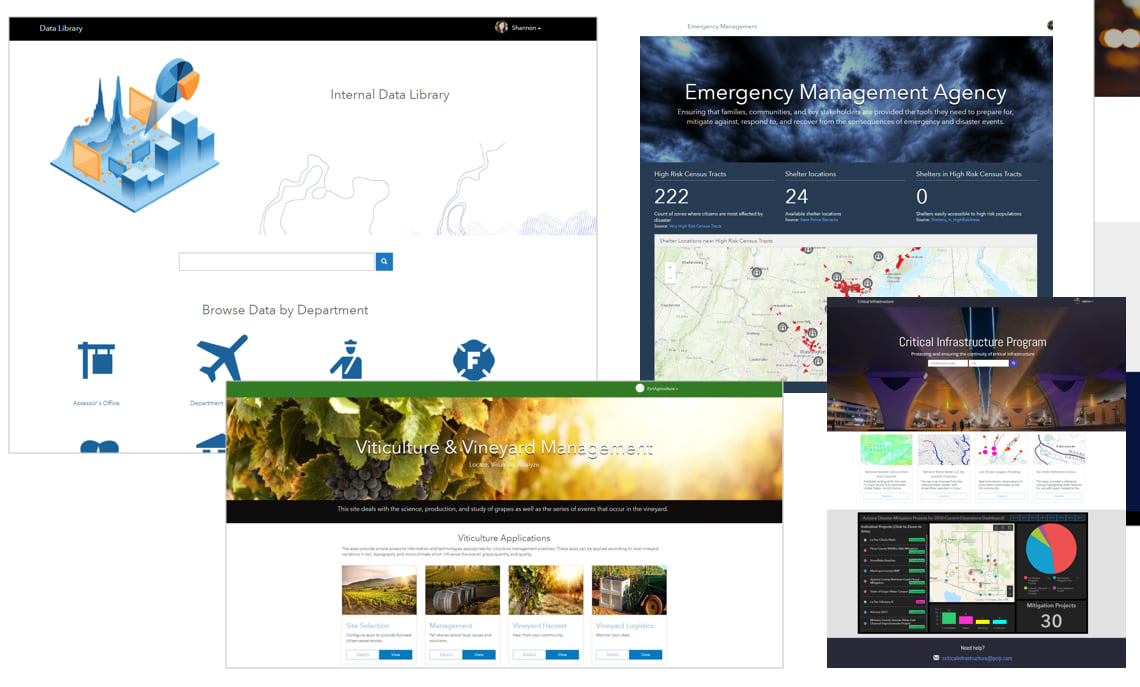
As part of your ArcGIS Enterprise Portal, Sites provides you with the ability to create tailored websites and pages for sharing information with people across teams and departments, regardless of their experience with GIS. By simply signing in with an organization account, staff can navigate your custom web page to access datasets, charts and graphs, web maps, dashboards, and more to leverage your authoritative GIS data with ease.
With the release of ArcGIS Enterprise Portal 10.7, several enhancements to the site editing experience make designing site and page layouts simpler. These enhancements include more efficient ways to upload images, display galleries of content, embed video and social media, and share private data. We’ve also included updates to improve accessibility and performance.
Add images
Add context to your site’s narrative with the new image card. Images can be uploaded from your computer or by pasting a link.
Options to crop, zoom, and move your image mean that you can position your picture exactly how you want.

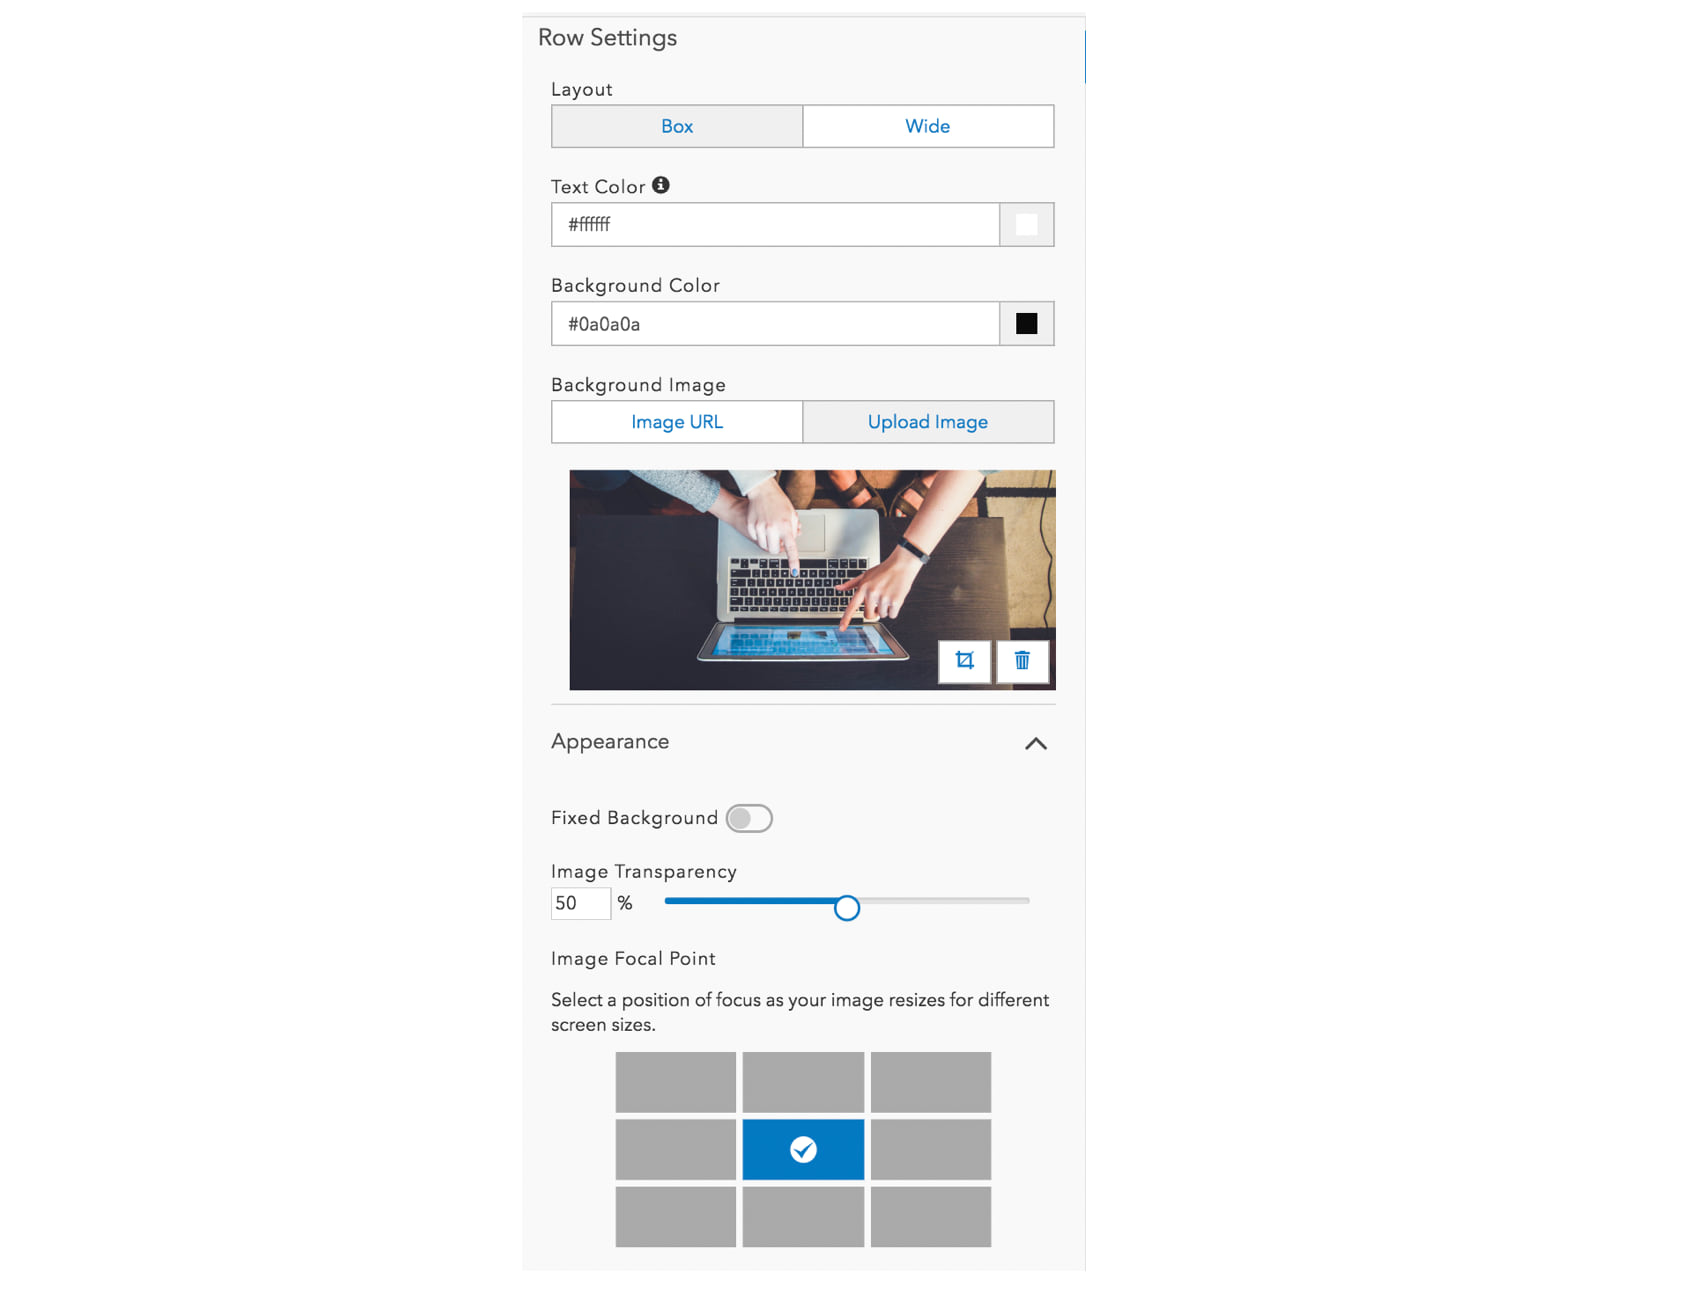
You can also add images to your site’s background by uploading an image to row and banner cards.
And, set a focal point to ensure that no matter the screen size, your image remains focused where it belongs.
Display galleries of content
With more style options, opt for rounded corners or keep things sharp with square corners.
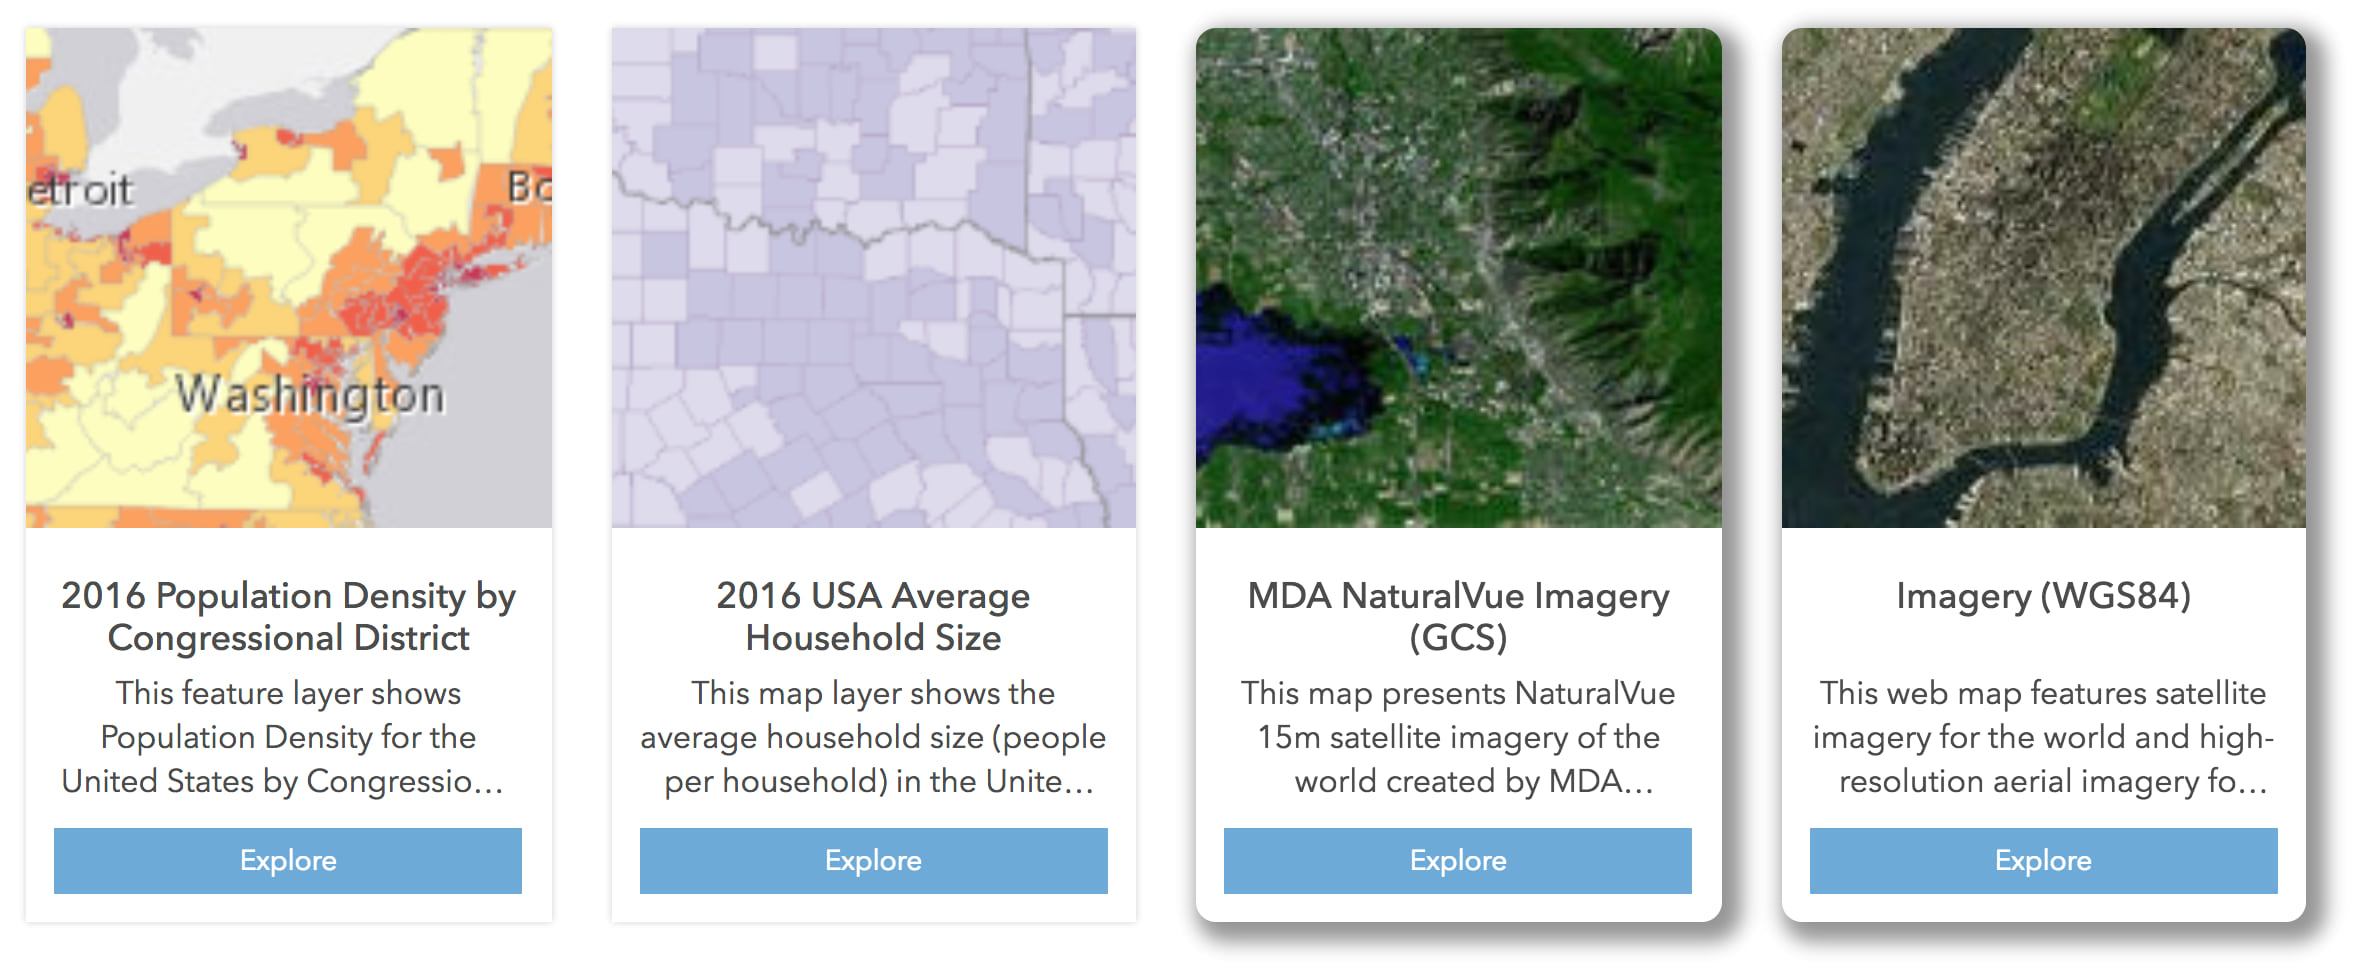
We’ve also made the gallery card responsive to ensure that no matter the screen size, visitors get the best experience when viewing your content.
Upload Videos
The new video card enables you to upload videos simply by posting a link for any Vimeo, YouTube, or Facebook video.

Video-host specific settings like optional branding and loop, provide options for customizing your video’s display.
Updates to the chart card
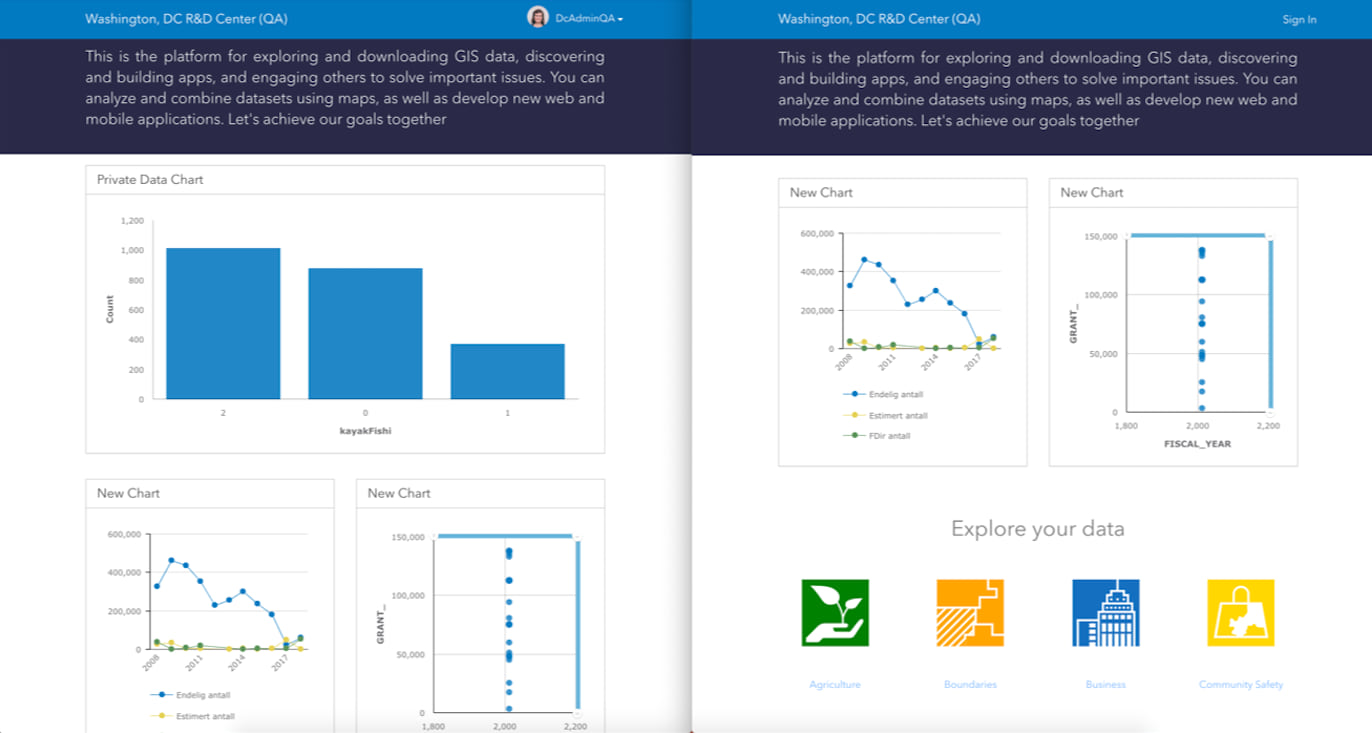
The chart card enables you to visualize data that belongs to you, your organization, or is shared publicly. With this release, we’ve added the ability to create line charts.
You can also choose a primary color for bar, line, and scatter charts. Pie charts will default to the color that you choose for links in your theme options.
Want to share a chart with just your team? You can now share charts of private data on publicly shared sites so that members of your team can continue accessing the information they need in one place.
Additional updates
- Optionally add scrollbars to an iframe so that people can access more of its content.
- Update your page’s URL after you’ve created it if you don’t like the default URL
- To help you more easily get started with your site’s blank canvas, we’ve updated default theme colors to something more neutral.
- Language support for Bosnian, Catalan, and Hungarian.
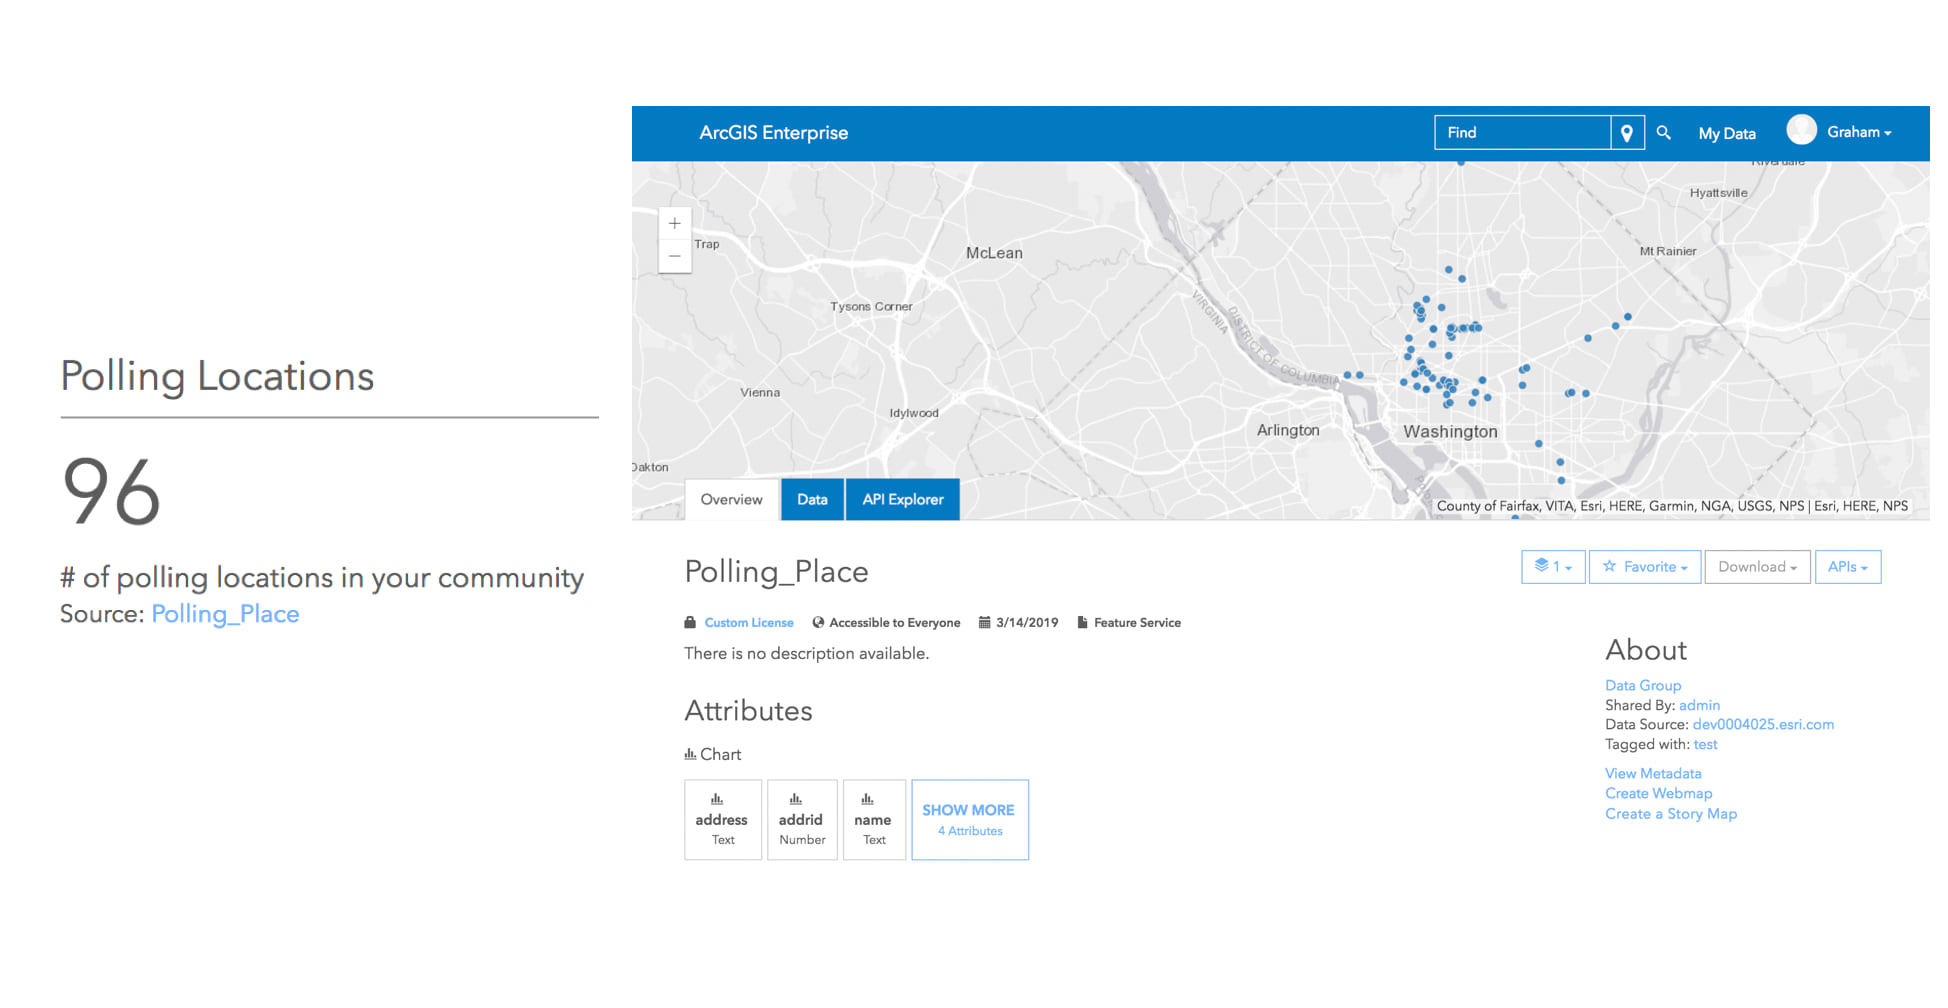
- The summary statistic card enables you to quickly display fast facts about your datasets. Now, people can get to a statistic’s source quicker by simply clicking the source link to open it’s dataset preview page.
Technology and performance updates
Sites is now powered by arcgis-rest-js, an OSS project for building javascript applications for ArcGIS, which has increased page load speeds by 10%. This has improved search response time by reducing the number of fields being requested from the REST API.
Create more accessible sites
Any web content you share should be accessible to all audiences. That’s why we put in work behind the scenes to make our Site Editor accessible and to provide you with the tools needed to share your own accessible content.
Get started with these quick tips and tricks to share your own accessible content.
Get started
Check out these enhancements on your existing sites and pages, or if you’re new to Sites, get started by creating your first site.


Commenting is not enabled for this article.