
In the year 2021, humanity rapidly approaches the turning point for the climate crisis. The United Nations reports that we have until 2030 to tackle climate change before risking irreversible damage to our planet. Renewable energy has been proven to reduce CO2 levels in our atmosphere, and as such, is one of humanities best chances at mitigating the impending climate disaster.
Business leaders and local, state, and federal governments are making efforts to meet the demands of a changing climate. The Biden administration has recently set an initiative for creating new, more energy efficient buildings, and an initiative to reduce carbon-based pollution by 50% before 2030. Tackling these issues demands a spatial approach; it requires identifying the best locations for placing renewable technology, evaluating the performance of various implementation scenarios, and providing maps and metrics that summarize it all. Geospatial technology, such as ArcGIS GeoPlanner can help. ArcGIS GeoPlanner empowers organizations to make smarter decisions when land use planning for renewable energy. GeoPlanner’s numerous capabilities for geodesign enable leaders in all sectors to make better planning decisions. Let’s look at a hypothetical scenario for the City of Perris, CA.
Note: The scenario outlined in this post is entirely fictional. Any relationship with similar, real world scenarios is purely coincidental.
Scenario: The City of Perris, CA has set a goal to power 1,000 homes with solar energy by 2025. To kick off this initiative, they are interested in installing a field of solar panels on undeveloped land to power 40 new homes within the city limits. There are two vendors bidding for a contract with the City– United Solar and Solar Lizard. The City will use GeoPlanner to create design scenarios for each vendor, and compare them according to their cost, size, and energy potential. The budget set for this project is $6,000,000 with a flex budget no higher than $6,500,000.
Suitability Analysis
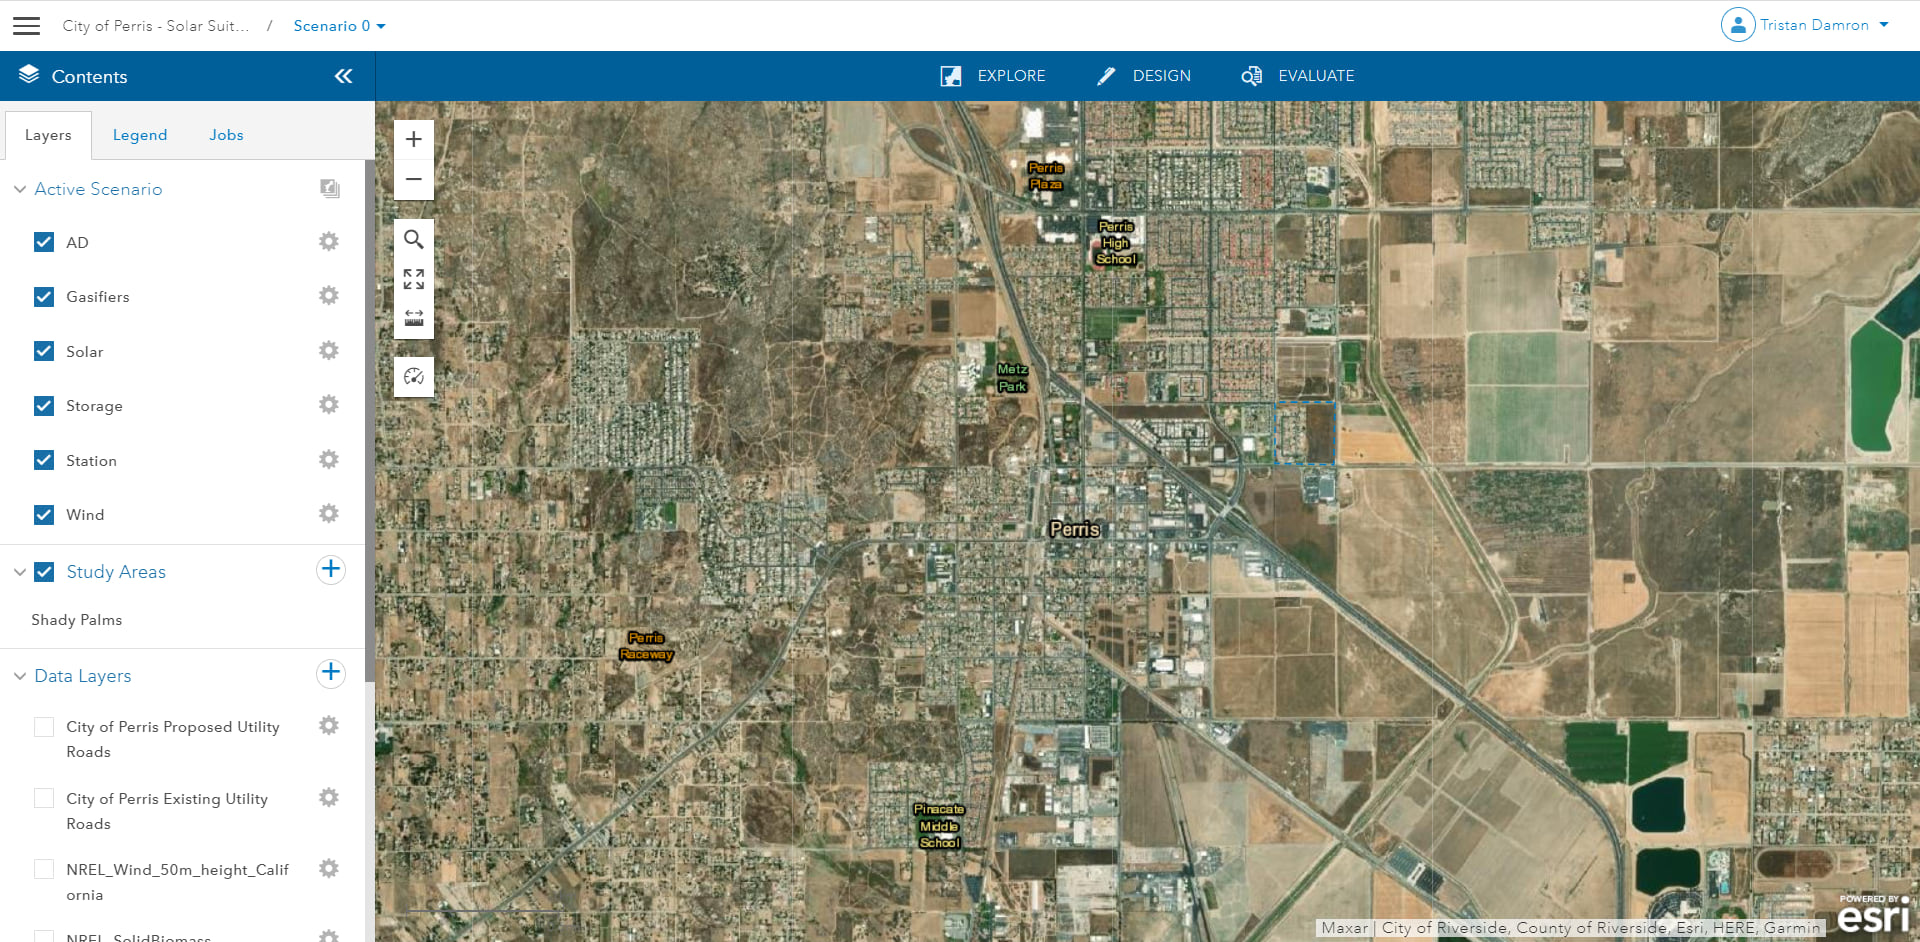
A suitability analysis is a useful technique to easily compare different criteria in a centralized way. They help planners understand the best places to put potential designs by calculating overall suitability of a location based on the individual suitability of the contributing criteria layers. Before planning their designs, the City must analyze their region to determine how suitable the area’s undeveloped land is for solar development potential. GeoPlanner offers a weighted raster overlay service to analyze land features across several criteria. For this project, the City used a custom solar suitability model which calculates based on the following criteria: Aspect, Land Cover, and Slope. Land with a high suitability is barren land with a low-angle, Southern facing slope. The land most suitable for solar potential is marked in dark green, while land that is marked in yellow is not suitable for solar potential. Areas marked in a grassy green color indicate areas of average solar suitability.
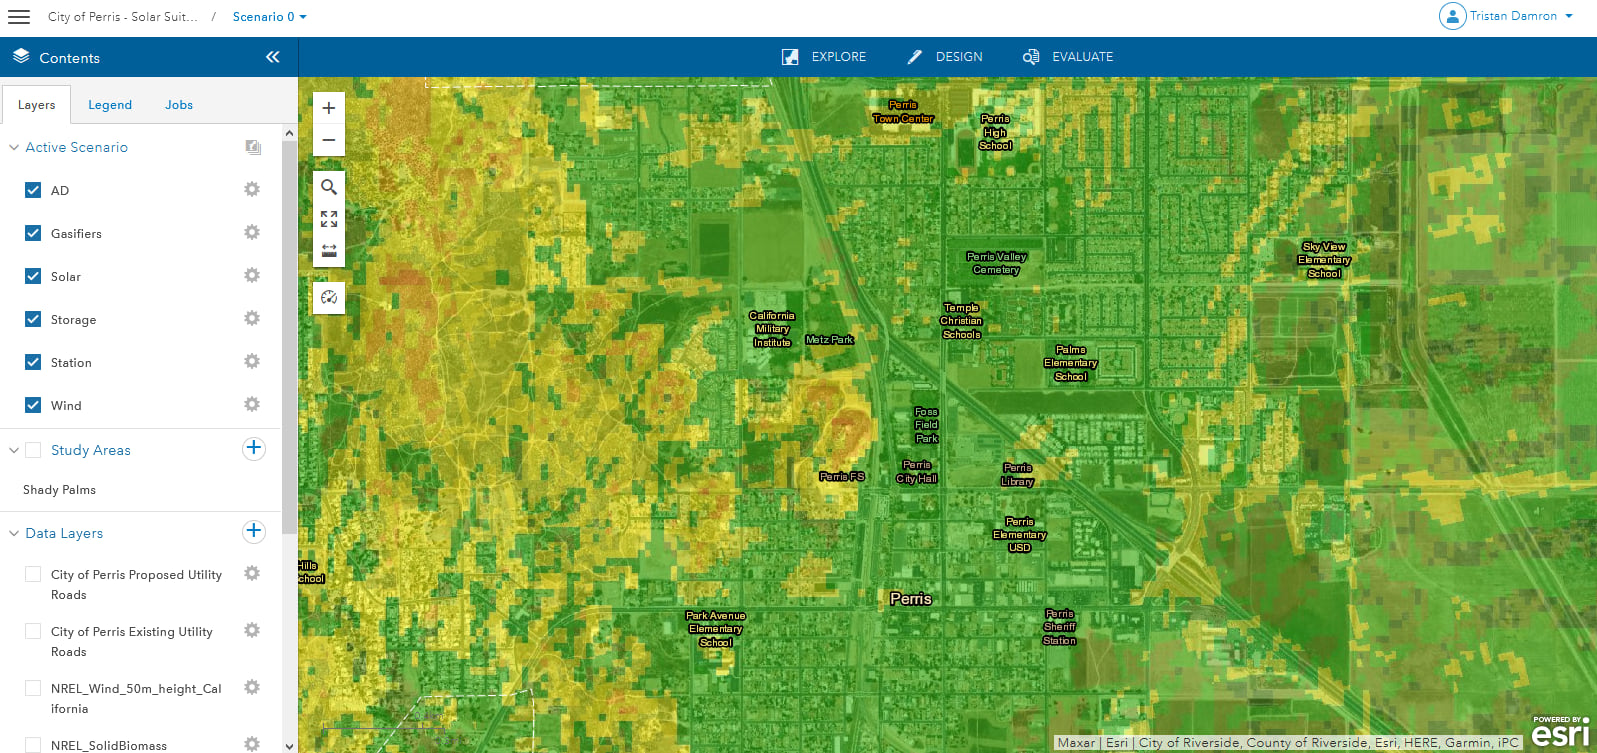
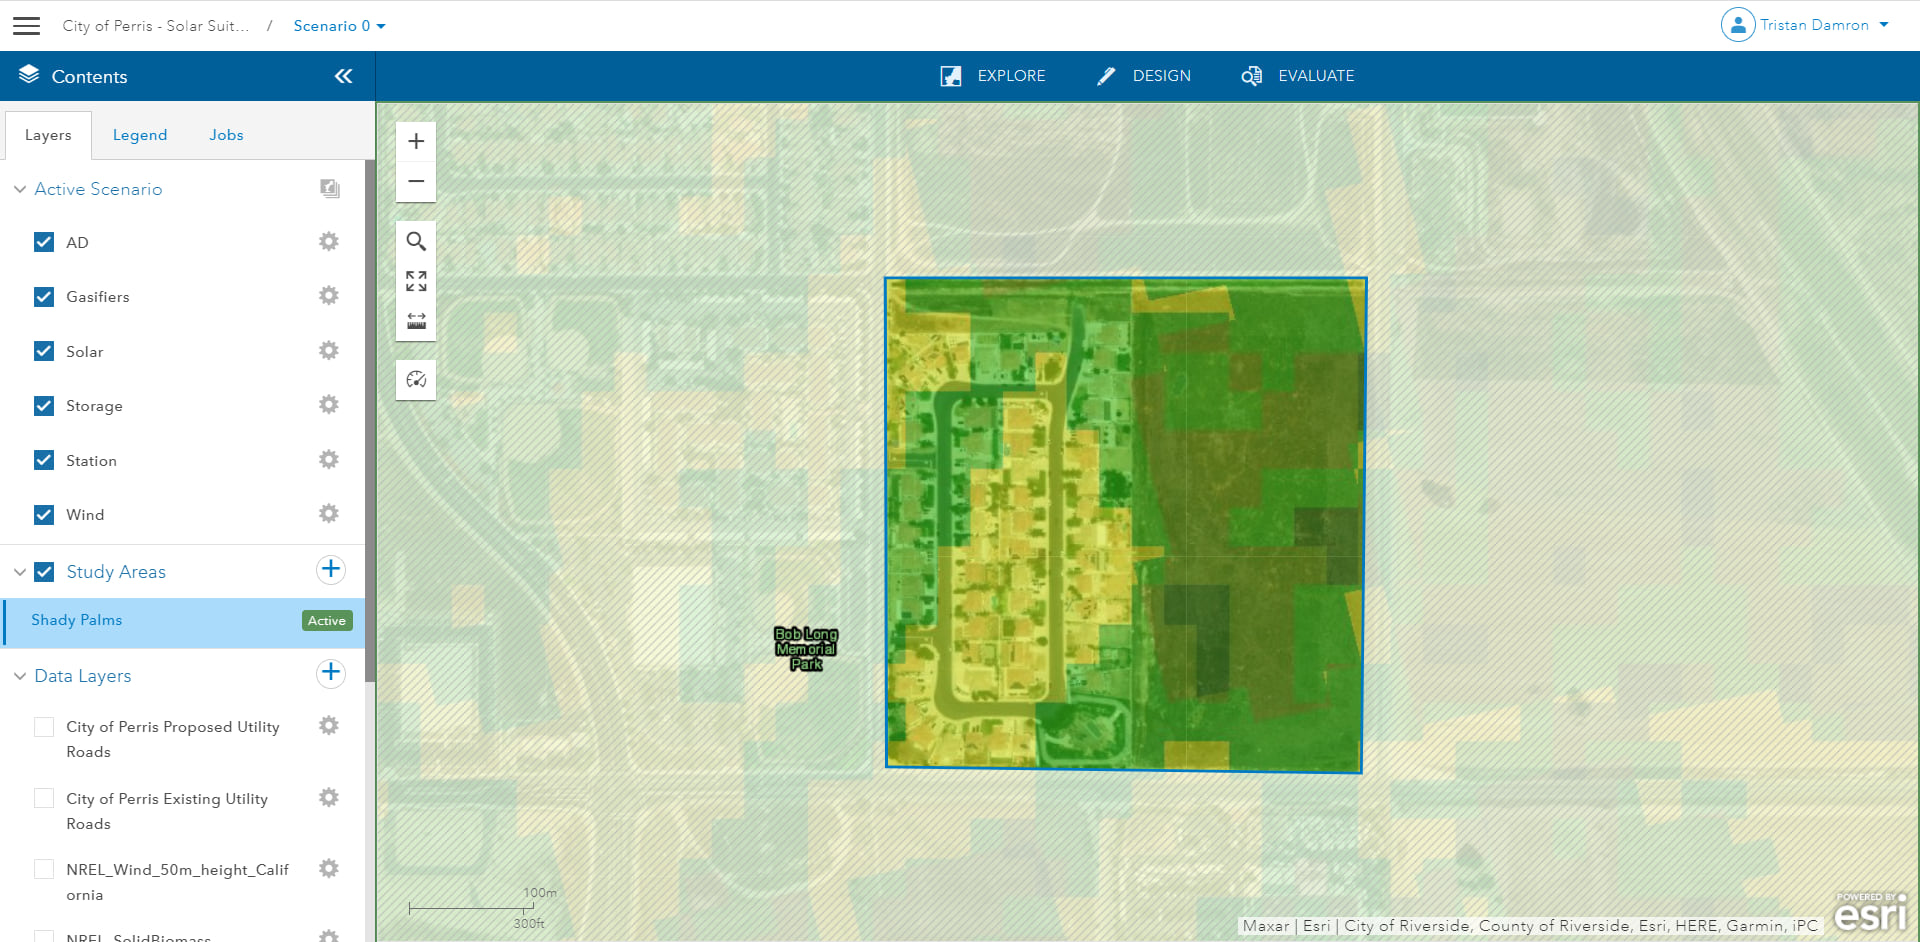
As you can see, much of the Western part of the City (indicated in yellow and orange) is not suitable for installing solar panels. Much of the land to the East, however (indicated in green), is very well suited for high solar potential. Since the City wants to power at least 40 homes using these solar panels, the installation location is best suited to be near the city rather than in an agricultural zone. The community of Shady Palms has approximately 50 homes and is adjacent to a vacant lot which has a high suitability for solar potential. This is the perfect spot for the City to install their solar panels.
Designing with GeoPlanner
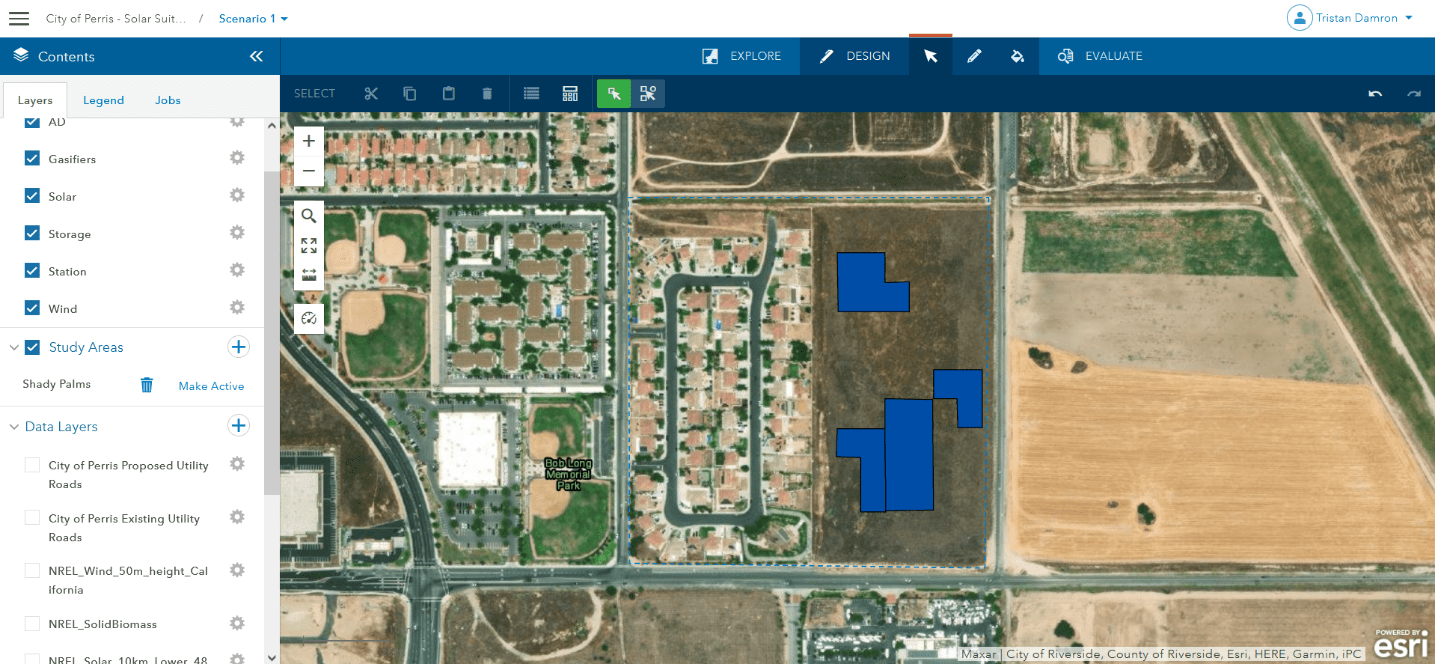
With a general area in mind, the City now turns to GeoPlanner’s design tools to assess which solar company offers the best options. GeoPlanner allows you to create multiple scenarios to analyze design options and their impacts. These scenarios can then be compared using key metrics to make smarter business decisions based on project goals. Per this case study, the City of Perris has set the following goals:
- Generate 40,000 Kilowatt Hours (KWH), (Average 1,000 KWH per home * 40 homes).
- Target budget of $7,000,000, no higher than $7,500,000.
The City develops a custom design template with design types containing data about popular solar energy companies as well as the cost of each company’s solar panel, their output potential, and model type. They will use this to compare Solar Lizard and United Solar.
Using their goals as a baseline, the City designs two scenarios in GeoPlanner.
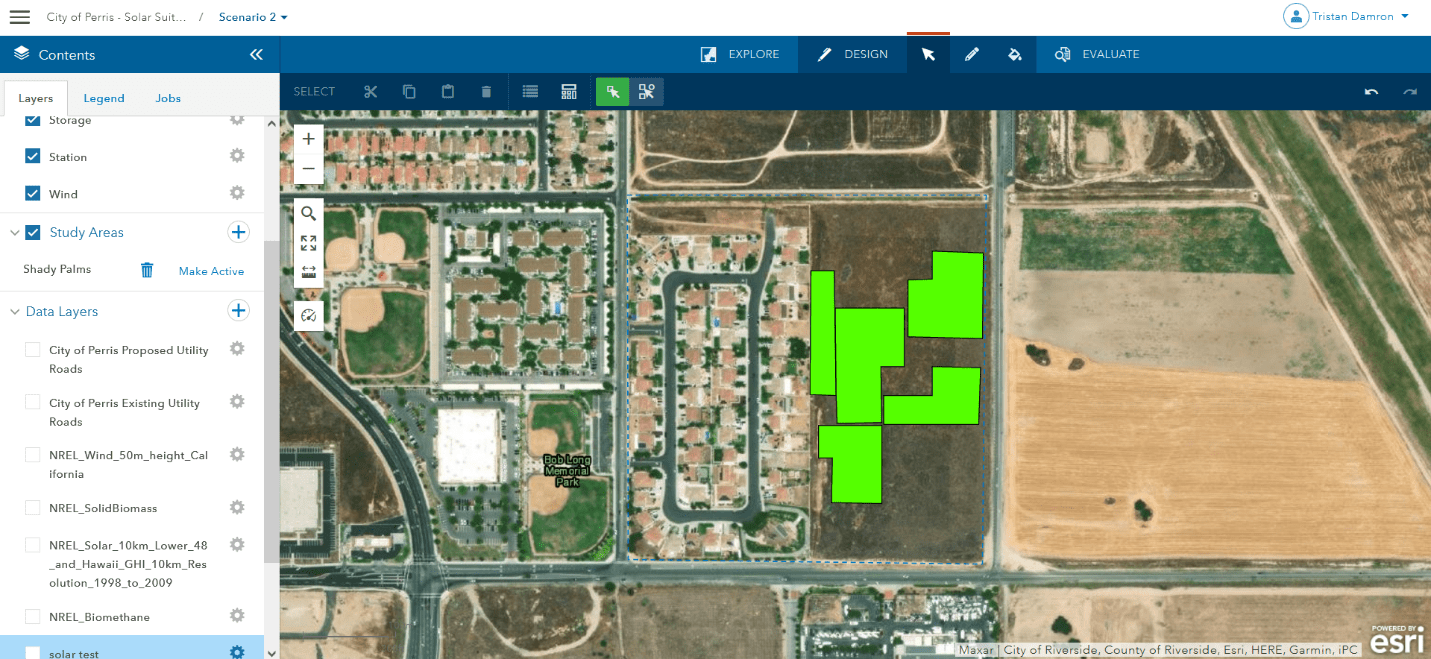
Making smarter decisions with dashboards
After the City designed their scenarios in GeoPlanner, the next step is to evaluate and understand the impact of these design alternatives. The two scenarios look largely the same, but the underlying design data will show different impacts from the two solar companies. Comparing scenarios allows you to choose the scenario that will best meet the goals of your organization. The allows you to generate quantitative metrics about your scenario(s). The City of Perris uses their design data to create the following dashboards in GeoPlanner:


Each dashboard contains a chart indicator, two gauge indicators, and three numerical indicators. The metrics reported in these dashboards include the amount of land area used by each scenario, solar energy potential, total number of solar panels, and the cost of installation. These scenario indicators are calculated through an equation which considers data from the active scenario.
The City also creates a KPI Report to compare specific quantitative metrics between each scenario. This report can be downloaded and the results are shown below.
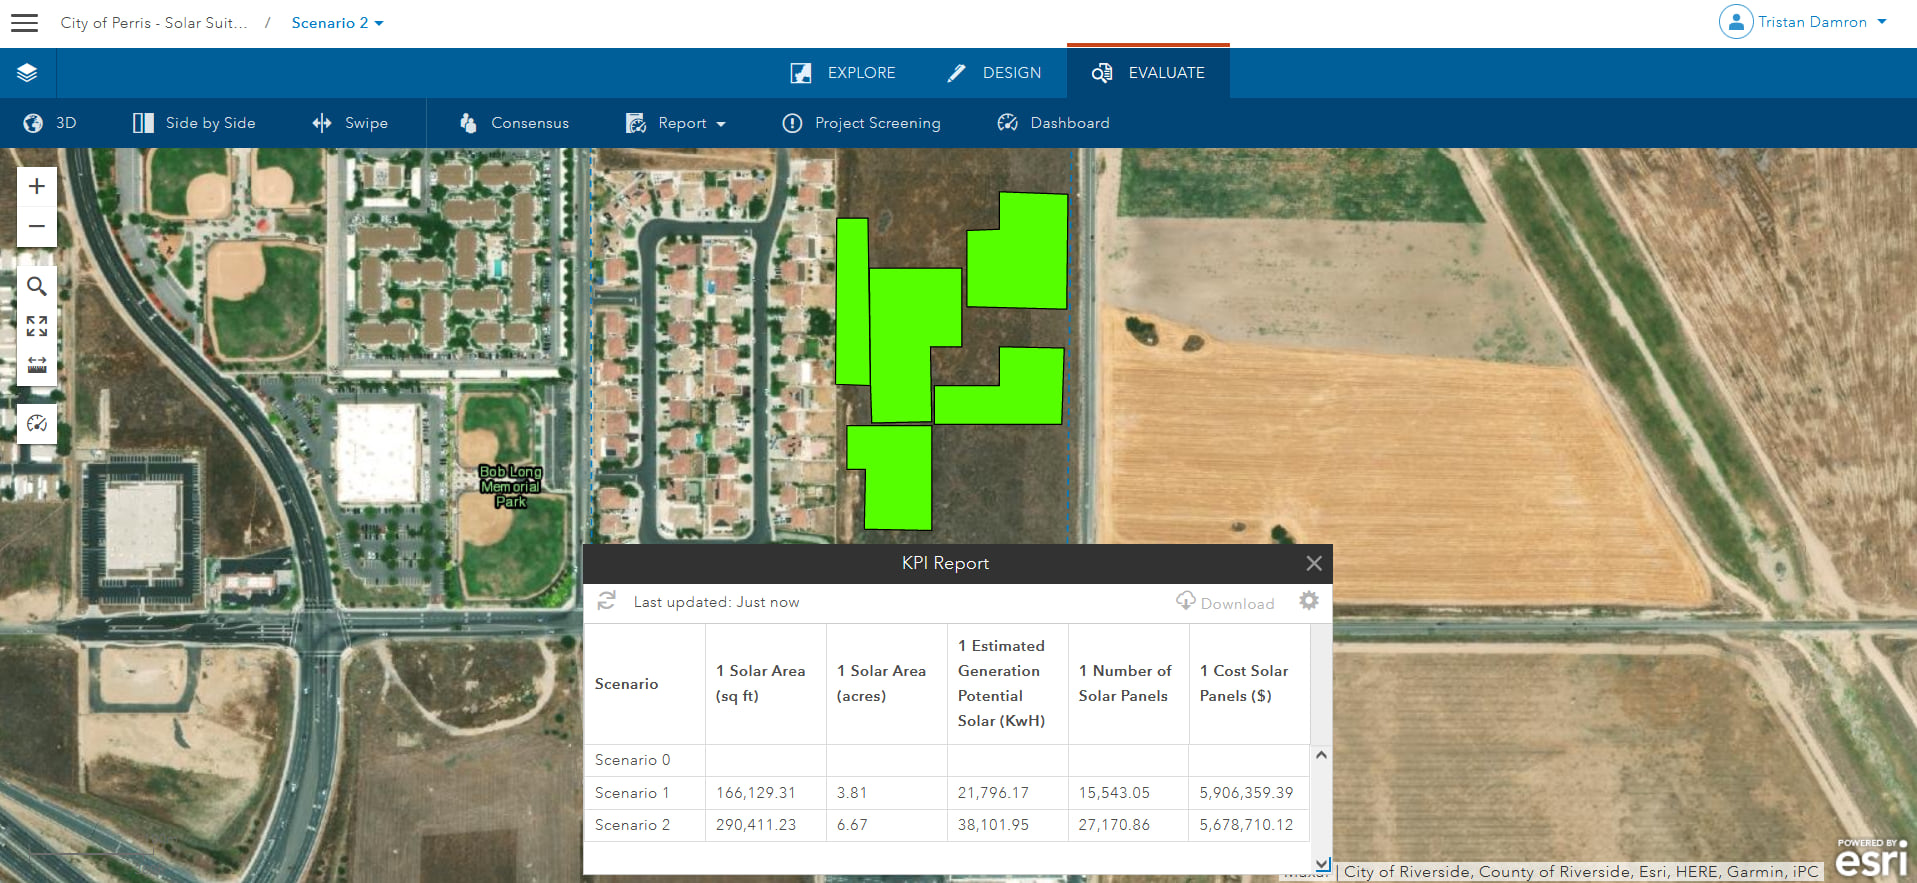
| Scenario | Solar Area (sq ft) | Solar Area (acres) | Estimated Generation Potential Solar (KwH) | Number of Solar Panels | Cost Solar Panels |
| Scenario 1 | 166,129.31 | 3.81 | 21,796.17 | 15,543.05 | 5,906,359.39 |
| Scenario 2 | 290,411.23 | 6.67 | 38,101.95 | 27,170.86 | 5,678,710.12 |
Based on the success criteria set by the City for this project, the dashboards suggest that Solar Lizard (Scenario 2) provides significantly more output potential (~38,000 KWH compared to ~21,000 KWH) for approximately the same price as United Solar. Because of the cheaper cost of Solar Lizard’s panels, the City can install more panels, taking full advantage of all areas with a high solar potential. The City can export this dashboard as an image and embeds it into a slide-show presentation to share with stakeholders, or export data from their scenario to a CSV file to analyze the scenarios further in Microsoft Excel.
Conclusion
Renewable energy may be our best bet to mitigate a climate catastrophe. It’s up to business leaders and organizations around the world to make smarter, data-driven planning decisions when considering a renewable energy source. Easy to use and accessible tools such as can help. GeoPlanner provides numerous capabilities for engaging users to make better decisions, easier. With GeoPlanner’s metric reporting capabilities, making smart business critical decisions is easy. Learn more about GeoPlanner on Esri Marketplace.


Article Discussion: