One of the core layers the Living Atlas of the World provides is a digital elevation model (DEM) of the planet. These data are shared as cached basemaps and as an image service, as well through a suite of analysis tools you can use directly against the hosted data. The Hydrology Analysis Tools – Delineate Watershed and Trace Downstream – use elevation to help you understand hydrologic connectivity across the landscape. These are foundational services with applications in natural resource management, ecology, public health, and disaster response. For example, when a waterborne contaminant is found at a particular location, you can use these tools to narrow down the upstream area it could have come from, and chart where it will flow next. Users can perform these analytical tasks quickly and easily without having to collect, maintain, or update terabytes of base data on local machines. The data is already preprocessed, optimized for fast web service performance, and is readily accessible across the ArcGIS platform.

Globally this analysis is based on the 90-meter resolution HydroSHEDs DEM, and in the United States the tools also take advantage of the 30-meter resolution National Hydrography Dataset. However, some islands remain too small to represent with these datasets, even making use of the increased resolution of the NHD. Now that the USGS has begun releasing 10-meter resolution, hydrologically-enforced DEMs for the United States, we can finally add support in Hawaii, Puerto Rico, Guam, and the U.S. Virgin Islands. This is the first 10-meter resolution data to be incorporated into our Hydrology Services.
How to use them
These tools can be used by any application in the ArcGIS platform. If you are developing an application of your own, you can use the REST API to incorporate them into your project as well.
In ArcGIS Online, just press the ‘Perform Analysis” button and click “Find Locations.” The tool lets you input a set of points, or you can just click on the map on your point of interest.
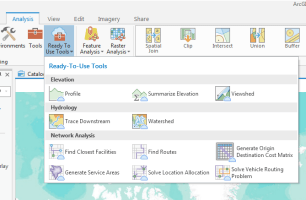 In ArcGIS Pro, these analysis services are accessible as Ready-To-Use Services in the Analysis ribbon. Ready-To-Use Services give direct access to ArcGIS Online analysis services such as Network Analysis Services as well as elevation and hydrology services. Access them by logging in to any ArcGIS Online organizational account. These tools can be used directly in ModelBuilder models and Python scripts just like any other geoprocessing tool.
In ArcMap, you can find them at the bottom of the Catalog window. Expand Ready-To-Use Services, click the Elevation connection, and then the Tools folder, and Elevation toolbox. A pop-window will prompt you to log in.
How much they cost
These services require that you have an ArcGIS Online account with credits available to you. For every thousand features you input to the tool, one credit will be deducted from your account.


Commenting is not enabled for this article.