The U.S. Census Bureau publishes a special tabulation of the American Community Survey (ACS) 5-year estimates – the Citizen Voting Age Population (CVAP) by race and ethnicity – every year for the Department of Justice. The data are generally released several weeks after the annual ACS release.
Last year, we hosted this data as pre-configured layers and maps in ArcGIS Living Atlas, when the data vintage was the 2017-2021 ACS. Geography levels included are the nested set of nation -> state -> county -> tract -> block group, as well as congressional and legislative districts, and finally places and minor civil divisions. The feature layers have all the details and enhancements you’d expect from Living Atlas:
- water-cut polygons
- informative aliases and field descriptions
- thoughtful symbology that works on a variety of basemaps
These layers are here to support the important work that many GIS analysts are doing:
- studying voting requirements
- identifying discriminatory voting practices and procedures
- voting rights analysis
- voter turnout analysis
For all of these topics, analysts need to know how many people voted as a percent of how many people are eligible to vote, not just as a percent of total population. Eligible voters are those who are citizens 18 years of age or over.
The layers and items in ArcGIS Living Atlas are now updated with the most recent 2018-2022 5-year estimates.
Not just new data, but new boundaries too
There were significant changes to counties (now planning regions) in Connecticut. This affected the county subdivisions / minor civil divisions, tracts, and block groups in Connecticut as well.
Also, the data for the Congressional District layer are now tabulated for the 118th congressional districts, whereas last year the data was tabulated for the 116th congressional districts. Differences include Montana gaining a seat, going from one district to two; and California losing a seat, going from 53 to 52.


There are also minor changes within the Place layer, as places (such as cities, townships, and villages) go through both inventory changes and boundary changes frequently.
Use CVAP content in your work
Just as with all feature layers in Living Atlas, you can incorporate CVAP layers in your mapping and spatial analysis workflows. Take it one step further and use the smart mapping, analysis, and data visualization capabilities across all ArcGIS products, including ArcGIS Pro and ArcGIS Insights.
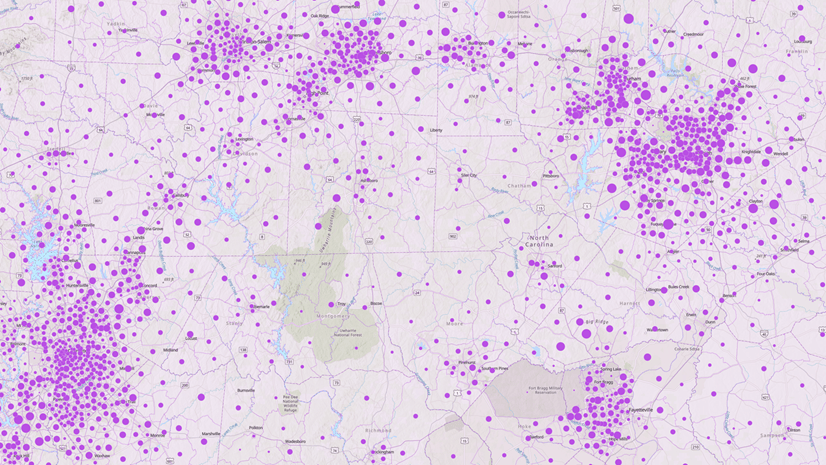
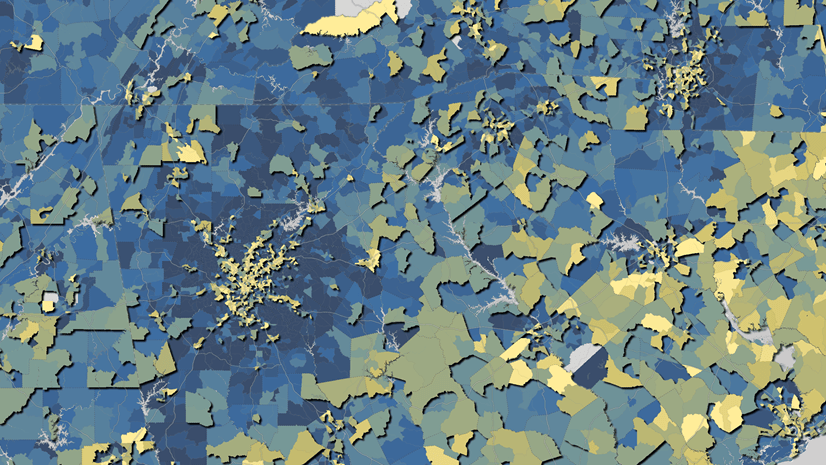
Clear and informative maps are often key pieces to many decision-support and accountability conversations. That’s why Living Atlas also has maps and instant apps as additional content items. For example, this web map entitled “What Percent of People are in the Citizen Voting Age Population (CVAP) Here?

Teal areas have a higher percentage than the national rate, whereas purple areas have a lower percentage. Lower percentages are due to a large youthful population, a large non-citizen population, or both. We took this web map and placed it into a few different Instant Apps. Each Instant App template allows you to showcase your web map as a focused experience for your audience.
The Inset App allows us to display Alaska, Hawaii, and Puerto Rico in the same view as the continental United States.

The Sidebar App allows us to highlight our big and beefy pop-up with the table and chart that shows even more information.
 for San Bernardino County appears in the side panel.")
Other popular Instant App templates include Attachment Viewer, Chart Viewer, Countdown, and Nearby. It all depends on what you want to communicate to your audience. In addition to ArcGIS Instant Apps, web maps also flow into ArcGIS StoryMaps, ArcGIS Dashboards, ArcGIS Experience Builder, ArcGIS Survey123, and many other products.
How do you see your organization using the CVAP content in Living Atlas? Share on Esri Community’s ArcGIS Living Atlas space. On there, you can post questions to other GIS practitioners, and exchange ideas. Connect with others on Esri Community’s GIS for Equity and Social Justice space.


Article Discussion: