Voting gives people a voice in how a country is run. The Voting Rights Act of 1965 prohibits discriminatory voting practices and procedures, enforcing the 15th Amendment to the Constitution. The National Voter Registration Act of 1993 (popularly known as “the Motor-Voter Law”) made registering for a driver’s license serve as simultaneous voter registration.
Even with these landmark pieces of national legislation in place, access to voting varies widely. Some states have embraced vote-by-mail for everyone, expanded early voting times, and have election-day voter registration at polling places, whereas some states have taken more restrictive measures.
For voting rights analysis, you need to know how many people voted as a percent of how many people are eligible to vote, not just as a percent of total population. Eligible voters are those who are 18 years of age or over, and are citizens – either “natural” citizens (people who are U.S.-born or people born abroad to U.S. parents), or “naturalized” citizens (people born outside the U.S. who have fulfilled the requirements established by Congress in the Immigration and Nationality Act). At the request of the Department of Justice, the U.S. Census Bureau publishes an annual Citizen Voting Age Population (CVAP) by Race and Ethnicity special tabulation from the American Community Survey 5-year estimates.
Now in Living Atlas
We are happy to announce that CVAP items are now available in ArcGIS Living Atlas. These layers are here to support the important work that many GIS analysts are doing: working to eliminate inequities and ensure voting legislation is not being violated.

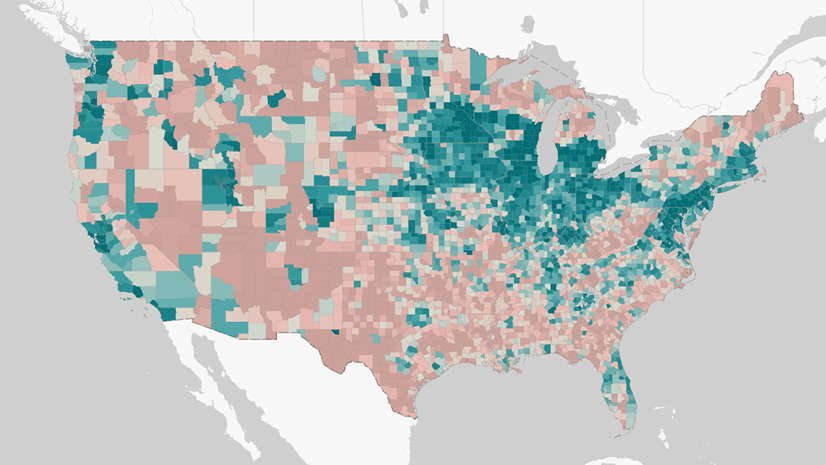
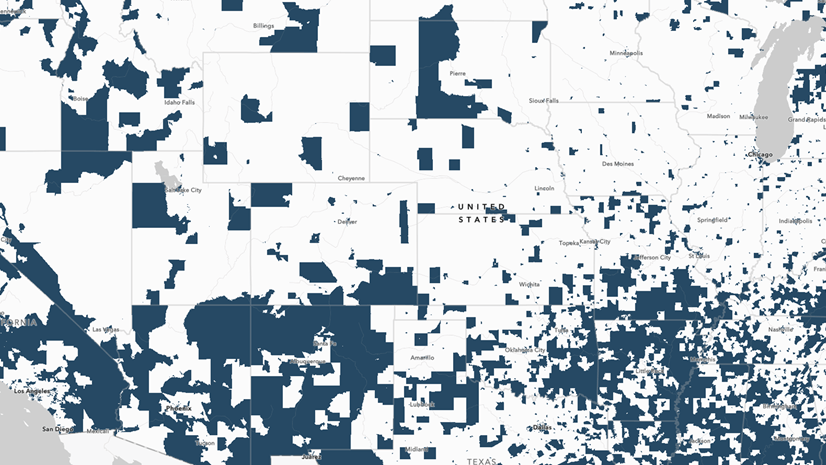
The 10 different geography levels tabulated by the Census Bureau have been combined into three layers, pictured above. Nested geographies (nation -> state -> county -> tract -> block group) are included in one multi-scale layer. The 116th congressional district boundaries and the two state legislative district boundaries have been grouped into another layer. Finally, places (such as cities, townships, and villages) and minor civil divisions are grouped in another layer again.
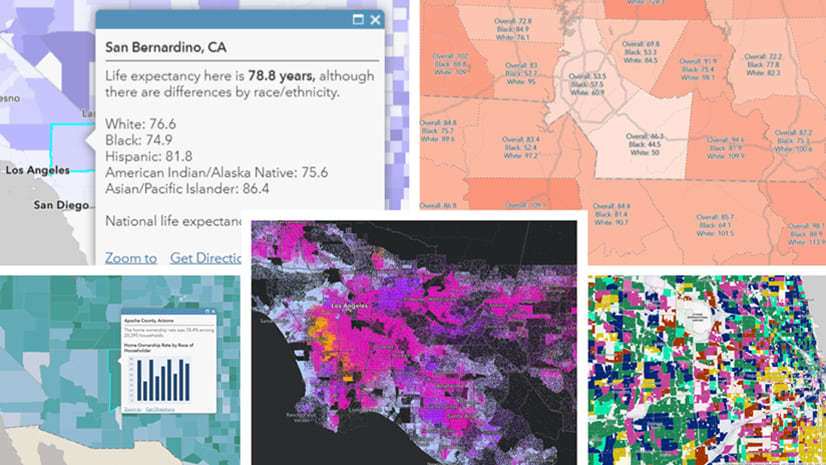
Unlike many other American Community Survey data tables that present race & ethnicity data, CVAP data includes the four most common “two or more” or multiracial groups in addition to the single-race groups. These more detailed race and ethnicity groups are displayed in the pop-up.

Another difference between the special tabulations of CVAP data and the standard American Community Survey data is that CVAP estimates are rounded the nearest 5. Notice that the estimates in the pop-up end in either 0 or 5. Therefore, sums may not add up to totals exactly.
The feature layers also have all the typical enhancements you’d expect from Living Atlas: water-cut polygons, informative aliases and field descriptions, and thoughtful symbology that works on a variety of basemaps.
Updated every year
The layers will be updated every year following the Census Bureau’s CVAP release (usually around February). Many Living Atlas layers have a similar update plan: ACS layers, BLS unemployment layer, Alternative Fuel Charging Stations, and more. When new data is released from the source, the values in the layers’ attribute tables are updated. This means that any maps using these layers will display the most recent data. You can export the data from the item page (when signed in) if you’d like to preserve the data values for a particular point in time.
For the layer containing congressional and state legislative districts, expect significant boundary changes as well! The estimates that will be released in early 2024 will reflect the 118th Congressional Districts.
How can I use these layers?
Create your own maps and visualizations, as well as in geoprocessing and analysis.
Use CVAP layers to create your own maps and visualizations
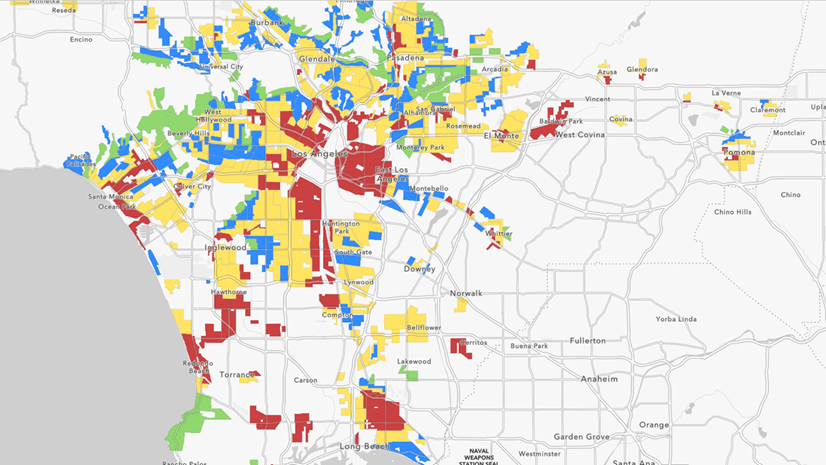
Add one of the layers into a web map straight from Living Atlas. Perhaps start by filtering to your state, changing the symbology using the many drawing styles, and modifying and pop-up configuration to better serve your needs. Turn off unnecessary layers for your purposes. Use blend modes and layer effects to give your map extra polish. Then, use your customized web map in an Instant App, dashboard, or web experience.
For example, this Chart Viewer app, which shows a chart with CVAP disaggregated by all the race/ethnicity groups available in this layer, as well as two additional charts on the right side: CVAP by single race group and by multiracial group.
, and a pie chart of the multiracial groups.")
Since these layers will be updated following new releases from Census, your maps will always display the most recent data.
Use CVAP layers in your geoprocessing and analysis
Work with this layer and utilize the analysis tools in ArcGIS Online, ArcGIS Insights, or ArcGIS Pro for even more possibilities. Quantify the patterns in the data and determine whether or not the patterns are significant. Select by attributes to reveal which counties, tracts, or block groups are of most interest to you. Combine it with additional spatial data, such as state voter registration data, to answer all kinds of questions.
Potential questions to answer
- How does the CVAP population differ from the total population that includes children and individuals who are not U.S. citizens?
- What is the most common multiracial group in my community? Does this differ from the most common multiracial group of people over 18 years? Or from the most common multiracial group of citizens?
- Where do we need more polling places for the next election?
How will you map the Citizen Voting Age Population?
Just as with all feature layers in Living Atlas, you can incorporate CVAP layers in your mapping and spatial analysis workflows. Clear and informative maps are often key pieces to many decision-support and accountability conversations. What maps will you make from Citizen Voting Age Population data?
Feel free to engage with Esri Community’s ArcGIS Living Atlas space to ask other GIS practitioners questions, and share how you’re using this layer. Connect with others on Esri Community’s GIS for Equity and Social Justice space.


Article Discussion: