The June 2023 Broadband Data Collection (BDC) is now available within ArcGIS Living Atlas. This ready-to-use layer shows fixed broadband availability for every Census Block and H3 Resolution-8 hexagonal area in the U.S. and outlying territories. The layer summarizes the June 2023 BDC data showing the number of served, underserved, and unserved Broadband Serviceable Locations (BSLs) by transmission technology in a given geography. It is a composite of six sublayers – State, County, Tract, Block Group, Block, and H3 Resolution-8 hexagons – each with a related table listing all Internet Service Provider (ISP) offerings by technology and speed tier.
About the BDC
The BDC is a combination of two datasets:
- Broadband Serviceable Location (BSL) Fabric. This is a dataset of all locations in the United States and Territories “where fixed broadband internet is or could be installed.” It was developed by CostQuest in consultation with the FCC and is updated twice a year.
- Broadband Availability. This shows what broadband services are available at locations included in the Fabric. It is reported by Internet Service Provides (ISPs) to the FCC every six (6) months
This layer shows the number of Broadband Serviceable Locations (BSLs) in a given geography by their corresponding speed tier for June 2023. Version 3 of the Fabric is the base of the current map. The speed tier is defined by speed and latency and each BSL is bucketed into one of three categories:
- Served – low-latency Fiber, Cable, Copper, or Licensed Terrestrial Fixed Wireless offering of speeds greater than or equal to 100/20 Mbps.
- Underserved – low-latency Fiber, Cable, Copper, or Terrestrial Licensed Fixed Wireless offering of speeds less than 100/20 Mbps, but greater than or equal to 25/3 Mbps.
- Unserved – all service that is not low-latency or less than 25/3 Mbps, and all Geostationary Satellite, Non-geostationary Satellite, Unlicensed Terrestrial Fixed Wireless, and Other.
For more information about the Broadband Data Collection in ArcGIS Living Atlas of the World, please see this blog which describes the significance of the data and its origins.
More information on how the layer can be used by communities to improve broadband connectivity can be found on the Esri Telecom Community. This blog describes how to create transmission technology footprints, and this blog describes how to create provider footprints.
Layer Enhancements and Changes
With this update, many new attributes were added to provide opportunities for comparison with earlier versions of the BDC. Now included are the number of BSLs unserved, underserved, and served – by transmission technology – for both six and 12 months previous. This provides summary statistics for the first three releases of the BDC in a single layer!
The following pop-up shows an example of how much these data have changed for a single county. Having the ability to easily interrogate changes over time is critical to helping communities continue to improve the data. And, this information will also be important to tracking progress as networks are built through the $42.5 billion Broadband Equity, Access, and Deployment (BEAD) Program.
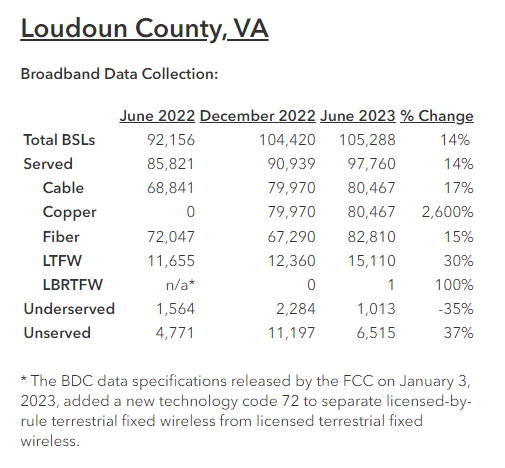
These new historical and percent change fields enable local officials, businesses, and researchers to understand how the dataset has evolved over its three initial releases. Much of these changes are a result of the BDC Challenge Processes. Internet Service Providers (ISPs) are also improving their reporting as they get accustomed to the new methodology and marrying their data with the Fabric. We hope this new layer helps communities understand change and continue to improve the underlying data.
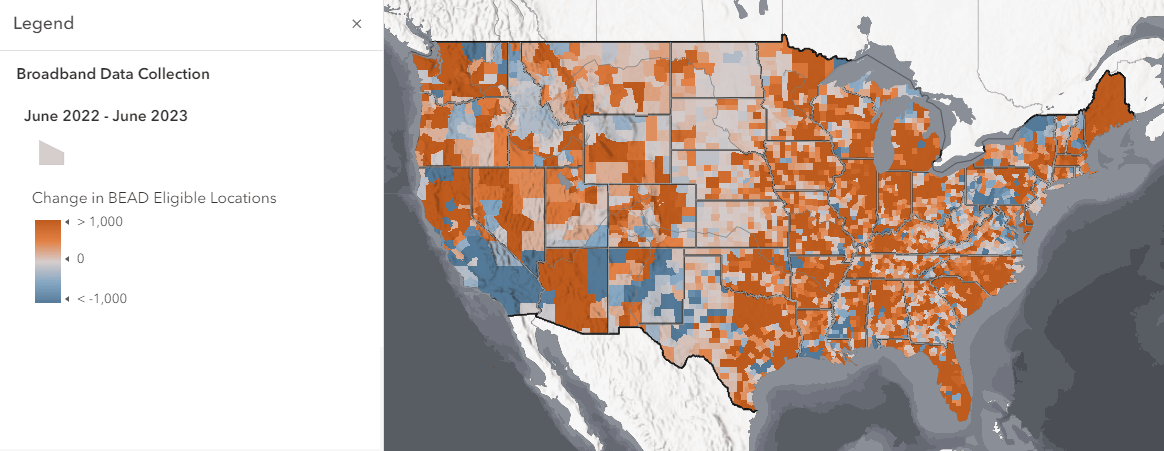
As with previous versions of the layer, the default symbology shows the number of BEAD eligible locations. A BSL is eligible for BEAD funding if it is unserved or underserved. The map above shows the change in the number of BEAD eligible locations from the June 2022 BDC release to the June 2023 release. You can investigate all of the changes for the three BDC releases with this interactive web map of US counties.
We look forward to seeing how you use these new fields and encourage you to share your work and your thoughts with us. We plan to continue maintaining the layer and making improvements. We already have some ideas for additional attribution and would love to hear what is meaningful for you.
Happy Broadband Mapping!!!


Article Discussion: