Land use/land cover (LULC) maps are an increasingly important tool for decision-makers at local, regional, and national levels around the world. LULC maps can help us to quantify and better understand the impacts of earth processes and human activity on our environment. This information helps inform policy and land management decisions that support sustainable development.
ArcGIS not only provides users with the capabilities necessary to produce and share data and maps such as LULC, it also provides all the capabilities necessary to derive and disseminate insights. Data extraction is foundational. Getting the right information into the hands of land managers and decision makers is invaluable. As we seek to reveal insights from land use/land cover maps, two fundamental aspects come to mind: 1) timeliness of the data and maps, and 2) change analysis. Fortunately, we are able to provide both.
Highlighting these key capabilities, we are pleased to announce Sentinel-2 Land Cover Explorer, a new web-based mapping application built on the ArcGIS API for JavaScript. Let’s take a look.
Timely Maps
In 2021, in partnership with Impact Observatory and Microsoft, Esri released the first artificial intelligence (AI)-generated global 10-meter LULC map derived from European Space Agency (ESA) Sentinel-2 imagery. This effort subsequently evolved into the annual nine-class time series map available from ArcGIS Living Atlas of the World today. Thanks to the unique deep learning model developed by Impact Observatory, an entire year of observations can be processed, and a global map produced, in a matter of days. We most recently added 2022 to the Sentinel-2 10m Land Use/Land Cover Time Series, expanding the series to include global coverage from 2017 through 2022. For more information on the LULC data and maps, including accuracy assessments, see the ‘Additional Resources’ section at the bottom of this article.
Change Analysis
The aforementioned annual updates allow for detecting year-to-year shifts in vegetation and crops, forests, bare surfaces, and urban areas. Sentinel-2 Land Cover Explorer provides a dynamic and intuitive interface for detecting, displaying, and reporting change.
Visual Change Analysis
The app provides two different modes for visualizing land cover change: ‘Step’ mode and ‘Swipe’ mode.
In Step mode, you can either use the time slider to click through each year, or you can click the play button to enable an automated animation of the map.
In Swipe mode, you are able to interactively select and compare two years side by side.
If you are interested in visualizing a single class at a time, simply click on a class name to filter the map display.
Statistical Change Analysis
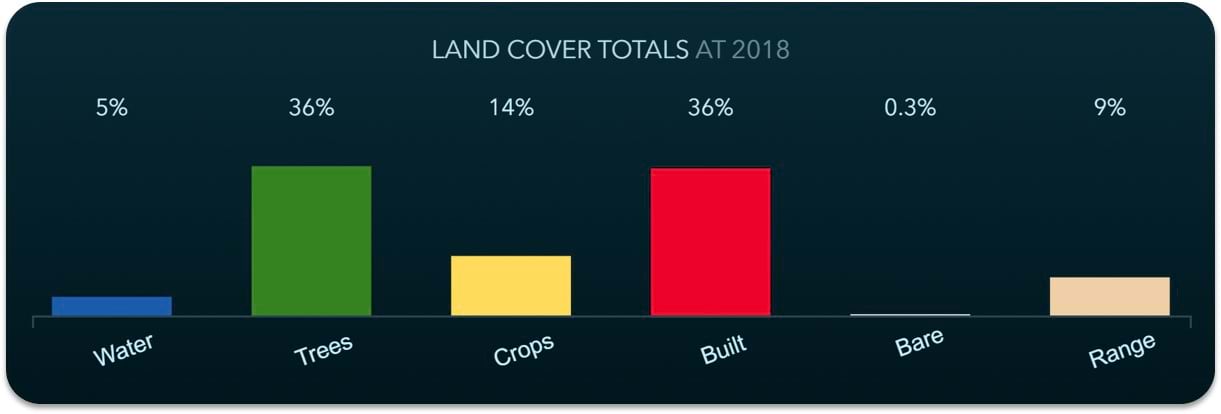
In conjunction with the changes displayed in the map view, statistical coverage charts are provided in each mode.
In Step mode, where each year is displayed one at a time, the app dynamically reports the coverage of each class as a percentage of your current map extent.
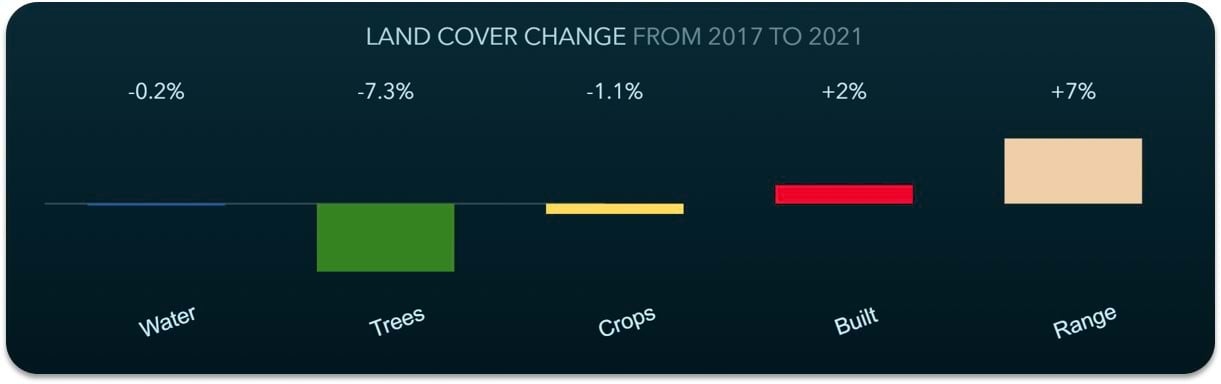
In Swipe mode, where two years are displayed at once, the app dynamically calculates coverage change for each class as a percentage of your current map extent.
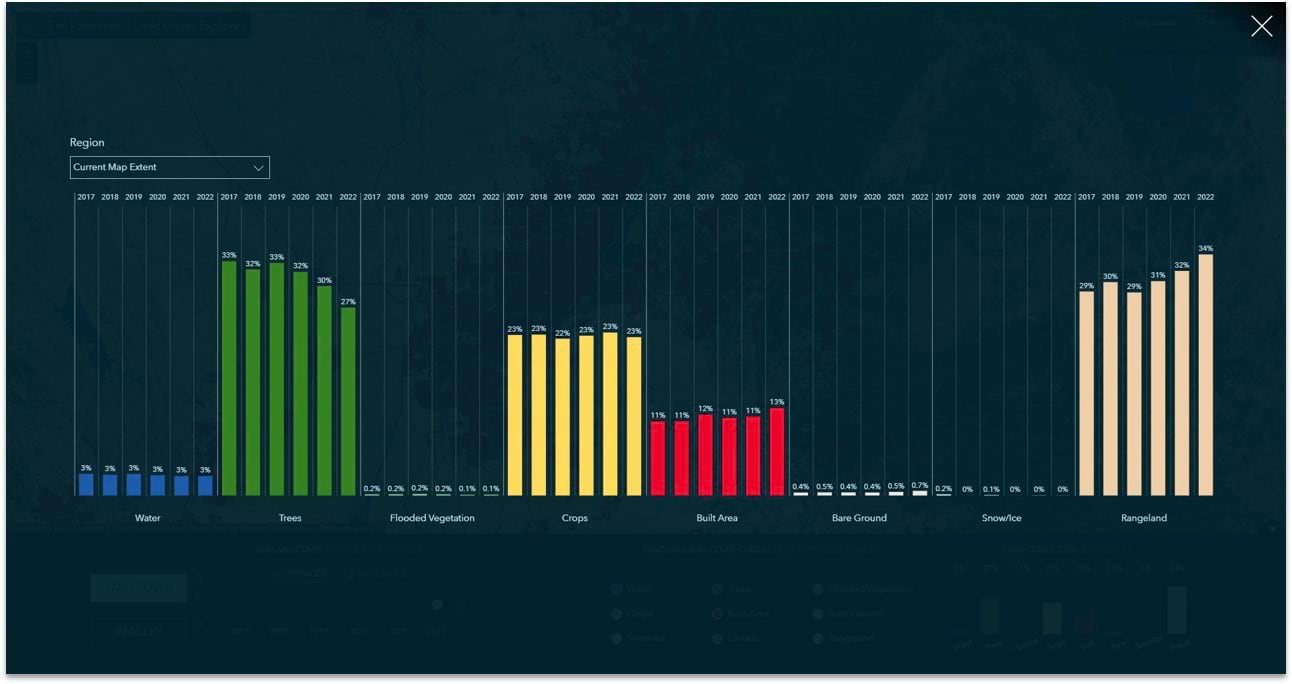
At any time, you can choose to expand the on screen chart. The expanded view provides statistical coverage trends across class and time for your current map extent or for your selected region and sub-region.
Visual Validation
If you wish to visually validate the land cover classification, you can enable the ‘Imagery’ mode to display the Sentinel-2 Level-2A imagery from which the land cover was derived. With the imagery, you can leverage both Step and Swipe modes. You can also choose from various multispectral renderings and indices depending on your inquiry. For example, you might choose band combinations including infrared (IR) which might help identify changes in vegetation, including burn areas resulting in loss of tree cover.
Offline Use
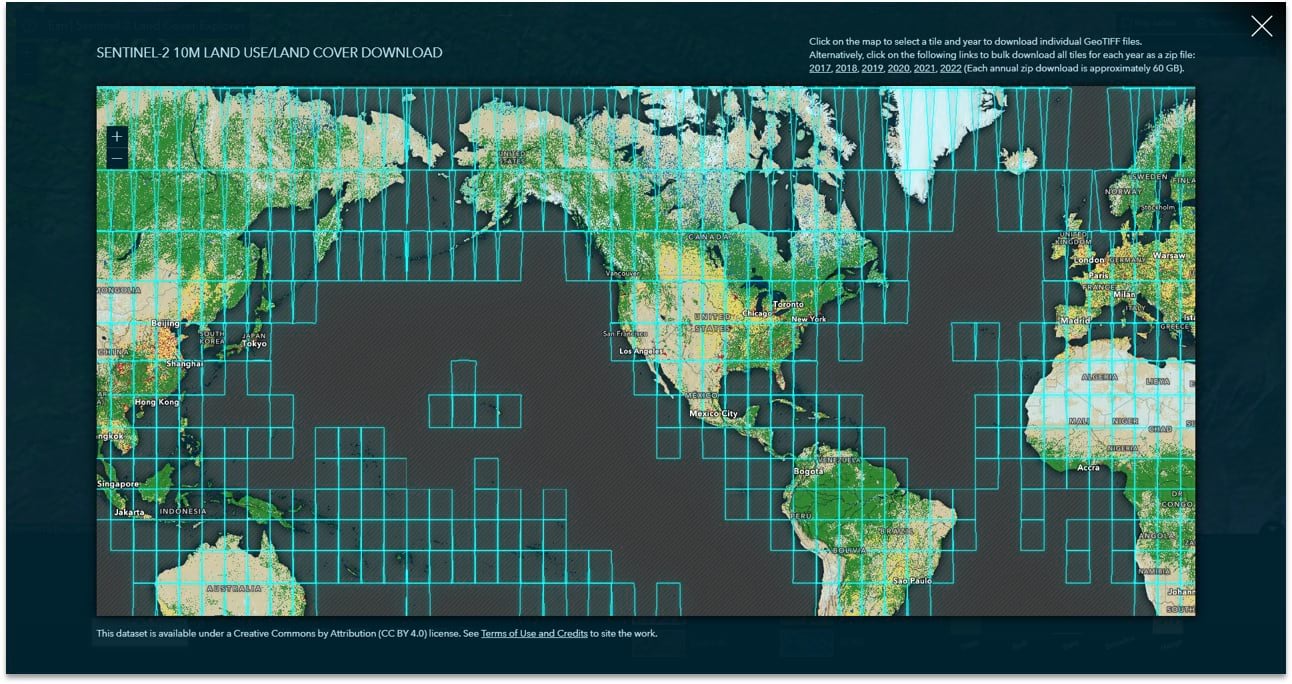
If you wish to take the LULC data for offline analysis, you can leverage the Land Cover Download mode within the app. There you can select a single geography and year, or you can download global coverage by year using the annual hyperlinks provided.
Save and Share Your Views
As demonstrated in the hyperlinked images throughout this post, the app URL’s from your browser include your current location along with selected years and modes, which makes it easy to bookmark views for yourself and also share with others.
NOTE: Each time you open the app from the base URL, it will bring you to a unique location to explore.
Additional Resources
Sentinel-2 Land Cover Explorer joins a suite of apps in ArcGIS Living Atlas demonstrating capabilities and patterns of use within the ArcGIS system. If you wish to leverage or expand upon the capabilities demonstrated in Sentinel-2 Land Cover Explorer, feel free to access the code repository on GitHub.
Esri Land Cover in ArcGIS Living Atlas of the World
Sentinel-2 10m Land Use/Land Cover Time Series Methodology & Accuracy Summary
Global 10 m Land Use Land Cover Datasets: A Comparison of Dynamic World, World Cover and Esri Land Cover
It takes a team…
App Inspiration: John Grayson
Content Development: Vijay Pawar and Abhijit Doshi
DevOps: Sreekumar Sreenath
Release and QA: Laurie Fitzpatrick and Saravanan Rajaram
App Design: John Nelson
App Development: Jinnan Zhang

Article Discussion: