Esri’s new Maps for Public Policy site gives you instant access to hundreds of policy maps that reveal important facts about your community.
At esri.com/policymaps, you can explore issues, such as housing, healthcare, or education, across the country or just in your community. Build a map collection, and easily share it with stakeholders to inform policy decisions.

“A policy map is a map where the opportunity to intervene is made clear.”
The Maps for Public Policy site debuted recently at the National League of Cities’ annual conference called City Summit, where city majors and leaders convene to solve common challenges and learn ways to improve local communities. The 2018 City Summit took place in November in Los Angeles. Our very own Jack Dangermond was a keynote speaker! His presentation included a demo of the Maps for Public Policy site. Attendees saw how easy it is to see what maps are available on issues important to their community.
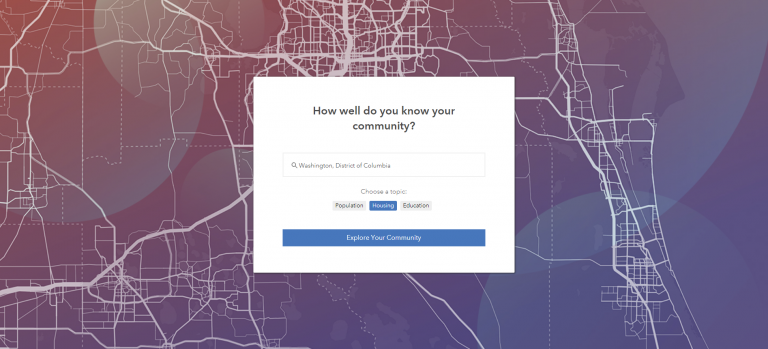
Explore Your Community
The Maps for Public Policy site is full of maps that are meaningful at a glance. Many of the maps contain data for the entire United States, but when you search your city, all maps are quickly zoomed to display what situations look like at the local level. You can view maps on a topic that’s important to your local area, and collect the maps you need to tackle today’s community challenges, such as the costs of housing, healthcare, and education.

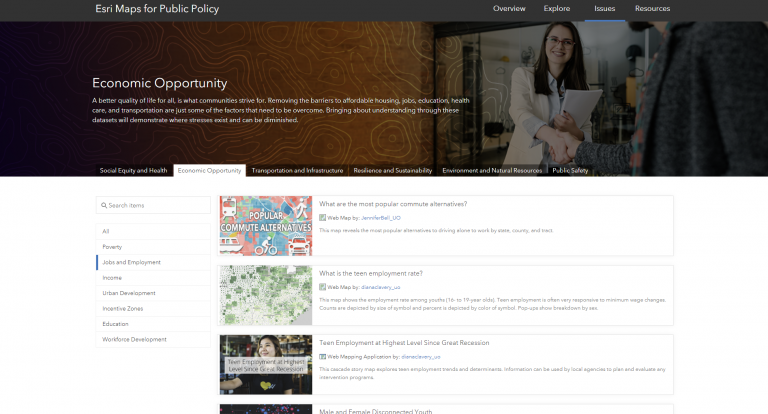
Browse Issues
Browse through layers and maps that you can use in your work, and get inspired by viewing the apps that other communities have built. Most importantly, answer questions that community members have. All maps, apps, and data layers are categorized by issue to make them discoverable by those who are interested.

The major categories are:
- Social Equity and Health
- Economic Opportunity
- Transportation and Infrastructure
- Resilience and Sustainability
- Environment and Natural Resources
- Public Safety
Explore maps, apps, and data layers that provide necessary context for your research, analysis, and policy recommendations for issues important to your community. With an ever-growing collection of data layers, maps, and apps categorized by topic, it’s easy to find maps on the issues you care about, such as healthcare coverage or prescription disposals.
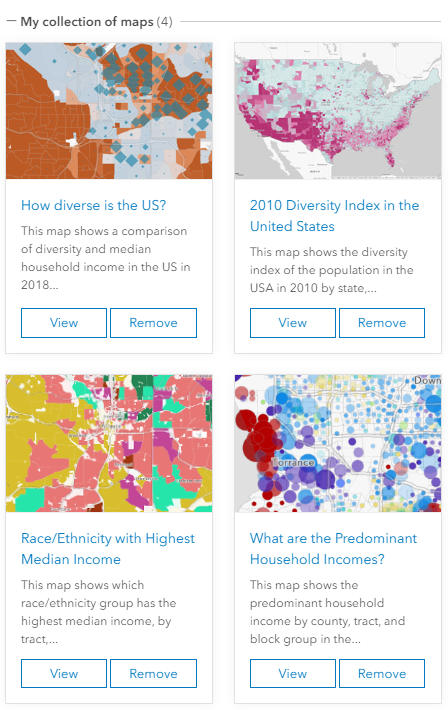
Build a Collection of Maps
When you come across a map you like, add it to your collection. You can build a collection of the maps you need to inform decisions, and then easily share your collection with others. For example, you can obtain and visualize baseline information on education, income, diversity, and other demographics for multiple policy issues. Maps such as these ones are available at your fingertips on the Maps for Public Policy site.

Take it a step further and use maps from this site to author your own story map, which allows you to provide the context that is appropriate for your audience.
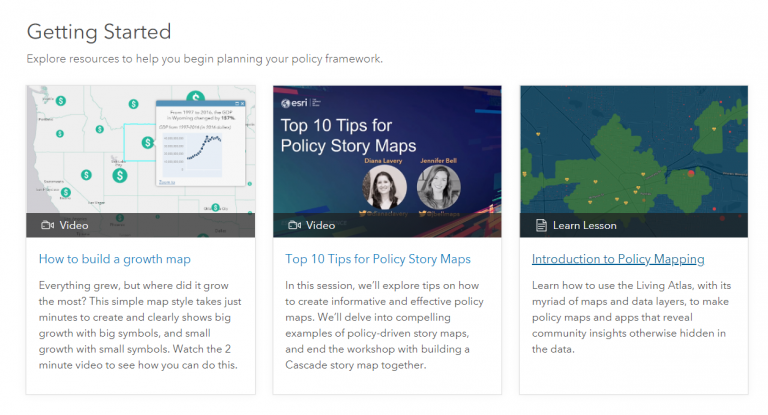
Use the Resources to Make Your Own Policy Maps
Use the training resources available to learn how to make strong policy maps for your community. Through the Policy Mapping Learn Lessons, videos, and other guides available, you’ll be equipped to answer questions, such as which intersection near Pasadena schools is most in need of an intervention such as a crossing guard, street sign, or bike lane?
Communities such as Tempe, Arizona and Leon County, Florida are just two of the many examples of local governments using the principles of policy mapping to improve their communities.

Check out the site
Explore the curated content, training, best practices, and datasets that can provide a baseline for your research, analysis, and policy recommendations. Maps for data-driven policy are available to everyone at esri.com/policymaps. Free for you. Free for your community.
Visit Us at Fed GIS
Going to the Federal GIS Conference in Washington next week? Stop by our exhibit outside the Plenary area to learn more about Esri Maps for Public Policy.

Commenting is not enabled for this article.