In collaboration with Maxar Technologies, Esri provides ArcGIS users with access to the National Urban Change Indicator (NUCI) via ArcGIS Living Atlas of the World. In short, NUCI is a conterminous United States index of persisted urban and human-related changes over time. What does this mean? How can I access it? What can I do with it? Great questions, let’s find out.
Persisted Changes
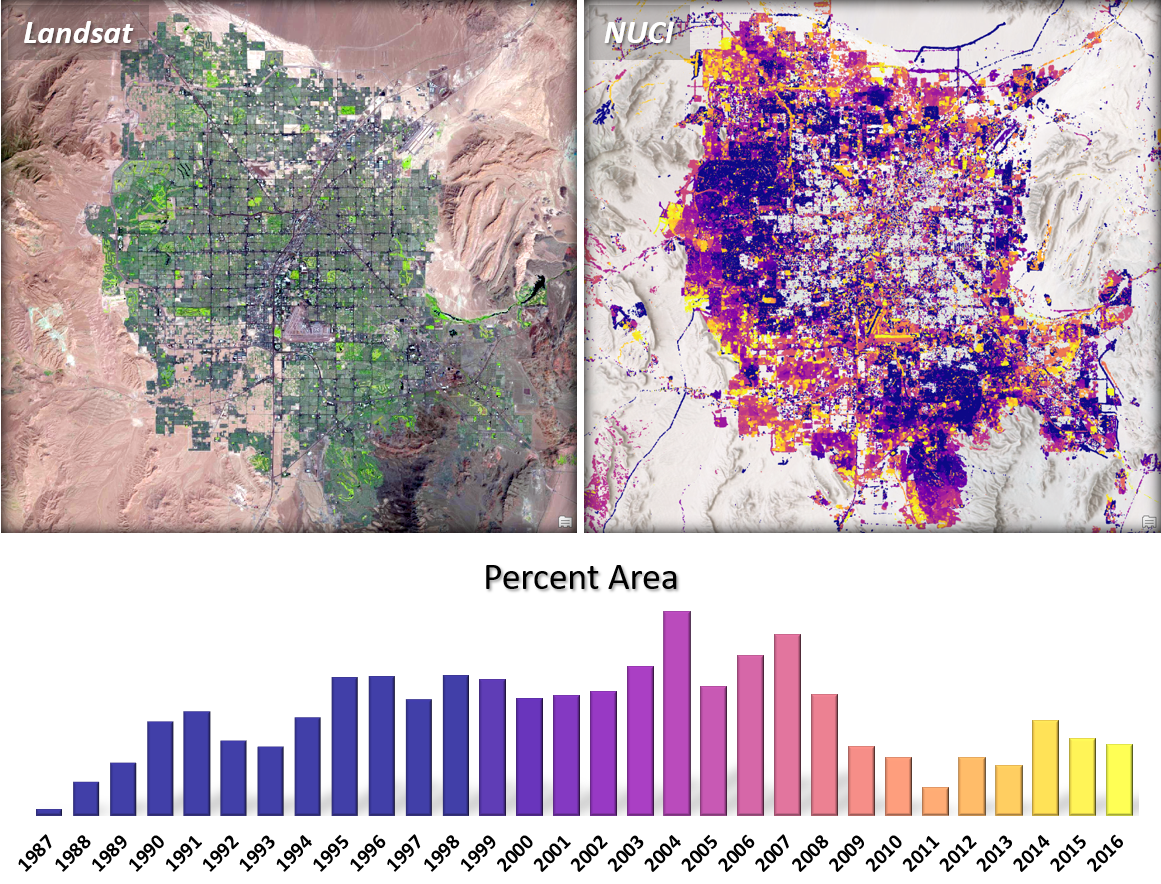
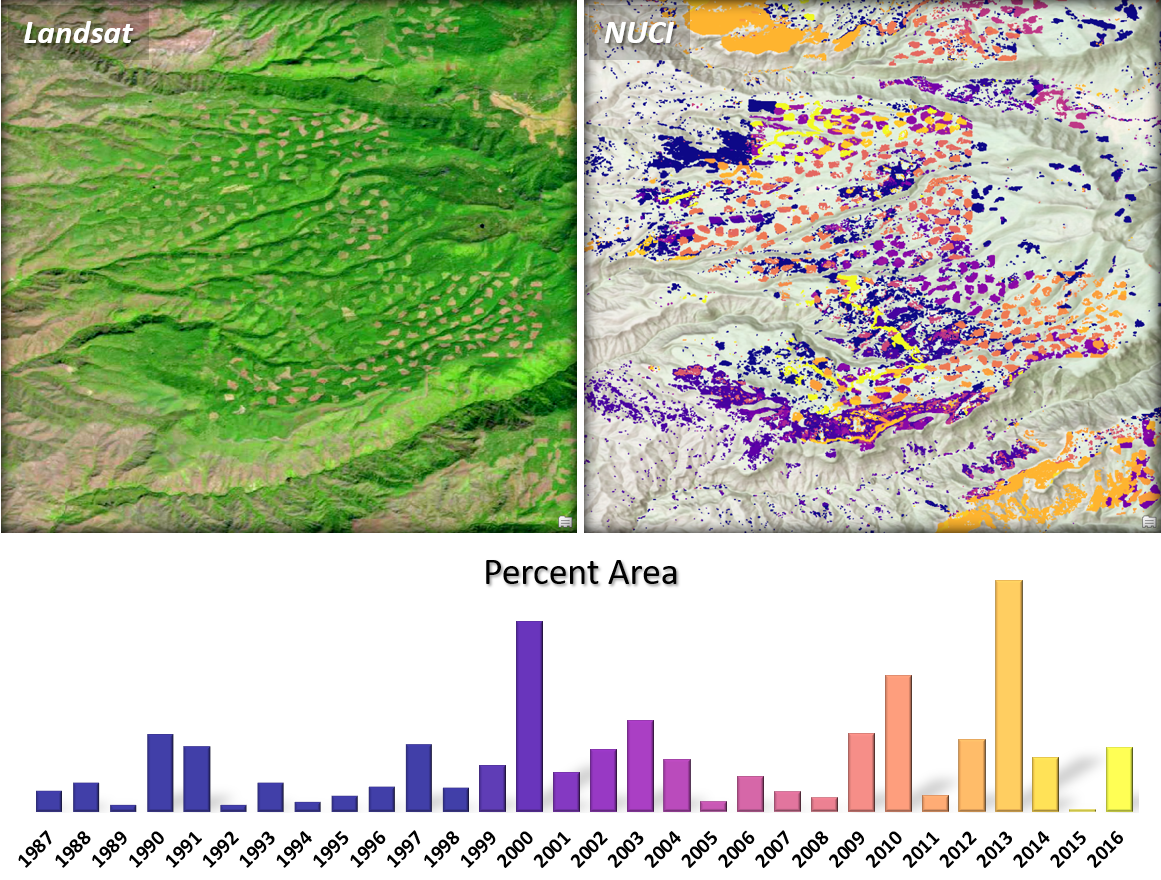
NUCI is product of Maxar’s Persistent Change Monitoring (PCM), an image-based change detection process that isolates changes that persist over time, and more specifically, urbanization and other human-related changes. The NUCI database provides a history of change areas, represented as polygons, on an annual basis from 1987 through 2016.
With traditional image-to-image change detection methods, distinguishing among spurious, seasonal, and persisted changes can be difficult and time consuming. With NUCI, all of the work has been done for you. Over 13,000 multi-temporal Landsat images were analyzed, and the results filtered, enabling you to readily focus on thirty years of persistent land cover changes.
Direct Visual Interpretation
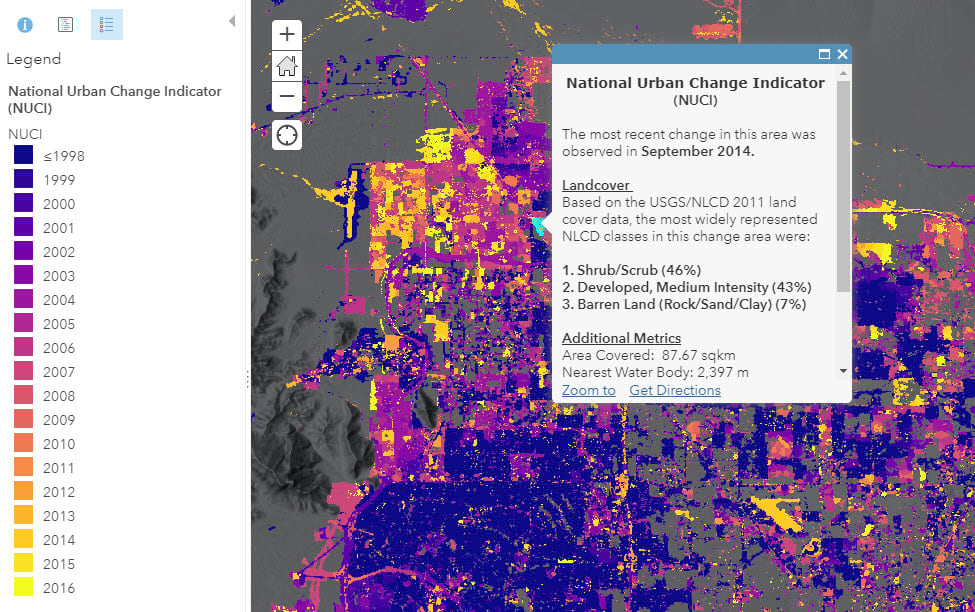
NUCI is available in Living Atlas for visualization. Change areas in this layer have been symbolized to show the year in which each change occurred. Patterns and concentrations of change over time can be readily observed. You can point and click on a change location of interest to get more information about that change. Along with inherent attribution such as date of change, the NUCI database is also attributed with data elements extracted from co-registered geospatial data such as the National Land Cover Database (NLCD).
Analysis Ready
NUCI is also available in the Living Atlas as a feature layer for use as input to analysis tools in ArcGIS Online and ArcGIS Pro.
Below are a couple basic examples using NUCI as input to the Summarize Within tool to gain insights on change over time.
Urbanization
Deforestation
Combining NUCI with other ArcGIS tools and data can uncover even greater insights. The Federal Emergency Management Agency (FEMA) uses NUCI in conjunction with data such as river flow and historic rain data to support tracking urban change and flood risk mapping.
Your Analysis
Try some of these Living Atlas search categories where you can find many authoritative layers to combine with NUCI in your analysis:

Commenting is not enabled for this article.