Picture it: Philly, 1985. A young boy is up at the wee hours of the morning as a scary, strong storm has knocked out the power. It was the first time I ever heard the term “hurricane.” Hurricane Gloria.

Suppose you wanted to find and analyze historic storms like Gloria, how would you do it? Typically, it’s a process of looking the storm up on Wikipedia or maybe NOAA’s awesome Historical Hurricane Tracks app, then going to the IBTrACS website to download shapefile, CSV, or netCDF data, sort through the fields to find the events of interest.
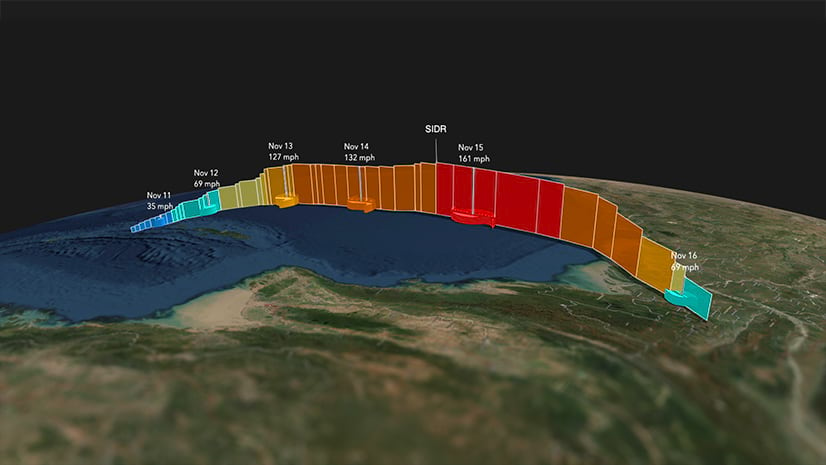
Or you could use the Historic Hurricanes layers in ArcGIS Living Atlas of the World. Now updated with the 1842-2020 archive, every storm’s position and intensity data can be accessed using the official IBTrACS data maintained by NOAA NCEI. Tracking down Gloria now takes a few seconds.

Analyzing Space-Time Patterns in Hurricane Activity
Not only do the point and track line layers provide a simple way to create informative maps of storm events, but these layers can also power in-depth analyses of trends or risk. There are nearly 13,500 storms included in this archive, so teasing out trends in storm numbers, regional activity, intensity, season duration, etc. can be quite a complex undertaking without the tools available in ArcGIS Pro.

To start, by animating through the dataset by decade, we can see a definite bias that is primarily due to the advent of satellite observations, providing global coverage starting in the early 1980s. Until then, storm observations we based primarily on ship records in well-traveled areas. We’ll start our analysis by filtering out storms before 1980.

Next we can start to restructure the spatial and temporal organization of the data to elucidate patterns across space and time. We’ll be using the Space-Time Pattern Mining toolbox in ArcGIS Pro, beginning with the Create Space Time Cube by Aggregating Points on the points version of the dataset. The tool will divide the storms into 500,000 km2 hexbins (new spatial structure) and aggregate them across years (new temporal structure) and include a summary field of mean wind speed.

The one trick when using the hexagon grid is determining the distance interval. The tool is looking for the short diagonal length of the hexagon. I’ve found this website incredibly useful – enter the area you want and it provides the short diagonal.
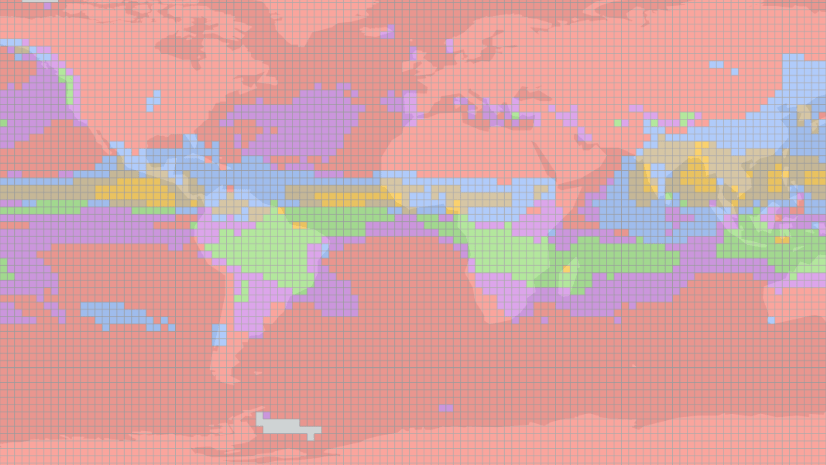
After running the tool, the netCDF output can be visualized. The first thing I typically look at are the trends. In this map we can see that the frequency of storms has an increasing trend (orange hexbins) in some populated areas such as the southeast US, Central America, northwest Mexico, and eastern India.
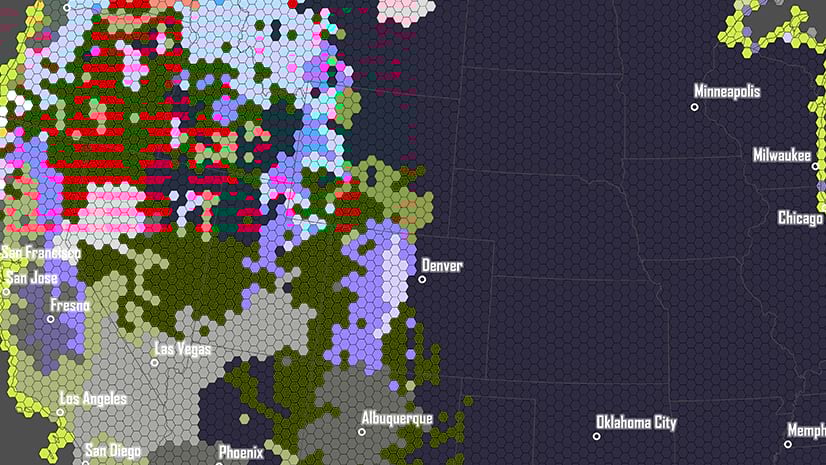
Another incredibly detailed output of this data comes from the Emerging Hot Spot analysis. This tool provides more specificity in the trend over time.

I’ve run this tool not on the frequency but on the mean wind speed value. Interestingly, most of the populated regions are hot spots for more intense hurricane, typhoons, or cyclones.
Variations on an Analysis
What next? The areas of interest or risk could be enriched with population and demographic information, or even components of the landscape such as elevation/slope, surface type, etc. These similar tools can also be run of different spatial and temporal subsets of the data, or filters on the storms (e.g., trends of Category 4 and 5 storms at much coarser scales). Another area of emerging concern is the linear speed of storms, as we’ve seen a recent spate of slow moving, strong storms that cause significant damage to populated areas.
These archives of hurricane tracks can be used in concert with other layers in Living Atlas, such as Active Hurricanes, Cyclones, and Typhoons (shows only present storms) and Recent Hurricanes, Cyclones, and Typhoons (shows the archive of the current calendar year).

hello please can u send me topography world shapefile without lebles