Using the REST service URL to build maps and apps is no longer a best practice. Here’s what you’re missing out on if you’re not using the ArcGIS Online Item…
How many of us have done this?

…or this?

It’s the typical pattern we were taught to use with web GIS: find the REST endpoint; copy and paste it into your project. But when you do that, you’re just making life more difficult on yourself. What most people don’t realize is that the Item in an ArcGIS Online Portal is very different from the Service (or REST endpoint).
You can think of the Item as being a specific configuration of a Service. There can be many of these different configurations, and each has a unique ID that can be used to easily access the item anywhere in ArcGIS.
These unique configurations can add a ton of other additional valuable information on top of the baseline service, such as
- Custom cartography
- Configured pop-ups
- Improved metadata and provenance
- Raster functions
- Views (subsets of feature layers)
A Tale of Two Layers
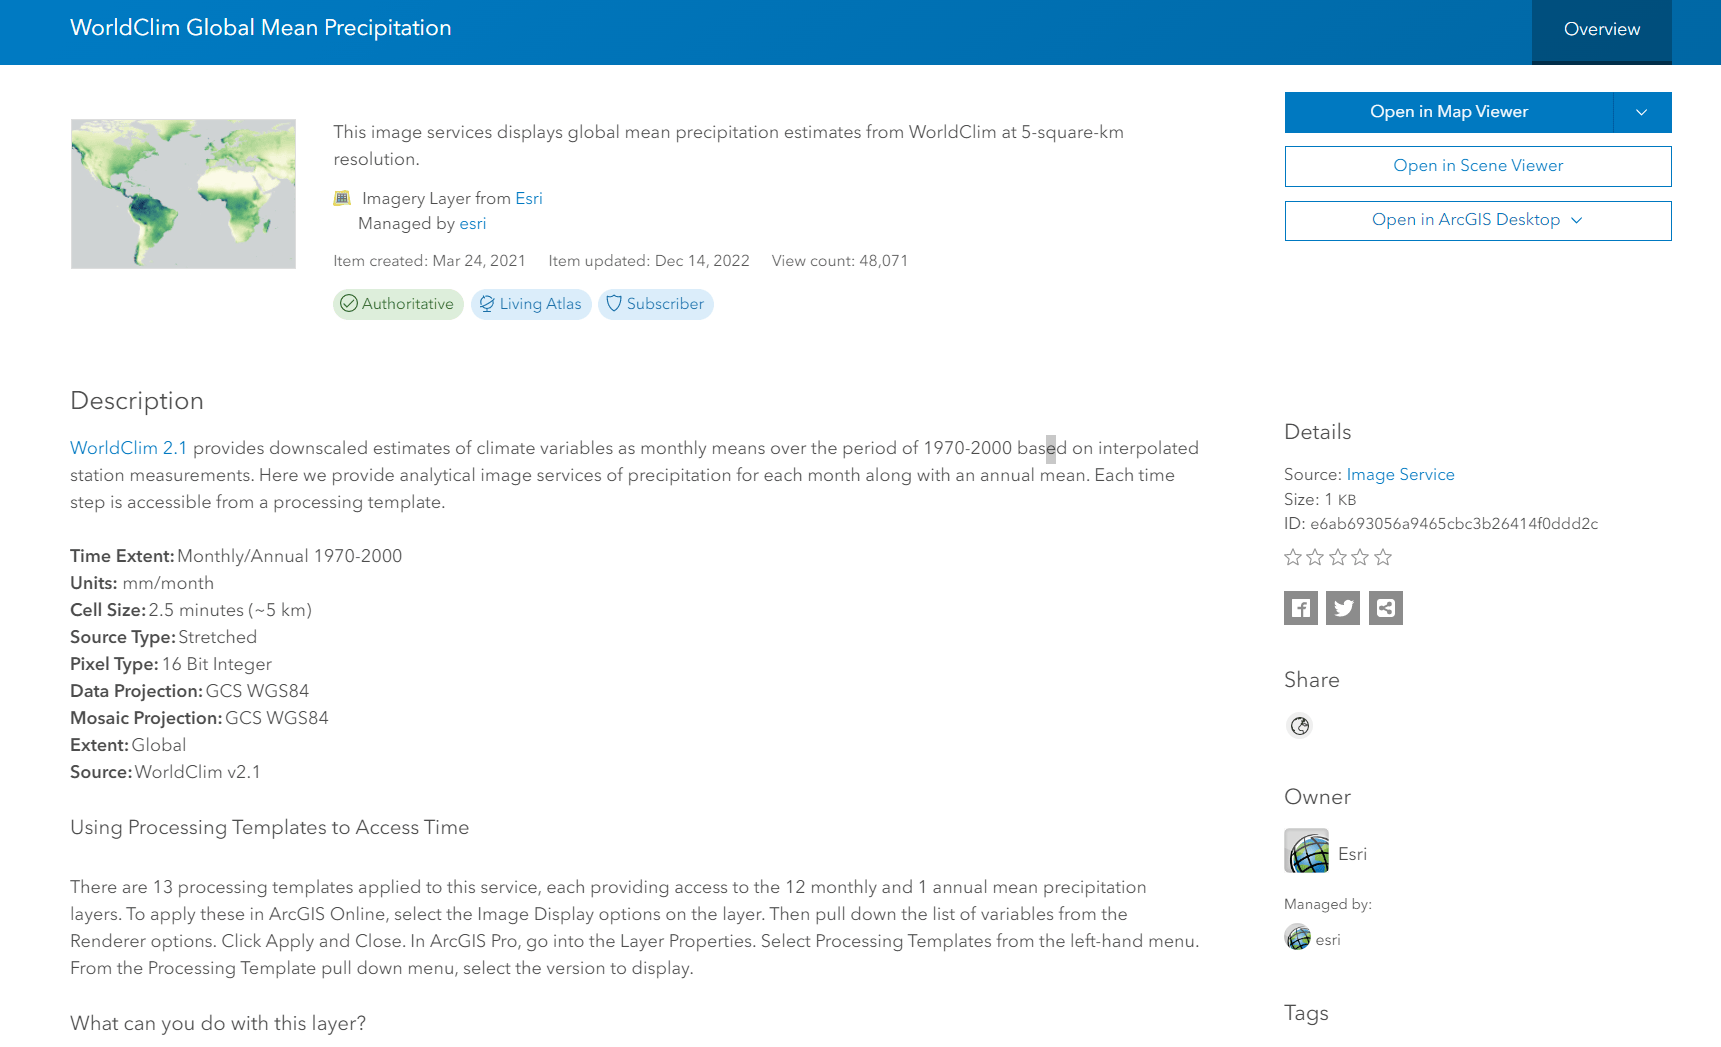
Here’s a great example: WorldClim Global Mean Precipitation layer in Living Atlas.
The Item
From the linked item page above, we can see a detailed description of everything you’d need to know to use the layer effectively.
Open the layer in Map Viewer or ArcGIS Pro and you’ll see custom cartography that clearly defines gradients of precipitation.

The pop-up is customized to query the multidimensional information and provide a month by month graph of precipitation totals.

And when this item is added to a map and saved, you can easily get back to that detailed Item Description.

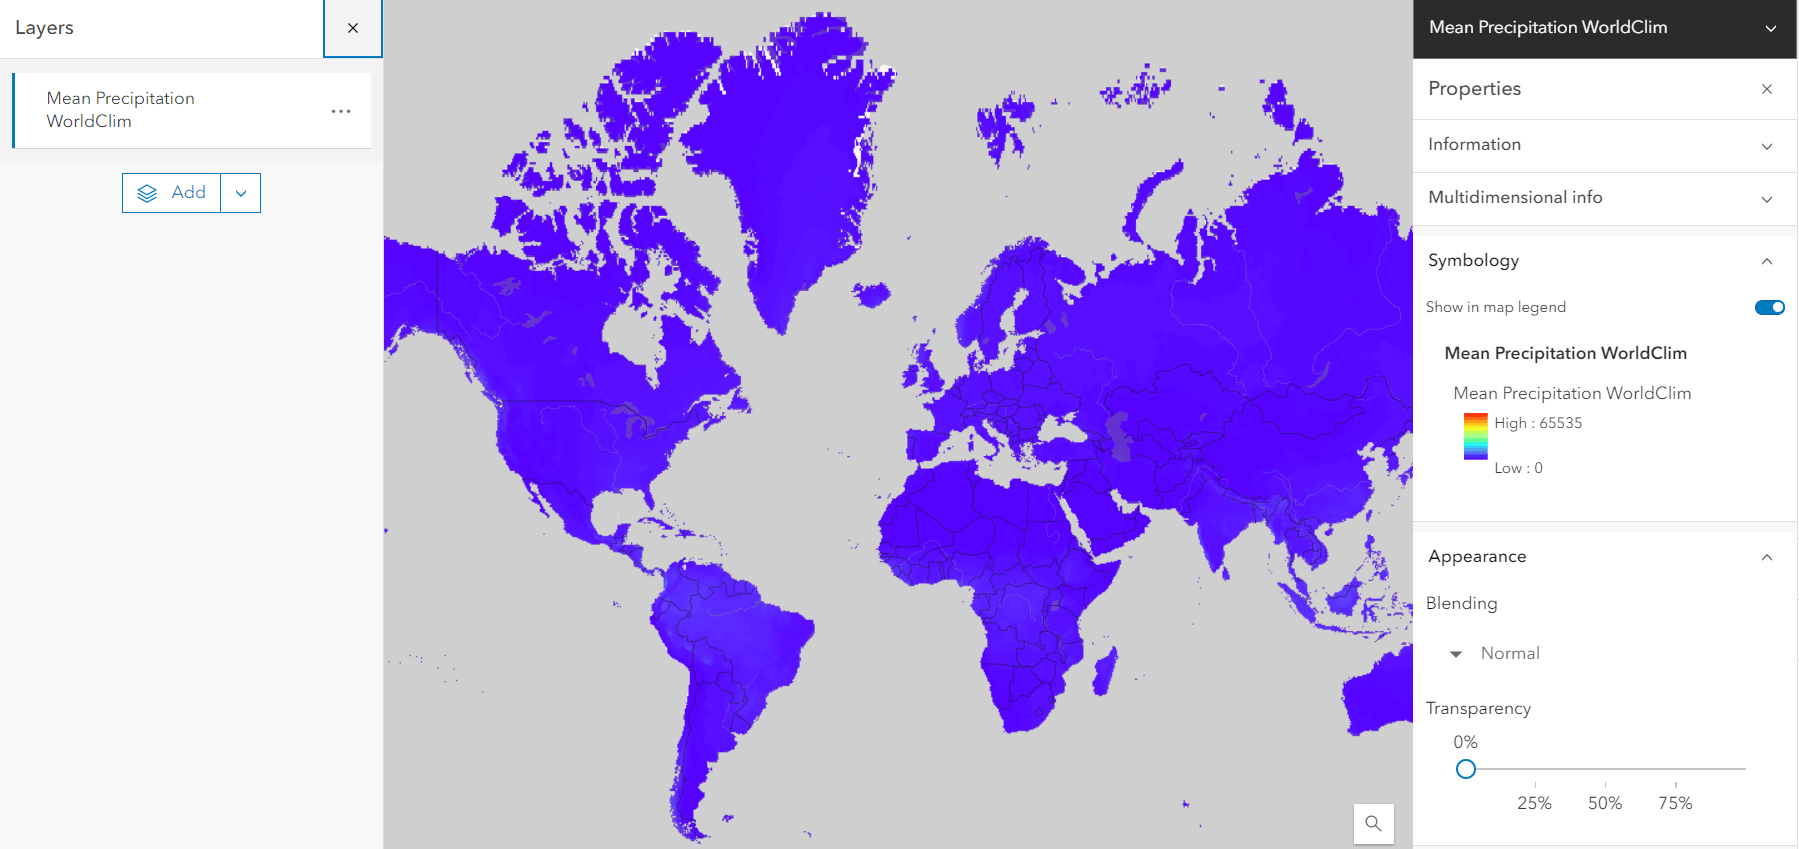
The Service
There’s not much useful human readable metadata in the Service URL. Sure, that can be added while publishing, but it’s not a user-friendly display. Not to mention, it’s much easier to edit the Item Description over time.

Open the Service in Map Viewer and we see it gets the default rainbow color ramp, which we all know is the worst! But the range of data and its distribution means the map comes out as a blue blob.
Click the map and the pop-up displays the default raster value – not nearly as informative as the Item version.
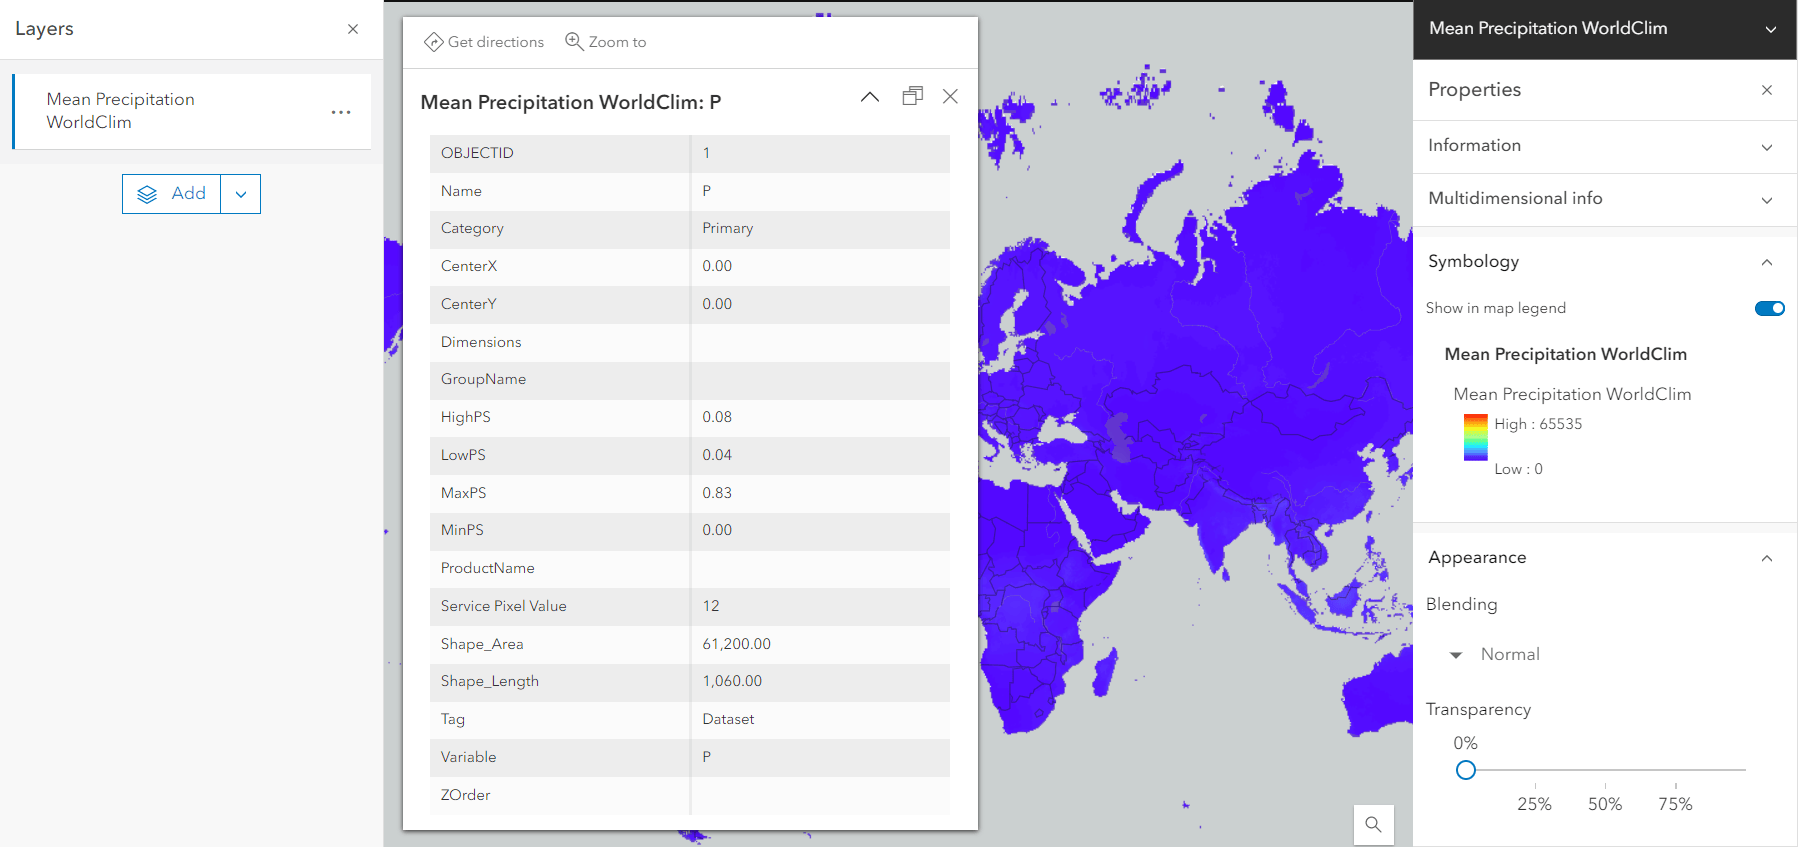
Lastly, you can’t see the connection between this layer and the detailed Item Description – you’re sent back to the REST endpoint rather than the Item Description. While you may have understood the details of the layer, someone who uses your map may not, so you’re putting them at a disadvantage, as well.
A Better Way
“So how should I be adding the layers?”, you might ask. Instead of the REST URL, look to the Item ID. Every Item has an alpha-numeric string in its URL. For the Sentinel-2 10m Land Use/Land Cover Time Series layer in Living Atlas, we see the URL is https://www.arcgis.com/home/item.html?id=cfcb7609de5f478eb7666240902d4d3d.
Copy the “cfcb7609de5f478eb7666240902d4d3d” and add it to any project.


In some cases, there isn’t an Item for a service, and that’s a whole other pattern that we need people to embrace! Luckily, creating one is pretty simple.
Configuring an Item
If you published from ArcGIS Pro into an ArcGIS Organization Portal, or if you uploaded a file directly to ArcGIS Online, good luck…you have an Item. It just needs to be configured. Once you adjust the cartography, pop-up, and aliases in ArcGIS Online Map Viewer, you can select Save in the layer options. Any customization is saved to the Item (but not the Service). We’ll follow-up with a blog and video on some of the most useful enhancements for Items that benefit users, along with making them candidates for Living Atlas.
Another important reason for using Items as a publisher is that it can help support alerting users to changes or potentially planned retirements. Read more about some of those best practices.

Thank you so much! I did not know there were other ways besides Rest Services. This is very helpful!
It would be much nicer to have a meaningful identifier than the meaningless item id. As I can clearly see the benefits of the item over the service, the service has a comprehensible URL, while the item just has a bunch of characters and numbers.
There’s 10s of millions of items in ArcGIS Online, so it’s the most practical solution. Otherwise creating an Item would be like trying to get a new Gmail account: “Nope, that’s already taken…try again”
Hi Dan. It’s so interesting! A little question: the popups are configurable for both FeatureServices and MapServices?
Thank you so much
That is correct – anything that supports a configuration in the map viewer can be edited and saved to the item.
Hi Dan. This approach makes sense though we have run into issues in the past with AGO web app templates and WAB apps that would keep a reference to the REST Service URL once configured and deployed. Upon changed a service URL in the item, the respective web app would not honor the new service URL, but stick with the original service URL which no longer was valid. This necessitated us editing JSON for the app to update it to the new service URL. Not fun. Are today’s web apps (Instant Apps, WAB, Exp Blder) going to honorthis approach? thanks. -Brian
Hi Brian – I’m not sure. This might be an artifact of the older (JS3.x) apps like WAB. I haven’t experienced it in the newer JS4.x templates and ExB. Might be something to post in Esri Community.