Climate change is expected to intensify throughout the 21st century, affecting the global population in many ways, from sea level rise to extreme weather events such as heat waves. Exposure to extreme heat and its impact on human health is becoming a more frequent concern for many communities and industries. We need reliable data to make robust recommendations and policies around heat stress. But temperature alone doesn’t always give us the full picture.
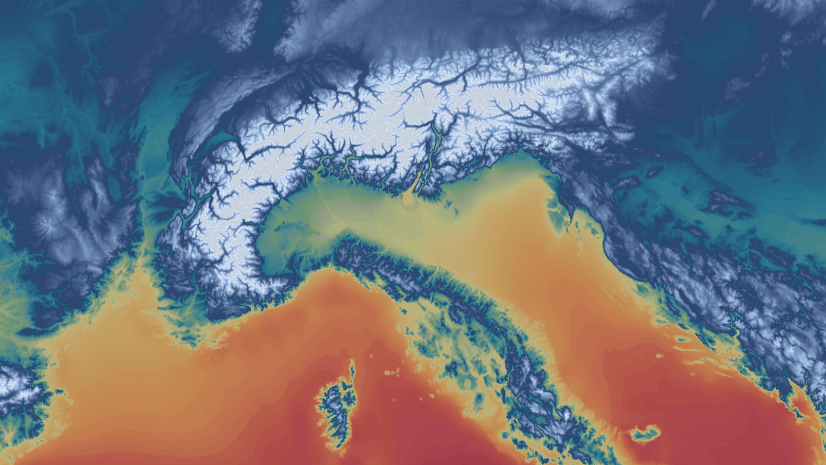
Three month intervals of Wet Bulb Globe Temperature Max for March, June, September, and December.
To help make more comprehensive heat stress data more readily available, a new Global Wet Bulb Globe Temperature Baseline layer has been added to ArcGIS Living Atlas providing information about wet bulb globe temperature (WBGT), which gives us a better understanding of the human impact of high temperatures.
The heat stress that someone experiences is not just dependent on the air temperature, but also on humidity, wind, sun angle, and cloud cover. For example, imagine how much hotter you would feel in 25 °C (77 °F) in the full sun without wind in a humid tropical forest versus 25 °C on a cloudy, windy day in the dry desert. The wet bulb globe temperature is a sophisticated heat stress index that takes all of these factors into account. The National Weather Service provides suggested actions and impact prevention methods for different levels of WBGT. These are noted in the table below and are represented by the redder/darker colors in the Map Viewer.
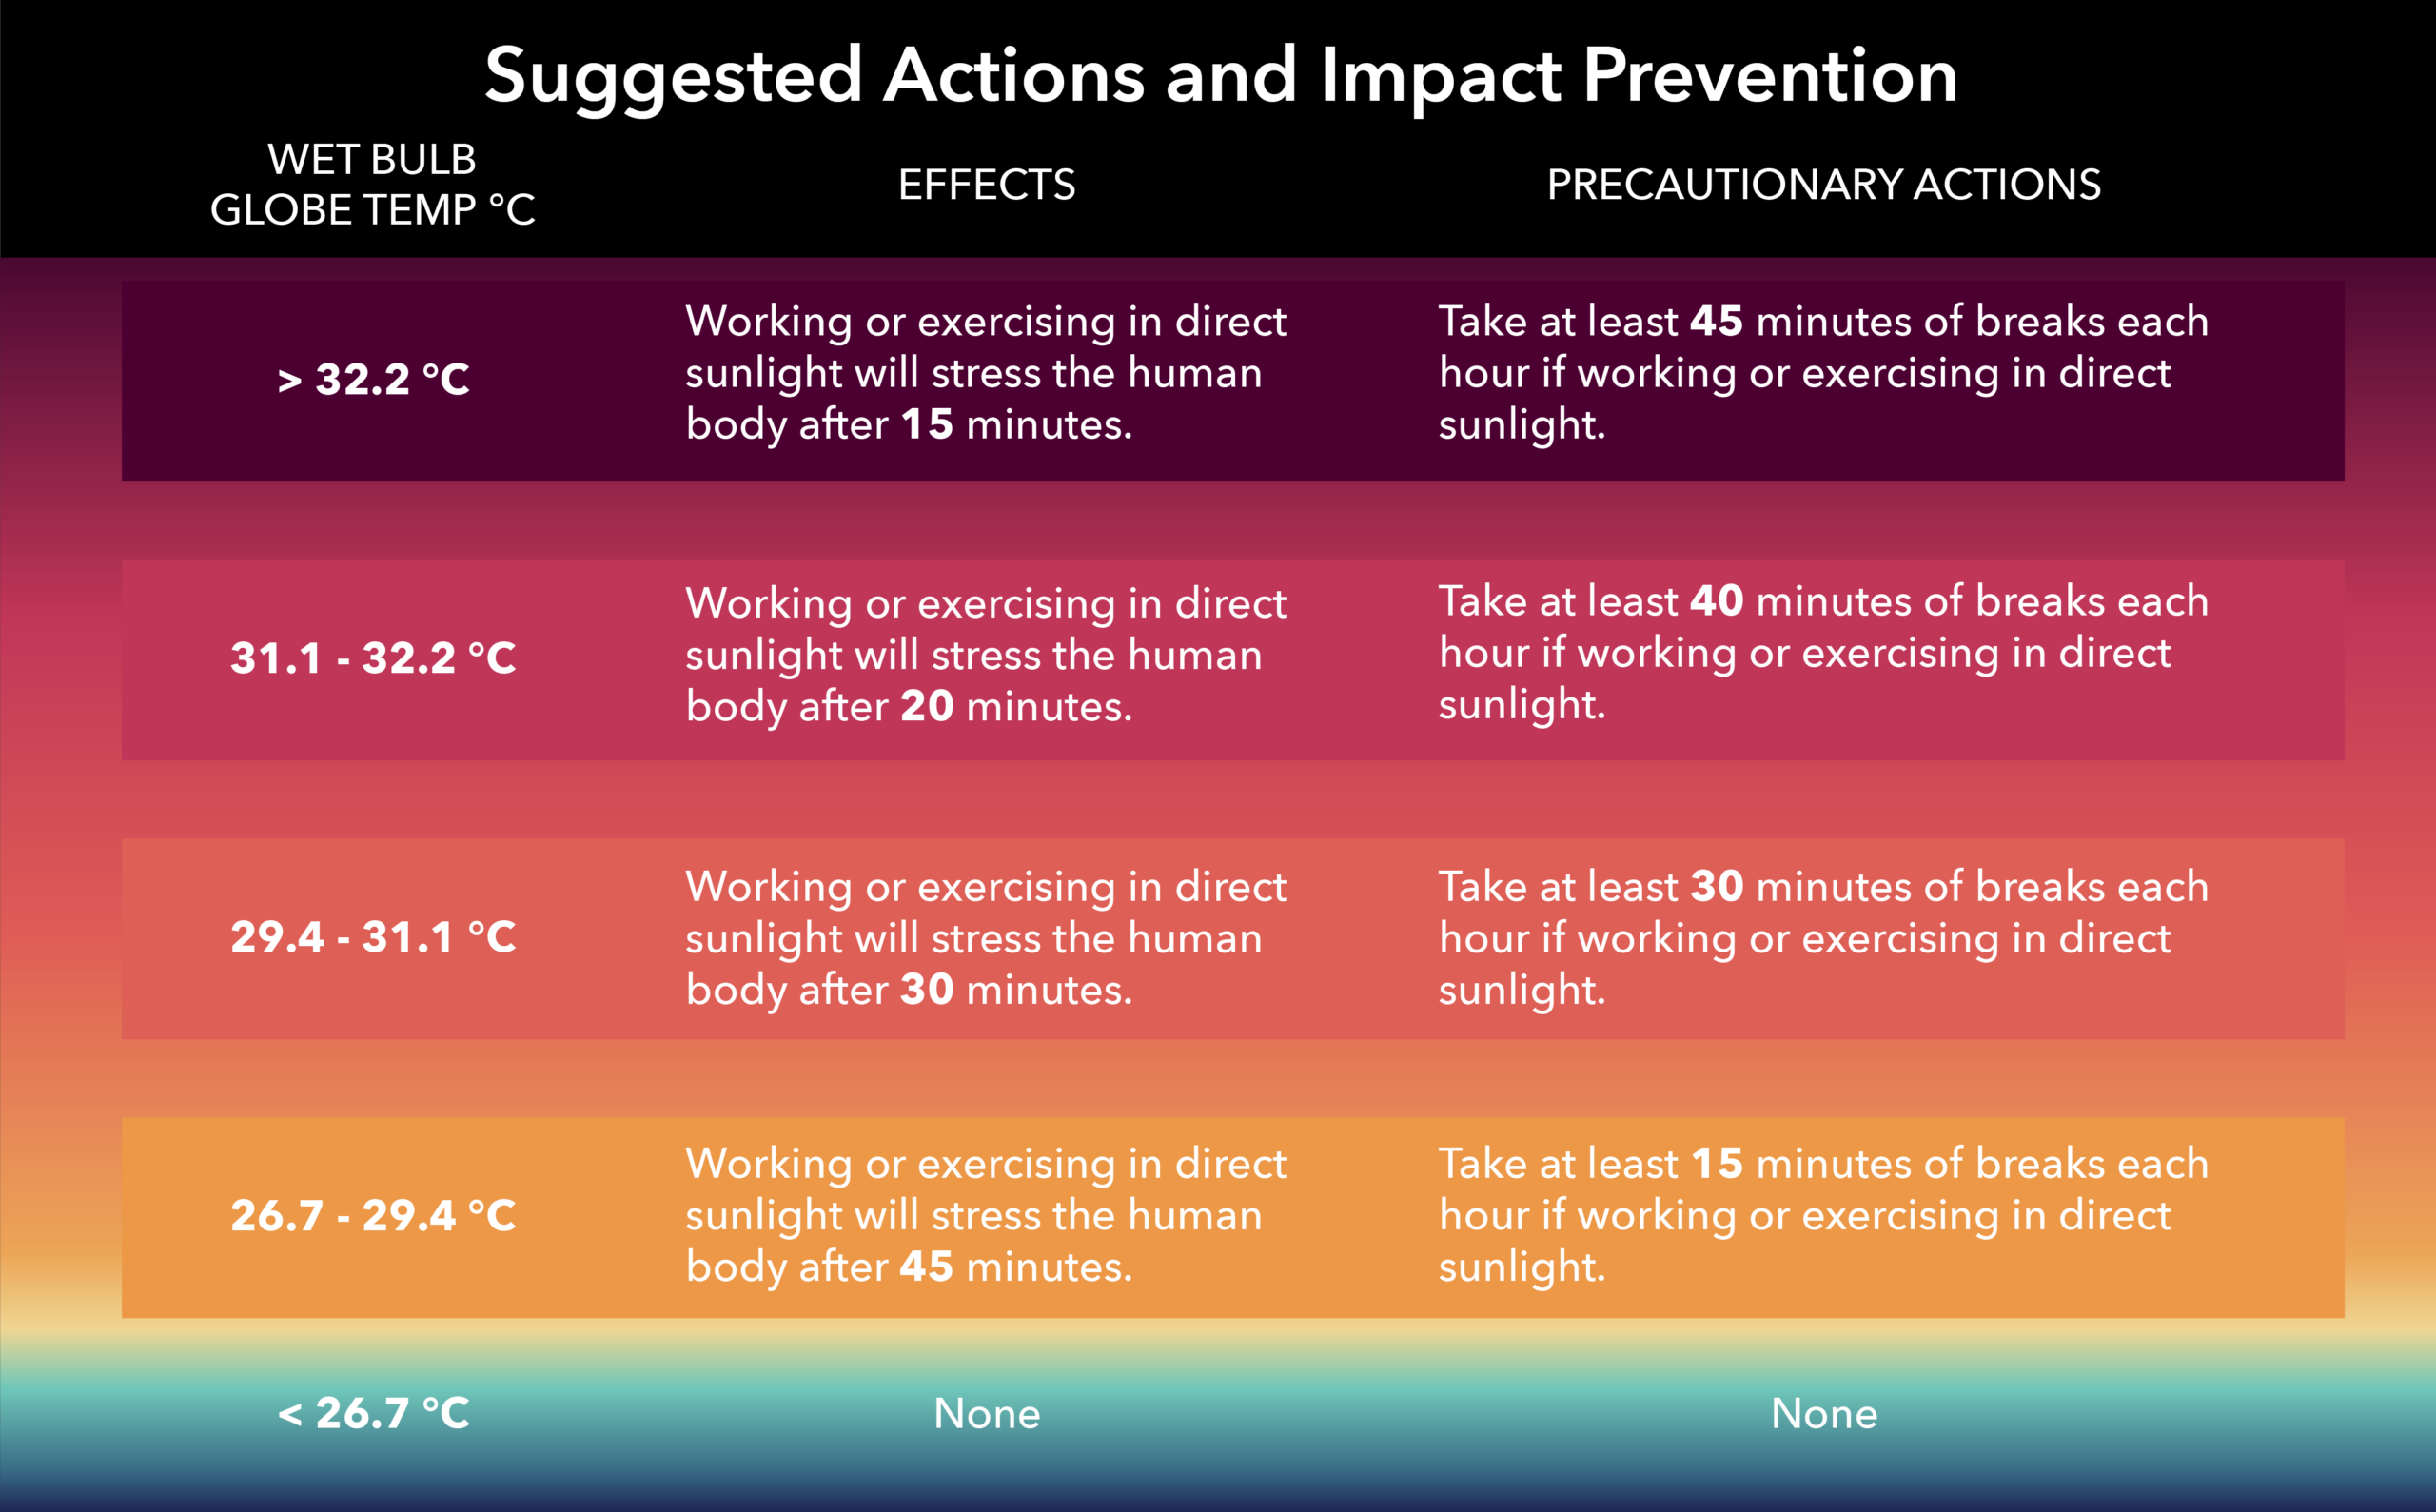
The Wet Bulb Globe Temperature measures heat stress in direct sunlight by combining temperature, humidity, wind speed, sun angle, and cloud cover (solar radiation) into a single value. The colors in the chart correspond to the colors on the map to help identify higher risk areas.
How to use the layer
The new Living Atlas layer provides the monthly minimum, maximum, and mean wet bulb globe temperature over the period 1994-2023. The data is derived from ERA5 reanalysis data from the European Centre for Medium-Range Weather Forecasts (ECMWF) and is processed by researchers at Purdue University and Esri. Refer to this Nature Scientific Data paper for more info on how the data is processed.
WBGT maximum
The highest WBGT recorded for each month. This variable is important for extreme weather preparedness and resilience. It helps identify the most dangerous heat conditions that could occur, even if only for a short period. Use this for outdoor work safety planning, scheduling sports games and practices, and emergency response planning for heat waves.
WBGT mean
Mean WBGT for each month, calculated over the whole day, including nighttime. This variable provides a baseline measure of overall heat stress and is useful for understanding sustained exposure risks. Use this for long-term climate and health studies and to evaluate seasonal trends in heat stress. Use this in combination with WBGT maximum to assess both acute and chronic heat exposure risks.
WBGT minimum
The lowest WBGT recorded for each month. This variable is valuable for identifying the coolest conditions and potential recovery periods from heat stress. Even during hot months, cooler nights or mornings can reduce cumulative stress on the body. Use this to determine safe windows for outdoor activity and assess nighttime cooling trends, important for vulnerable populations without access to air conditioning.
Globe showing monthly Wet Bulb Globe Temperature max.
Accessing the Multidimensional Information
The minimum/maximum/mean WBGT and months are built into the layer using a multidimensional raster. In ArcGIS Online, use the Multidimensional tab to select the variable and month of your choice. Similarly, in ArcGIS Pro, the multidimensional data is usually accessible through the Multidimensional Filter tab where you can select the variable and month. Unfortunately, a bug in ArcGIS Pro 3.6 prevents you from using the Multidimensional Filter at the moment. This issue is resolved and a fix is added in ArcGIS Pro 3.7, set to be released in May 2026. Until then, please use ArcGIS Online for your multidimensional workflows on this layer.
How is this different from the Wet Bulb Globe Temperature Projections?
The Global Wet Bulb Globe Temperature Projections layer is designed to provide projected scenarios to visualize how future heat stress may vary by location, time of year, and climate scenario. The baseline layer shows us a summary of patterns of the past calculated with data from 1994 to 2023. Together, the newly released layer and the projections allow us to study the past and the future to gain a full picture of heat stress and how it is changing over time.



Article Discussion: