2D maps are where many GIS workflows begin. They help teams understand places, manage assets, reveal patterns, and work with the data they use every day.
3D adds context that helps teams turn understanding into action. Planning and engineering teams see how a proposed building fits into its surroundings, utility teams understand the relationship between underground networks and surface activity, and emergency responders evaluate how terrain, access, and visibility shape real-world response.
Scene Viewer makes it easy to explore and analyze scenarios like these in 3D, helping teams add context to their geospatial data and make more informed decisions. Whether you’re working with web maps, operational layers, imagery, building models, or reality capture, you can explore familiar GIS information in an interactive 3D environment, directly in the browser.
This post highlights how to bring your 2D data into 3D and create web scenes that add context, support decisions, and make your work easier to share.
Set the scene
Every web scene starts with a foundation: Choose the scene type that fits your project, add the data you want to visualize, and use basemaps and terrain to provide geographic context. From there, you’re ready to begin styling and refining your scene.
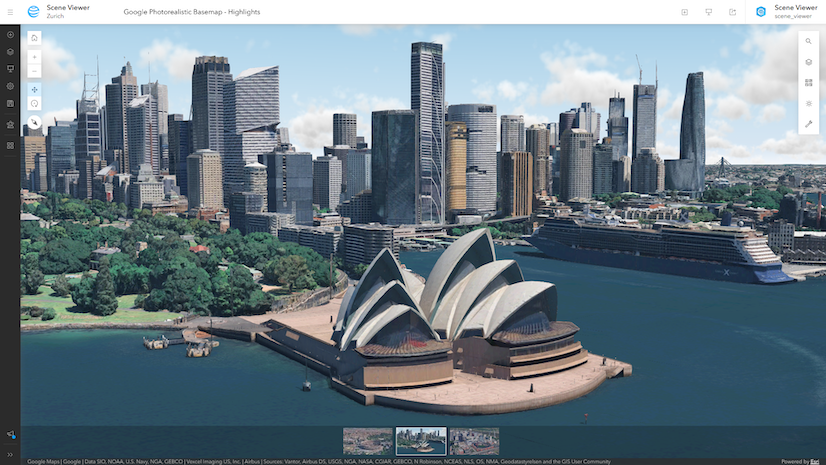
Get started with 3D right away by adding realistic cityscapes with Google’s Photorealistic 3D Basemap (preview), no specialized 3D data required.
To access Scene Viewer, sign in with an ArcGIS Online or ArcGIS Enterprise account (you’ll need a Creator user type or higher to create and save scenes). From there:
- Choose a global or local scene – Use local scenes for city- and site-scale projects, and global scenes for data displayed on a 3D globe.
- Apply basemaps and terrain – Access a variety of basemaps, including 3D basemaps, dark mode, and OpenStreetMap, and easily switch between them.
- Add 2D and 3D layers – Bring together data you already use, from traditional point, line, and polygon layers to advanced 3D content such as point clouds, voxel layers, and Gaussian splats.
Don’t have 3D data yet? Instantly add realistic 3D context with the Google Photorealistic 3D basemap (preview) to your scenes with streaming access to more than 2,500 cities across 49 countries.
Stylize data in 3D
Good 2D maps already communicate a lot through color, size, and symbology. Scene Viewer builds on these cartographic tools with 3D styling that adds depth and emphasis. Whether using animation, glow, or realistic symbols, these styling options make trends, hotspots, and relationships easier to see in complex data.
Symbolize snowplow routes and simulate weather conditions in a realistic 3D environment to support informed decisions during winter operations.
To style your 3D web scenes, consider adding:
- 3D content from 2D data — Turn tree inventory points into 3D tree models and extrude building footprints into 3D structures, all without a specialized workflow.
- 2D and 3D points, lines, and polygons — Customize color, size, transparency, rotation, unique symbols (types), and more.
- Glow effects — Illuminate your symbology to highlight areas of interest and improve visibility in dense scenes.
- Flow styling — Visualize movement and direction with animated line symbology.
- Labels and icon visibility — Apply labels and symbols to highlight important information. Use icon visibility settings to keep key features visible, even when they are obscured by other content.
- Focus areas — Highlight important locations and fade the background to keep attention on what matters most.
Simulate real-world conditions
Sunlight shifts throughout the day, weather changes, and natural forces such as wind and water are constantly in motion. Scene Viewer helps you understand how these conditions shape a place by bringing environmental context directly into your web scene.
See how sunlight and shadows change throughout the day and year with the Daylight tool.
If you’re interested in visualizing environmental conditions, try:
- Daylight and shadows — Explore how sunlight and shadows change throughout the day and year.
- Weather effects — Add rain, fog, or snow to support storytelling and visualize how conditions affect visibility and the surrounding environment.
- Flow styling — Visualize dynamic environmental phenomena such as wind, ocean currents, and water movement with animated symbology.
See from any viewpoint
Many spatial questions depend on perspective. By viewing a web scene from different angles, you can evaluate visibility, understand obstructions, and uncover relationships that might otherwise be overlooked.
Click anywhere in your web scene to reveal coordinates, elevation, nearby address information, and oriented imagery with the Location tool.
- Location tool — Explore locations from multiple perspectives by connecting map features with oriented imagery and ground-level elevation.
- Line of sight and Viewshed analysis — Determine what’s visible from a location using multiple targets.
- Slice tool — Cut through buildings or terrain to reveal hidden content.
Uncover insights
Scene Viewer goes beyond visualization with analysis tools that help you answer real-world questions directly in the browser. Whether you’re estimating volumes, understanding accessibility and travel times, or measuring features in 3D, you can analyze your data without leaving the web scene.
Calculate cut, fill, and net volume for faster site assessment with the Measure volume tool (beta).
If you’re interested in analyzing data in 3D, try:
- Measure volume tool (beta) — Estimate how much material is being stored, removed, or displaced.
- Elevation profile — Understand terrain and vertical change.
- Generate travel areas — Determine what places can be reached within a given area and how long it will take to reach them.
Explore more analysis tools — Discover additional browser-based analysis capabilities and see real-world examples in the Perform analysis in Scene Viewer documentation and Introducing Analysis Tools in Scene Viewer blog.
Explore the built environment
3D gives teams a clearer way to understand the built environment, from planning and design to construction, facilities, and public safety. In Scene Viewer, buildings, basemaps, reality capture, and other layers can come together to show current conditions, proposed changes, and the context around them.
For organizations working toward a digital twin, this can be an important step in the journey. Scene Viewer helps teams start with a descriptive view of physical assets and the surrounding environment, then share that context with others as more data, systems, and information are added over time.
Add custom 3D models to Scene Viewer to visualize buildings, projects, and designs in real-world context.
To explore the built environment, you can:
- Add 3D context — Bring entire cityscapes into your web scene using the Google Photorealistic 3D basemap (preview) or your own reality mesh.
- Upload and place 3D models — Visualize proposed buildings and designs alongside existing development.
- Explore building layers — Examine detailed building components, including walls, structural systems, lighting, and mechanical equipment.
Visualize change over time
Some insights only become visible when you look beyond a single moment. With time-enabled data, you can explore change, identify trends, and better understand how events unfold across space and time. These temporal insights also support operational workflows, helping organizations monitor evolving conditions as they change over time.
Visualize construction progress and other time-enabled data with interactive time sliders.
To work with time, try:
- Time-enabled layers — Configure layers to visualize evolving datasets.
- Time slider — Animate and explore how data changes over time on time-configured layers.
- Saved time states — Guide others through key moments in a story.
Share what you’ve built
The value of a web scene doesn’t stop when you finish creating it. Easily publish interactive 3D web scenes that colleagues, stakeholders, and the public can explore in a browser or on a mobile device.
Use Presentation Mode to highlight key locations, guide viewers through a web scene, and share projects with others.
If you’re interested in sharing your work:
- Share via link — Make scenes instantly accessible in a web browser.
- Present with slides — Guide viewers through key locations, viewpoints, and insights.
- Embed in apps and websites — Bring interactive 3D content into the workflows your stakeholders already use.
Shape what’s next
Scene Viewer continues to evolve to support greater visualization, exploration, analysis, and operational digital twin workflows. Whether you’re just getting started or pushing the limits of your current web scenes, your feedback helps guide what comes next.
Keep exploring
Scene Viewer brings 3D GIS into the browser, making it easier to visualize, explore, analyze, and share the places and systems that matter to your work. As 3D becomes part of more workflows, from planning and design to operations and digital twins, Scene Viewer gives teams a familiar place to bring data together, add context, and move decisions forward.
Try it today: Open the Scene Viewer Welcome screen to explore featured scenes right away, even without signing in.
Additional resources:
- A year of Scene Viewer highlights — Explore the annual Scene Viewer StoryMap, a tradition that brings together the best of each year’s releases.
- Documentation — Find step-by-step guidance, from getting started with your first web scene, to performance and optimization.
- What’s New — Check out the release notes and blogs for the latest updates.
- Esri Community — Connect with other users and the product team to ask questions.
- …and don’t forget to take the Scene Viewer annual product survey — Help shape what’s next by telling us where 3D fits into your work today and where you need it to go next.
Thanks to the Scene Viewer team—especially Janett Olivar and Jasmine Du—for their support in developing this post, and to Fabio Fornallaz, Dario Martini, and everyone else who contributed to the web scenes featured throughout this article.


Commenting is not enabled for this article.