Scene Viewer makes 3D accessible on the web, helping organizations bring together GIS, 3D content, reality capture, and imagery in an interactive 3D experience. As 3D becomes a more natural extension of GIS workflows, Scene Viewer continues to make it easier to move from visualizing information to exploring, understanding, and communicating it, supporting better decisions across planning, asset management, environmental monitoring, and public engagement.
This release expands what’s possible in Scene Viewer with new ways to explore oriented imagery, model visibility with greater precision, analyze reality-capture content, compare elevation surfaces, and focus attention on areas of interest. Together, these enhancements help you better understand complex environments and share those insights with others.
See conditions from every angle
When investigating a site, context matters. Sometimes a bird’s-eye view tells only part of the story. Scene Viewer makes it easier to move between 3D scenes and ground-level imagery with oriented imagery.
Introduced in the previous release, the Location tool brings oriented imagery into Scene Viewer. Now with a dedicated view for exploring imagery, you can use the Location tool to navigate between viewpoints, take measurements, and inspect buildings, infrastructure, and site conditions from ground level.
Model visibility with greater precision
Whether positioning a camera for optimal habitat visibility or evaluating drone flight heights, even small changes in observer location and height can significantly affect your results.
Scene Viewer now supports precise observer and target positioning for line-of-sight and viewshed analysis using exact X, Y, and height values. Points can be snapped directly to scene features, such as building edges and walls, or defined using exact coordinates, providing the precision needed for more accurate visibility analysis.
Combine multiple elevation profiles for analysis
Understanding how terrain changes over time is critical for organizations monitoring slopes, erosion, construction activity, and other dynamic environments. The enhanced Elevation Profile tool now allows you to compare multiple elevation layers within a single profile view.
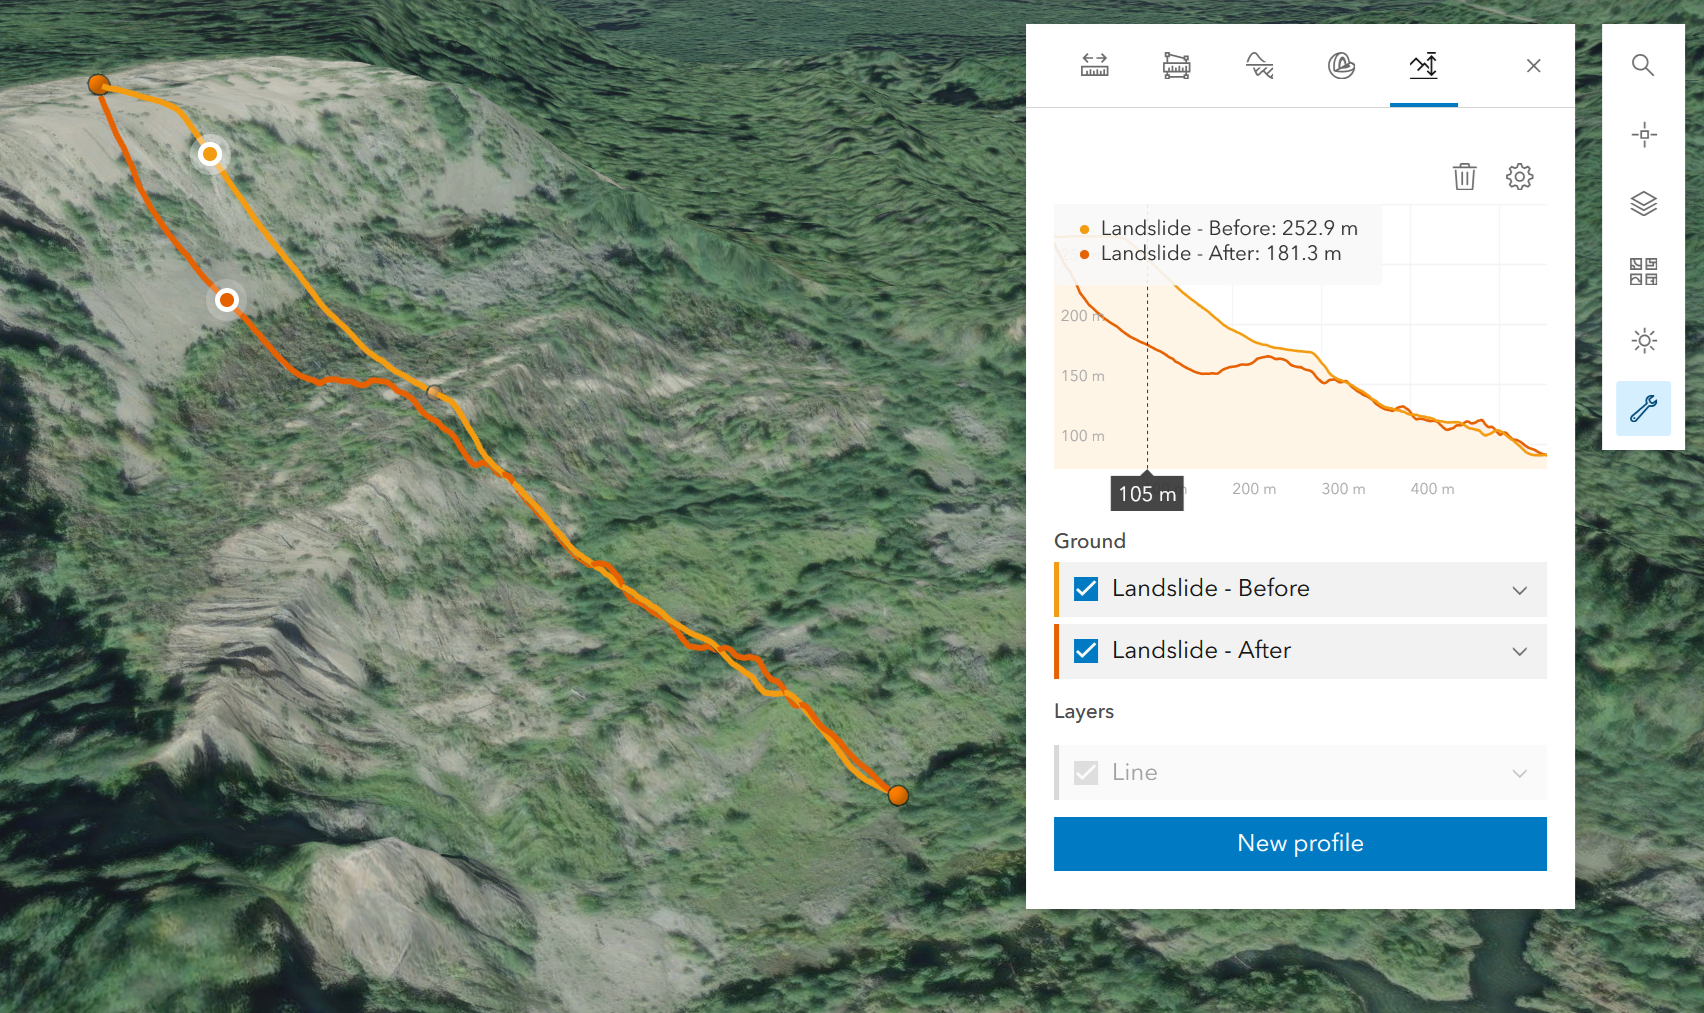
Using the Show all layers setting, you can compare multiple elevation layers — including those from different sources — in a single profile. Because it runs in the browser, this workflow goes from the field to stakeholders in minutes, ideal for mining, engineering, construction, and any industry tracking terrain change.
Expanding analysis for Gaussian splats
Earlier this year, Scene Viewer introduced support for Gaussian splats, bringing one of the latest innovations in reality-capture content to the web. This release adds viewshed analysis to the growing toolkit available for Gaussian splats, expanding the ways reality-capture data can be explored and analyzed in the browser.
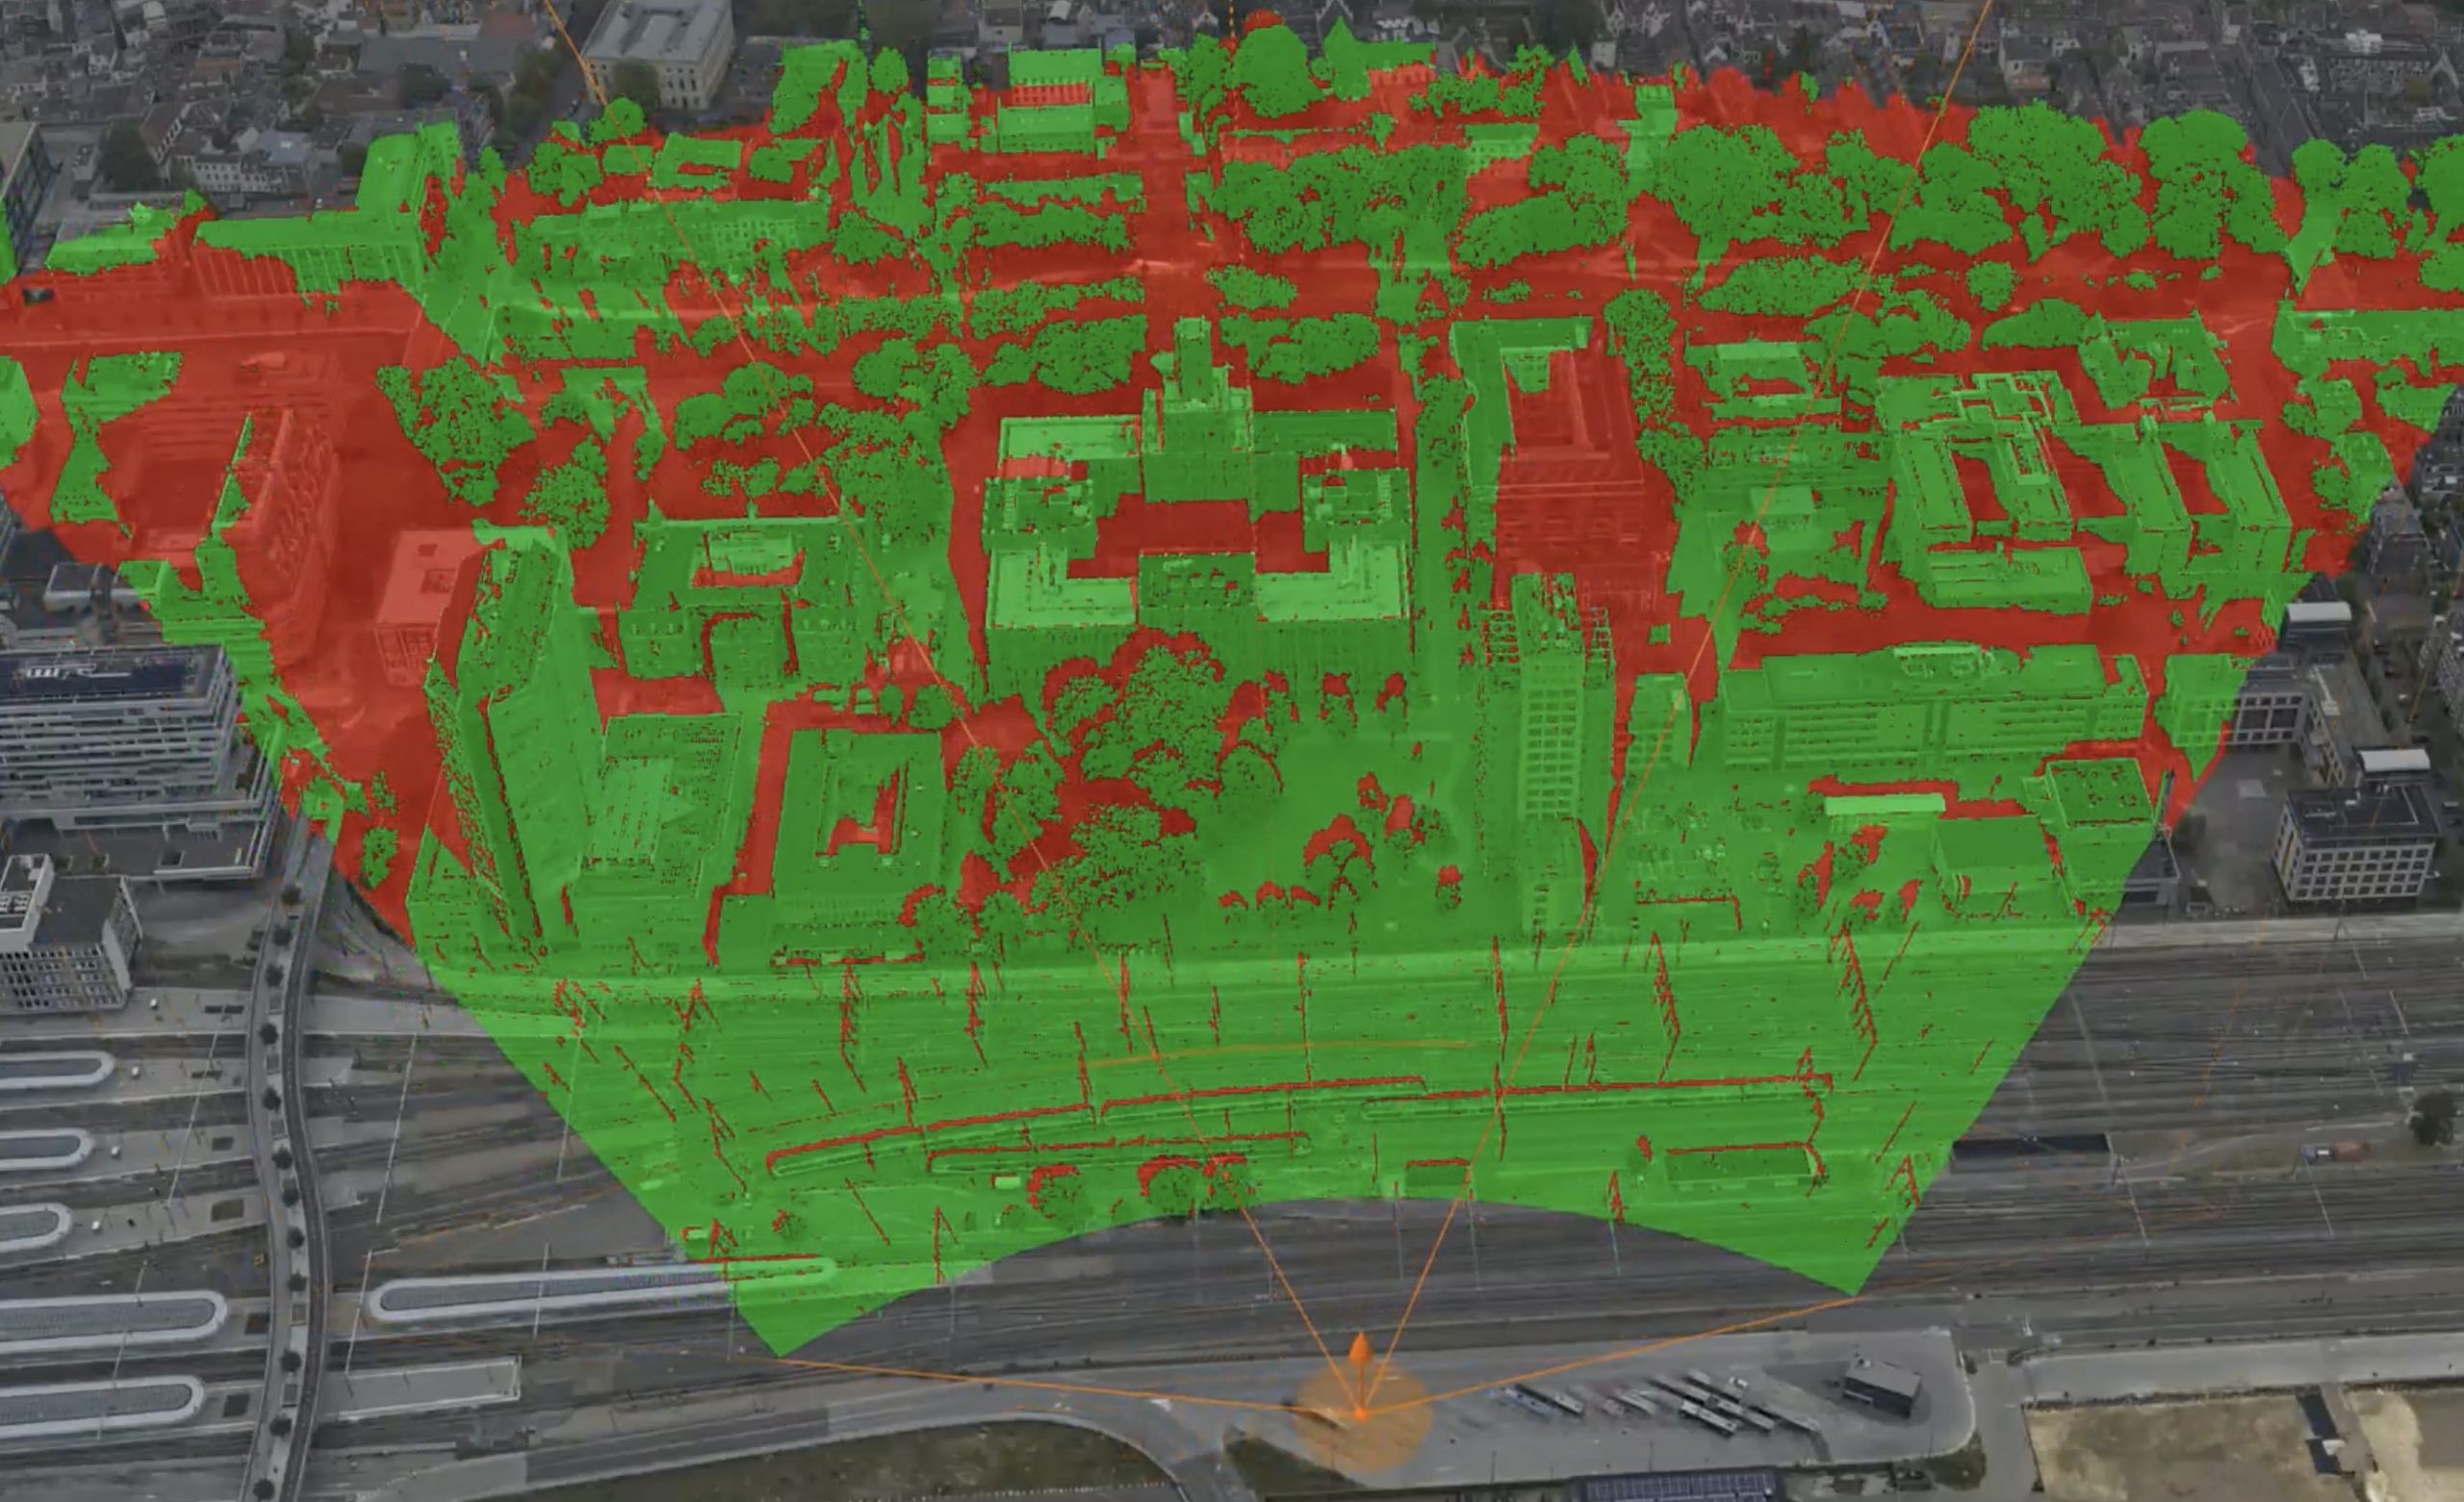
Use viewshed analysis to understand visibility across an entire area, helping organizations evaluate sightlines, assess infrastructure impacts, and identify locations that may be visible or obscured from key viewpoints.
Overlays on the Google Photorealistic 3D Basemap
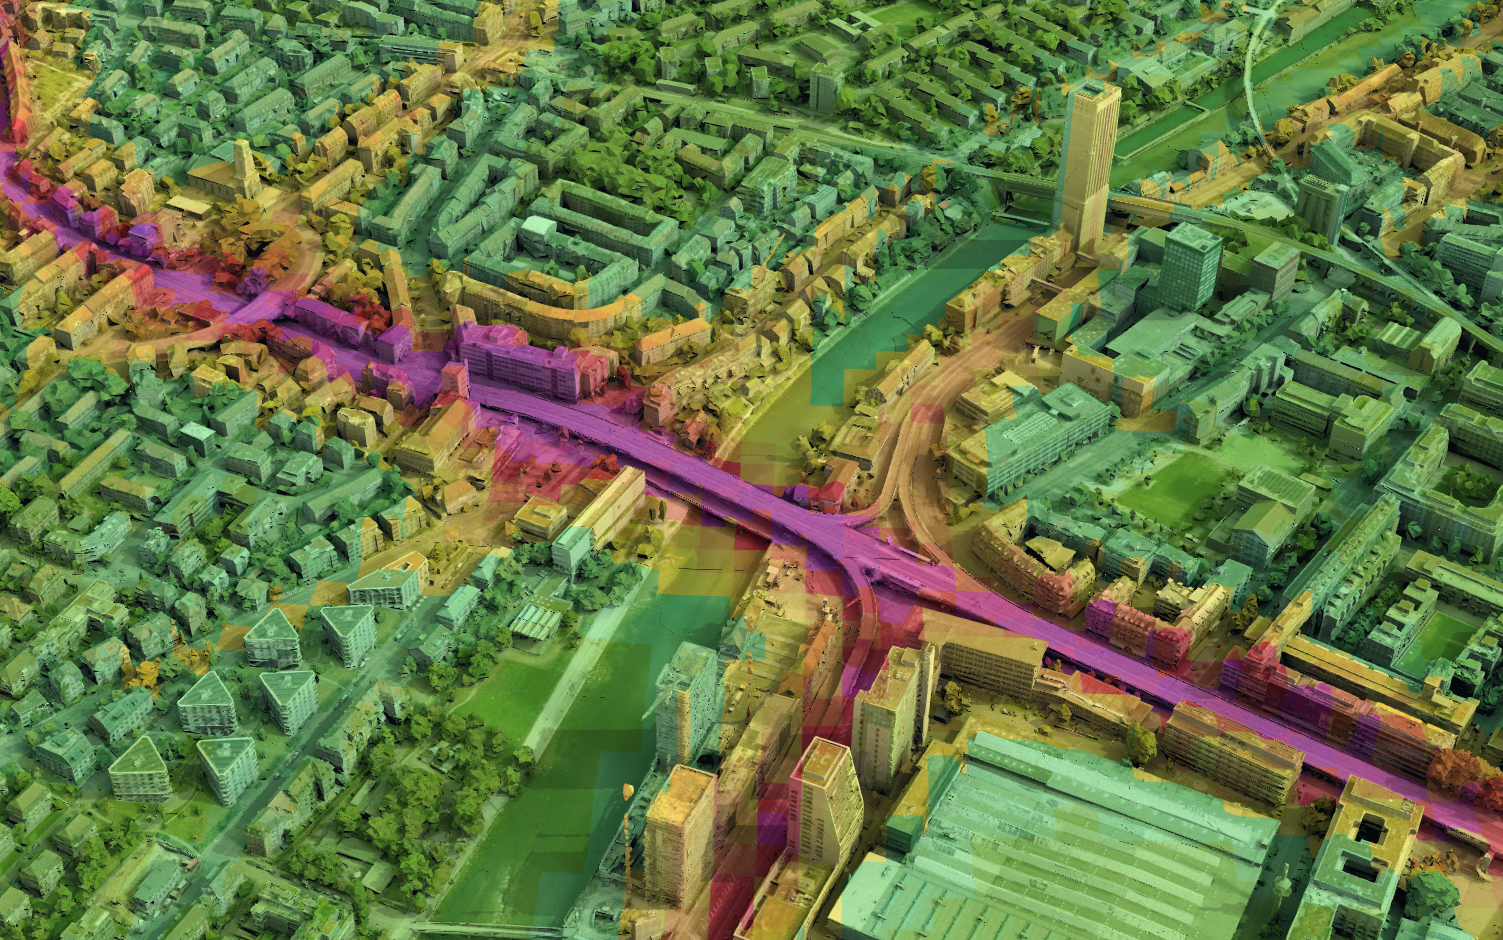
The Google Photorealistic 3D basemap (preview) provides a lifelike representation of the real world, with 3D imagery of buildings, landmarks, terrain, and natural surroundings. Now you can drape your own raster layers directly onto it, enabling environmental, analytical, and operational overlays within a realistic 3D context.
Highlight focus areas
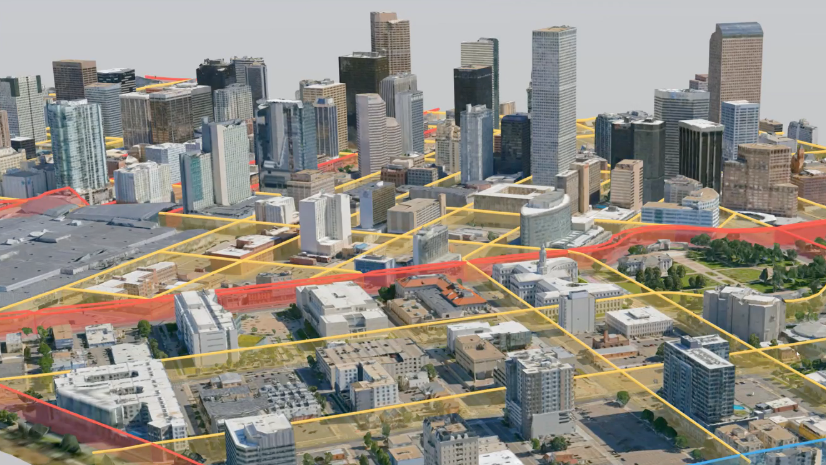
Create focus areas directly from existing polygon features in your scene, such as parcels, development areas, or administrative boundaries. Focus areas highlight locations, making it easy to feature visualizations like before-and-after comparisons. They can be reused, reducing setup time and maintaining consistency when authoring scenes.
Add group layers to a scene
In Scene Viewer you could already create group layers to organize your layers. In this release, you can now add existing group layer items in ArcGIS Online to your scene directly through Scene Viewer, or from the item page.
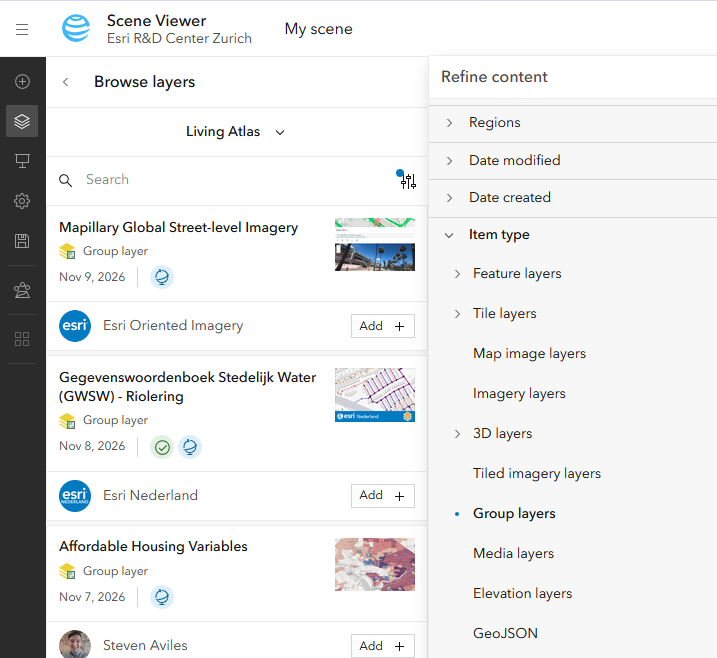
Did you know you can also nest group layers? Simply create a group layer and drag it into another group.
How to get started
For a full walkthrough of everything in this release, check out the Scene Viewer release notes and the “What’s New in ArcGIS Online (November 2026)” release blog. Have questions or feedback? Reach out via the Esri Community forum.



Commenting is not enabled for this article.