ArcGIS Online has just been updated with the following new features and enhancements. This release includes improvements and new capabilities for user experience, mapping and visualization, apps, and much more. For additional details see the What’s new help topic or view all posts related to this release.
User Experience
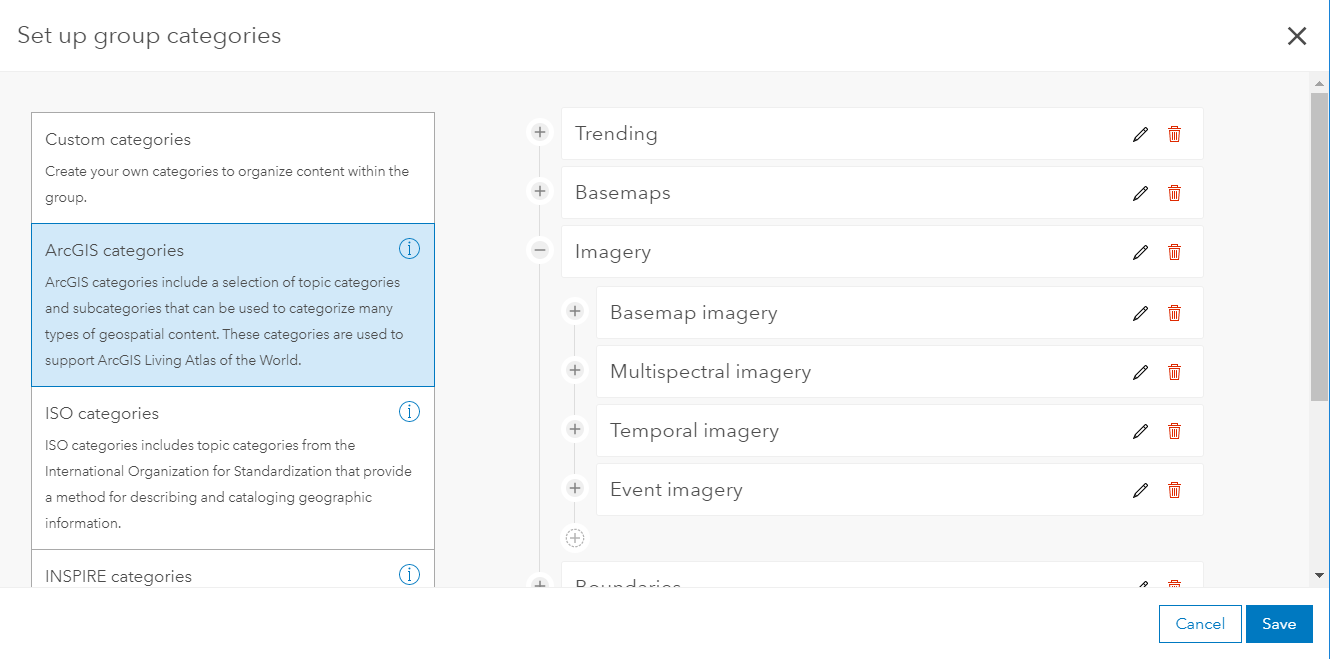
Content categories are a new way to organize content across your organization. You can establish hierarchical categories for your organization or group content by choosing from standard category templates, such as ArcGIS, ISO, or INSPIRE, or by creating custom categories that make sense within your organization, or to support easily finding content to support projects and workflows.
In addition, the gallery page has been redesigned with a new layout, and includes options for searching, sorting, filtering, and displaying gallery items in different ways.
Mapping & visualization
The Map Viewer user experience for adding layers to your map has been enhanced. When searching for layers and browsing Living Atlas layers, you can view your search results in a table view or list view. You can also sort and filter the results to help you find what you need.
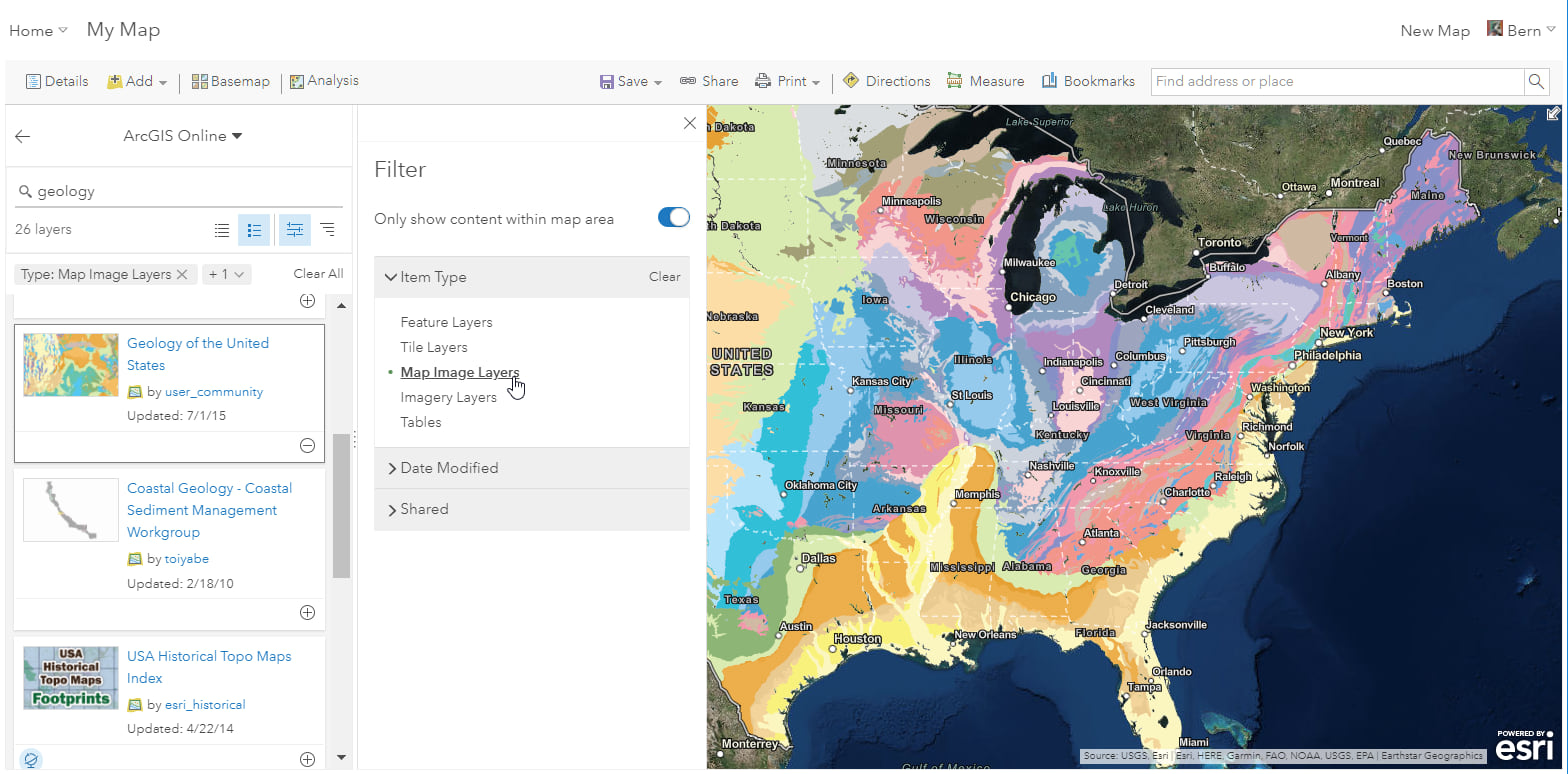
Click the title in the search results to learn more, or to add the item to your favorites. In addition, the option to add layers from a GIS server has moved from Search for Layers to Add Layer from Web.
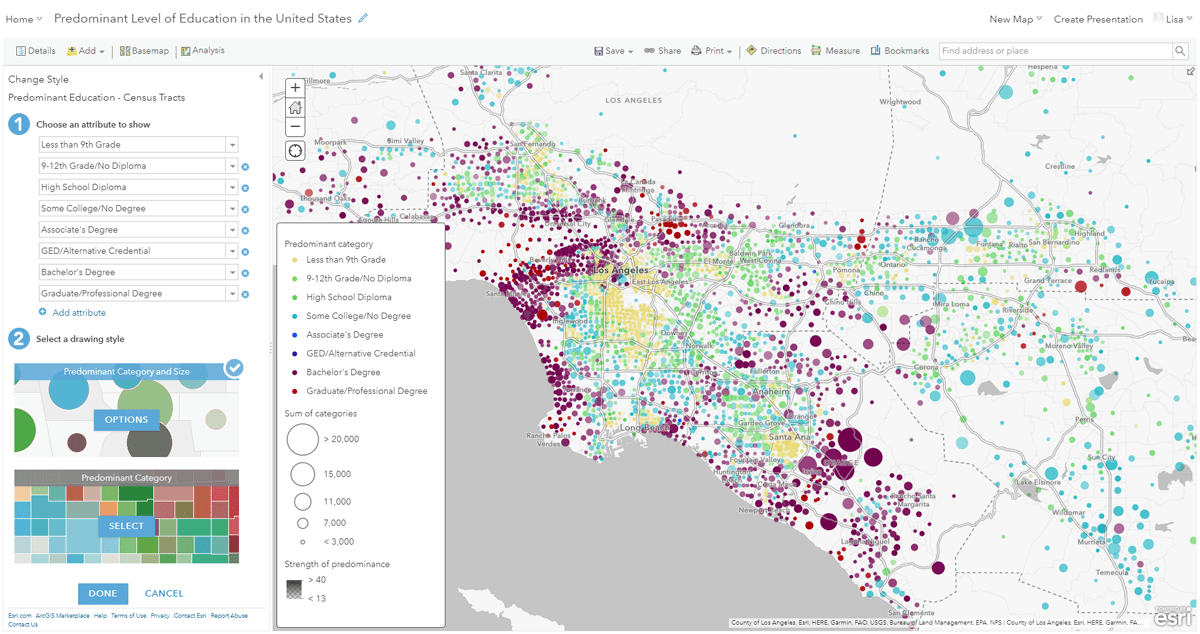
When using the Predominant Category and Predominant Category and Size styles, you can now show up to 10 attributes. This allows you to do more comparisons with related numeric data, such as income groups and education levels.
When styling layers in Map Viewer, you can now choose to show or hide color, size, or transparency ramps in the legend using the Show in legend check box.
The National Park Service symbol set in Map Viewer now includes the full set of the latest NPS symbols. To see the complete symbol set, view a PDF of the National Park Service map symbols.
The number of features that you can visualize when viewing hosted feature layers has increased in many cases. This enhancement improves performance when data is visualized, and allows more data to be displayed on the map in Map Viewer and most configurable apps. For more information, see How can I visualize hosted feature layers with large amounts of data?
3D GIS
Scene Viewer lets you author, view, and share 3D scenes. With this release, Scene Viewer includes the following enhancements and new capabilities.
Scene Viewer is now supported on mobile devices. You can visualize 3D content on newer phone or tablet devices directly in your browser without installing an app. See Mobile requirements for more information.
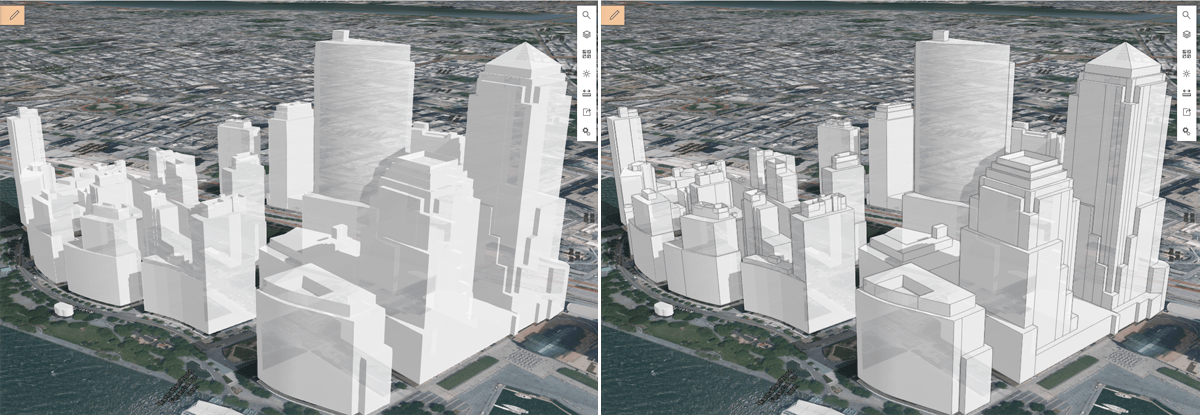
Edge rendering accentuates the outlines of your 3D buildings, including exterior walls, balconies, or roof structures. Enabling the Edges option also increases the contrast and depth perception of your scene.
The new Measure area tool lets you interactively measure areas in 3D scenes. Whether you are working at a city, regional, or global scale, you can calculate areas and perimeters for both horizontal and vertical surfaces, such as building walls and roofs, city parks and lakes, and even larger geographical features, such as watersheds and wildlife reserves.
Scene Viewer improves stability by proactively monitoring and controlling memory use across layers depending on the quality settings. Also, scene layers now use significantly less memory to display more data and continue to load while you navigate a scene.
Spatial Analytics
The Dissolve Boundaries tool now includes the Create multipart features parameter, which is used to allow or disallow features that are broken into noncontiguous parts. The state of Hawaii is an example of a multipart feature. It is a single state composed of several disconnected islands.
The ArcGIS World Geocoding Service has been updated, and now blends authoritative address data for Washington, D.C. that incorporates the D.C. government Master Address Repository (MAR) and points of interest (POIs).
Insights for ArcGIS
The upcoming update to Insights includes the addition of regression analysis, scatter plot matrices, link charts, and link maps. For more information on the current release of Insights, and to check for the new release, see What’s new in Insights.
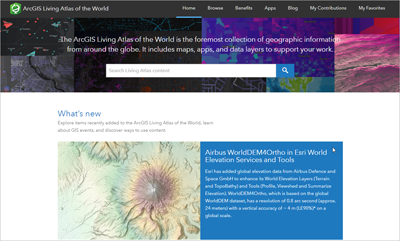
Living Atlas
The ArcGIS Living Atlas of the World is the foremost collection of geographic information from around the globe. It includes maps, apps, and data layers to support your work from Esri and the global GIS user community.
Living Atlas Website and ArcGIS Online integration
The Living Atlas website now uses new content categories (see information at top of this post) to organize maps, scenes, layers, and apps.
In ArcGIS Online, a new Living Atlas tab is available on the content page. Living Atlas items are now marked with a special icon to identify Living Atlas content throughout ArcGIS Online.
Content updates
- The layers based on World Elevation data been updated with Airbus global 24 meter elevation data, with 4 meter vertical accuracy. You can access the updated data in the 2D elevation image layers, 3D elevation layer, and the World Hillshade tile layer.
- The World Imagery basemap continues to receive updates from DigitalGlobe as well as our Community Maps Imagery contributors. The basemap has been updated with additional sets of DigitalGlobe imagery for several countries around the world. In addition, submeter resolution Basemap +Metro imagery has been published for a few hundred additional cities around the world.
- The Esri Vector Basemaps have been updated with the latest HERE data for North America and Europe, along with Community Maps updates for dozens of other communities around the world.
- Demographic maps have been updated for several dozen countries using the latest Michael Bauer Research (MBR) demographic data.
- Detailed local boundaries, based on authoritative data from national government sources, have been published for several countries, including Austria, Canada, and Germany. These boundary layers can be used for visualization and analysis. Boundary layers have been updated for several dozen other countries using the latest MBR boundary data.
For the latest information, see the Living Atlas blog.
Administration
The following changes have been made to organization administration for this release:
- Organizations that enabled credit budgeting can now allow members to see available credits through their profile page.
- Administrators can now view the synchronization status in a distributed collaboration. For example, administrators can verify when the last scheduled synchronization occurred and whether or not the sync was successful.
- Custom roles include a new administrative privilege to configure content categories. To take advantage of the new privilege in existing custom roles, edit the role, add the new privilege, and save the role.
Data collection & management
- When you append data to your hosted feature layers, you can use a Microsoft Excel or GeoJSON file as input.
- Add a unique constraint to attribute fields in individual layers in your hosted feature layer so you can use that field as a unique identifier. The unique constraint prevents editors or append operations from duplicating values in those fields.
- You can reuse defined areas of interest across different hosted feature layer views and other view layers in your map.
- Two additional file formats can now be published from a cloud drive: GeoJSON files and .zip files containing shapefiles or file geodatabases.
- You can now view layer-level metadata for hosted feature layers from the layer’s item page. The metadata is displayed in the style configured by the organization. Additionally, when exporting hosted feature layers as a file geodatabase, layer-level metadata is included in the feature classes in the exported file.
- A new Invasive Pest Monitoring feature layer template supports agricultural field inspections.
Story Maps
Story Maps let you combine authoritative maps with narrative text, images, and multimedia content, making it easy to harness the power of maps and geography to tell your story. This release includes the following enhancements and new capabilities.
Story Map Tour has a fresh, new side panel layout with an optional cover page.
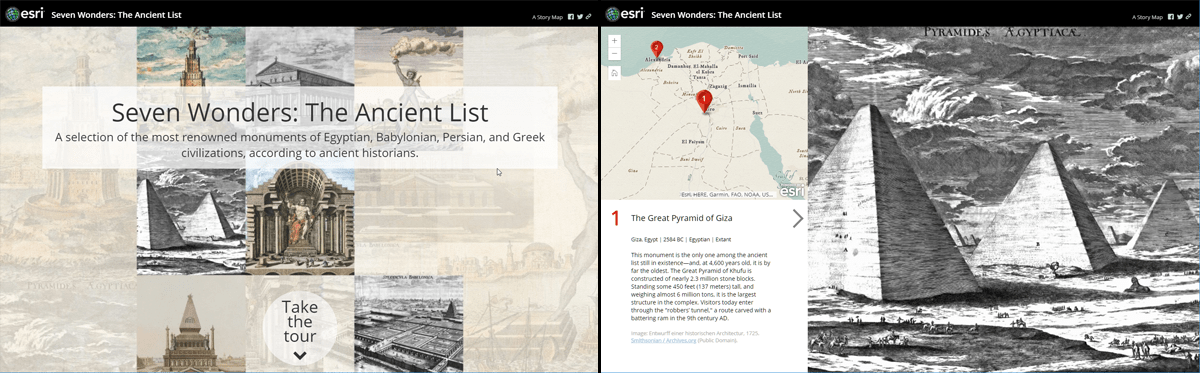
Existing Map Tours will continue to look and work as before, but you can switch to the new layout.
Other Story Map enhancements include the following:
- Story Map Cascade stories can be printed or exported to PDF. You can now create and edit maps without leaving Cascade builder. In addition, you can now author Cascade stories using Firefox.
- Story Map Series builder includes the ability to create Story Actions.
- My Stories checks for, and fixes, web security issues related to HTTP links in your stories.
For more information see the What’s New in Story Maps blog post.
Configurable apps
Configurable apps use templates that you can configure easily, without any coding, and help you publish apps quickly for a variety of needs. Configurable apps are the fastest and easiest way to go from a map to a shareable app. There are lots of configurable apps to choose from depending on your audience’s needs, what you need the app to do, and how you need it to look.
Changes for this release:
- Media Map is a new addition, presenting a simple UI that is suited for embedding in web media.
- Map Styler now supports public sharing of Living Atlas subscription content.
- The Maps and Apps Gallery is now in mature support; as an alternative consider Minimal Gallery.
For more information, see the configurable apps blog posts.
App builders
App builders let you easily create custom apps, no coding required.
App builders have been updated with the following enhancements:
AppStudio for ArcGIS
AppStudio lets you convert your maps into consumer-friendly mobile apps ready for Android, iOS, Windows, Mac OS X, and Linux, and publish them using your own organization brand to all popular app stores – no developer skills required. With AppStudio for ArcGIS, organizations have the ability to build cross-platform native apps easily. The upcoming 3.0 release is major release, including the following:
- Updated dependencies: ArcGIS Runtime 100.x only (ArcGIS Runtime 10.2.6 is no longer supported), Qt 5.10, Visual Studio 2017, and XCode 9.
- There two versions of AppStudio Player present in app stores, with an archived version of Player 2.1 available, as well as the current version of Player.
- The AppStudio tools have many improvements and fixes, and the template apps have new features, such as biometric authentication and support for offline use in the Map Tour template.
For more information, see What’s new in AppStudio for ArcGIS.
Web AppBuilder
Web AppBuilder offers a way for you to easily create HTML/JavaScript apps that run on any device, using a gallery of ready-use-widgets. You can customize the look of your apps with configurable themes, and can host your apps online or on your own server. The following are delivered with this release:
- New widgets for 2D apps; Data Aggregation (beta), Distance and Direction, Gridded Reference Graphic, and Emergency Response Guide.
- New widgets for 3D apps; Measurement and Share.
- The Dashboard theme is available for 3D apps.
- Edit widget has been enhanced to support related feature editing.
- Legend widget now allows you to choose which layers are used.
- Smart Editor now supports related table editing.
- The Infographic widget statistic layer for the extra data source now supports the option to filter data by the current map extent.
For more information, see What’s new in Web AppBuilder for ArcGIS.
Operations Dashboard for ArcGIS
Operations Dashboard enables you to stay on top of your operations by enabling you view and monitor activities, track assets, and viewing real-time data feeds. For this release, Operations Dashboard introduces several new features. You can now use serial charts and pie charts as the source of dashboard actions, and use the new embedded content element to embed documents, images, and videos into your dashboard. The map element now includes a scale bar and search feature, and you can specify new options for dashboards that contain subscriber content. For more information, see What’s new in Operations Dashboard for ArcGIS.
Apps for the field
ArcGIS apps for the field help you use the power of location to improve coordination and achieve operational efficiencies in field workforce activities. Apps for the field have made numerous enhancements since the previous ArcGIS Online update including the following:
Collector for ArcGIS
Collector for ArcGIS enables the use of your smartphone or tablet to collect and update information in the field, whether connected or disconnected. Collector for ArcGIS has updated since the last ArcGIS Online release. To use hosted tile layers in an offline map, you’ll need to update Collector, as an ArcGIS Online security enhancement has changed how the app needs to access them. For more information, see What’s new in Collector for ArcGIS.
In addition to the release, Collector is in beta with a next generation app. You can join the beta to test your workflows and provide feedback.
Explorer for ArcGIS
Explorer enables anyone to access maps everywhere using a mobile app for iOS and Android. Explorer for ArcGIS has had updates on iOS to streamline map interaction, and to support taking imagery offline. Groups of maps help you find the maps you need, a magnifier and other enhancements help you get information about your assets, and you get better control of map navigation. For more information, see What’s new in Explorer for ArcGIS.
Survey123 for ArcGIS
Survey123 is a simple and intuitive form-centric data gathering solution that makes creating, sharing, and analyzing surveys possible in three easy steps. Survey123 has had two incremental releases since the previous ArcGIS Online update. Many improvements and fixes have been made to how questions display and behave in a survey. In particular, surveys opened in a web browser support a greater range of question types and appearances, closely matching the field app.
Survey123 now also integrates with the Spike laser measurement solution developed by ikeGPS for iOS and Android, allowing your survey to use photos taken with Spike to extract values saved in the image. For more information, see What’s new in Survey123 for ArcGIS.
Workforce for ArcGIS
Workforce for ArcGIS is a mobile solution that uses location to improve the efficiency and coordination of your field workforce. Workforce for ArcGIS released an update improving the integration with other field apps and streamlining how workers are added to a project. You can configure your Workforce project to open Explorer for ArcGIS with a specific map. A GlobalID can be passed to Collector for ArcGIS or Survey123 for ArcGIS when opening those apps through Workforce for ArcGIS. In addition, project owners can add multiple users to a project using a CSV file. For more information, see What’s new in Workforce for ArcGIS.
Apps for the office
ArcGIS Apps for the office enable operations managers and analysts to visualize data in a geographic context to gain location-based insights and make decisions that save money and time. Some apps for the office have been updated. Here are a few highlights:
ArcGIS Business Analyst Web
Business Analyst is a web-based solution that applies GIS technology to extensive demographic, consumer spending, and business data to deliver on-demand analysis, presentation-ready reports and maps. Select from a wide variety of existing reports, or create custom reports to meet your marketing needs.
ArcGIS Business Analyst Web has several enhancements including a new option for using competitive layers in Suitability Analysis, a more streamlined experience with ArcGIS Online for finding and adding ArcGIS content, and improvements for the Build Infographics and New Comparison Reports workflows. For more information, see What’s new in ArcGIS Business Analyst Web App.
ArcGIS Maps for Adobe Creative Cloud
With ArcGIS Maps for Adobe Creative Cloud, creative professionals can access and design with data-driven maps inside Adobe Illustrator and Photoshop. The ArcGIS Maps for Adobe Creative Cloud update provides an improved user experience when using the Mapboards window, including upgraded editing features.
This release also introduces new features, including an imperial units-based scale bar, the ability to add KML files, and better support for Adobe applications running in non-English environments. For more information, see What’s new in ArcGIS Maps for Adobe Creative Cloud.
GeoPlanner for ArcGIS
GeoPlanner for ArcGIS helps you plan and evaluate land use, natural resource, and landscape architecture scenarios using collaborative dashboarding and sketch tools, helping you make informed, evidence-based decisions about development and conservation.
The upcoming update to GeoPlanner includes improved analysis when using the Suitability Modeler widget, better management when using indicators, and expanded use cases for summary charts. At this update, the Suitability Modeler widget in Web AppBuilder for ArcGIS includes the summary chart. The widget allows you to summarize model scores in a dashboard using selected features and graphics, helping you make analysis more accessible for your users.
You can also use layers with simple, unique value, classified, and visual variable symbology in the summary chart. This enables you to use the output of Create Travel Times, Aggregate Points, Calculate Density, Find Hot Spots, and so on in the summary chart directly. You can also view an attribute table for design and operational layers so you can sort and get statistics on fields to help you rank features and edit attribute values of design features. For more information, see What’s new in GeoPlanner.
For more information
For more information and additional details see the What’s new help topic or view all posts related to this release.

Commenting is not enabled for this article.