ArcGIS Online lets you understand the world around you by using interactive maps to connect people, locations, and data. You get smart, data-driven styles and intuitive analysis tools that deliver location intelligence. ArcGIS Online gives you the ability to make maps and apps to share your insights with your organization or the world. You can use it as a complete, cloud-based solution or to extend and complement the capabilities of ArcGIS Pro and ArcGIS Enterprise.
Don’t have an ArcGIS account? See Create an ArcGIS Account.
The February 2023 update includes new functionality in Map Viewer, such as spatial analysis tools, plus other enhancements and new capabilities throughout the ArcGIS Online website. Highlights are provided below.
ArcGIS Online is updated three to four times each year. See the ArcGIS blogs to learn more about previous updates to ArcGIS Online and new functionality and enhancements you may have overlooked.
Don’t have time to read the blog article? View the video below instead.

Quick links
Use the links below to jump to sections of interest.
- Map Viewer
- Scene Viewer
- ArcGIS Instant Apps
- ArcGIS Experience Builder
- Data management
- Sharing and collaboration
- Accounts and administration

Map Viewer
Map Viewer is the premier way to author, explore, and edit web maps. Administrators and members are encouraged to configure Map Viewer as their primary map viewer to take advantage of the new capabilities and enhancements that are delivered with each update.
With this update, Map Viewer has been enhanced with new capabilities and features, including the following:
New analysis experience
Spatial analysis tools allow you to quantify patterns and understand relationships in your data. Most of the feature and raster analysis tools you’ve been using in Map Viewer Classic, plus a few new ones, are now available in Map Viewer with a new, enhanced experience, and new capabilities.
Click Analysis from the Settings (light) toolbar to show the analysis pane where you can browse all tools or view previous analysis history. Analysis history shows which tools have been run, their results, the parameters used, and any errors or warnings. Tools are organized by function and can be searched by name or keyword. Hover over a tool to get more information.
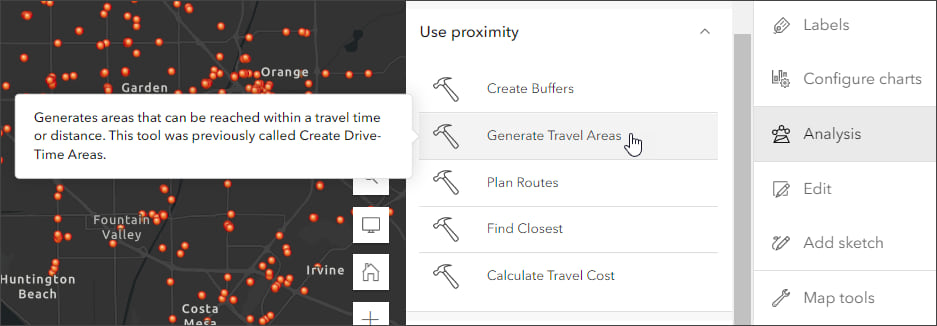
When you save your map, the analysis tool history is saved along with it, allowing others to view job details and reopen the tool parameters when you share the map. This provides a way for others to use the analysis that you have done and modify and extend it for their own uses.
ArcGIS Image for ArcGIS Online is a complete software as a service (SaaS) extension for hosting, visualizing, analyzing, and sharing imagery. In this release, ArcGIS Image users will see 24 raster analysis tools added to Map Viewer along with additional display options to improve the user experience. For more information, see What’s new in ArcGIS Image for ArcGIS Online (February 2023).
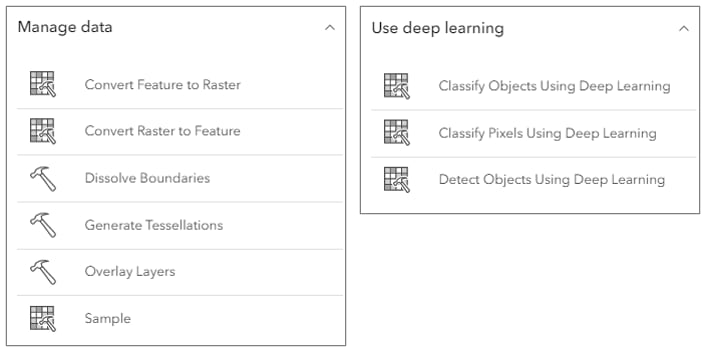
Before using a tool, you can estimate credit usage based on the parameters you enter.
To view a comparison list of tools between Map Viewer and Map Viewer Classic, see Tool comparison. For more information on feature and raster analysis, see Perform analysis and Introducing Analysis in Map Viewer.
Media layer
A new media layer is introduced, available from the Contents (dark) toolbar in the Add or Layers pane.
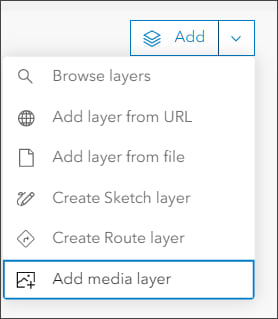
Adding a media layer enables you to select a .jpg or .png image file that will be added to your map. Use the tools to position and rotate the image to place it in the desired location. Placement options include a side-by-side view showing image anchor points that can be repositioned.
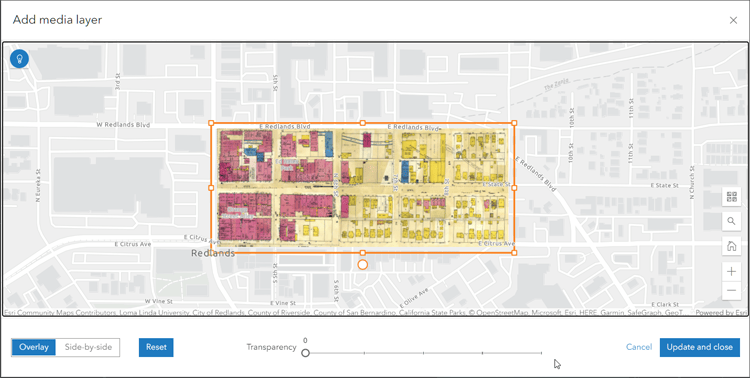
Effects can be applied to media layers, and once the positioning has been saved you can open the media layer properties and to update the placement and reposition the image if needed.
Upload image symbols
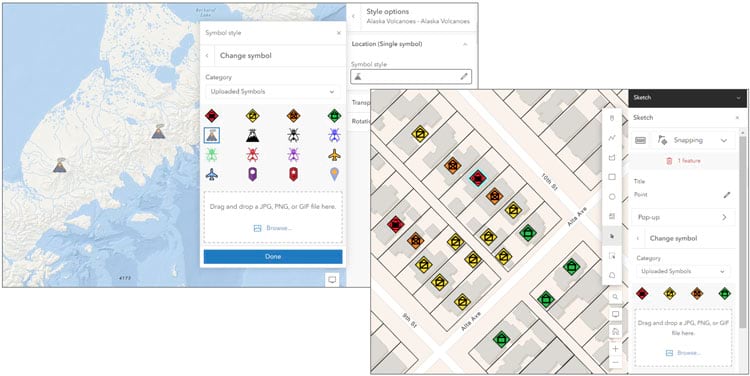
You can now upload .gif, .jpg, and .png images to use as symbols when styling your layer or creating a sketch in Map Viewer. Symbols are retained for reuse in other layers or sketch layers until your browser cache is cleared.
Groups in legends
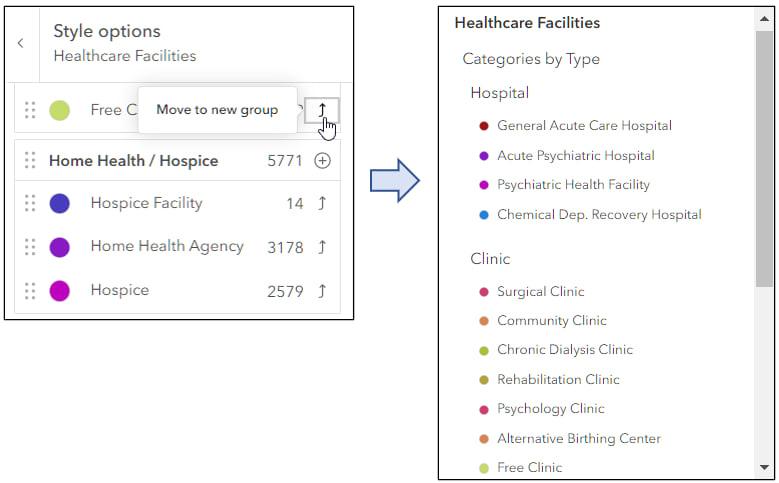
When styling a feature layer by type using unique symbols, you can create legend groups to add detail and organize the map legend. For example, if your map shows health facilities by category—surgical clinic, home health agency, and so on—you can organize these into groups, such as hospitals and clinics, and have the groups shown in the legend.
Click the arrow beside a category to create a new group. Drag and drop elements into (or out of) groups, and to re-arrange them within groups.
Display order of overlapping features
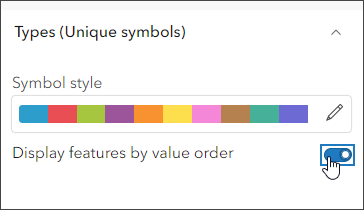
Map Viewer now offers a new way to control the feature display order of overlapping features in layers with Types (unique symbols) or Predominant category styling applied. When you manually change the order of types in the list, you can now display overlapping features based on this order, with features in types that are higher in the list drawn on top of features in types that are lower in the list.
Search tool access
The Search tool in Map Viewer is now available directly from the lower right corner of the map, located with the hide/show interface, home, and zoom in/out buttons. It can also be accessed using a keyboard shortcut—Alt+f on Microsoft Windows or Option+f on Mac.

Scene Viewer
Use Scene Viewer in ArcGIS Online for creating, viewing, and exploring 3D scenes. With this update, Scene Viewer has been enhanced with new capabilities and features, including the following:
- You can now snap to features while measuring in Scene Viewer.
- Scene Viewer allows you to append a custom request parameter for supported layers.
- Voxel layers support pop-ups and you can use the slice tool to explore your voxel data further.
- Terrain visualization has been improved with enhanced shading and higher elevation resolution.

ArcGIS Instant Apps
ArcGIS Instant Apps is the next generation of focused web mapping applications, featuring a streamlined experience that lets you build apps quickly and easily using express or full setup modes. All Instant Apps templates can found on the searchable Instant Apps home page.
ArcGIS Instant Apps templates includes several new and updated apps. Hover over the badges in the app cards to learn more about new, updated, or beta apps.
Insets
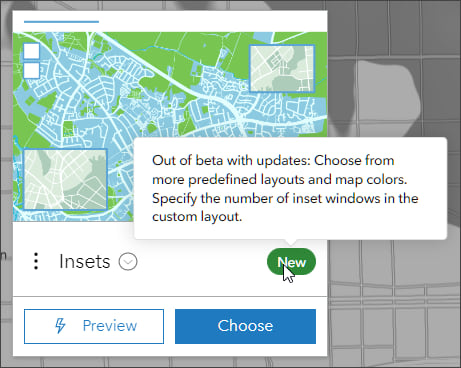
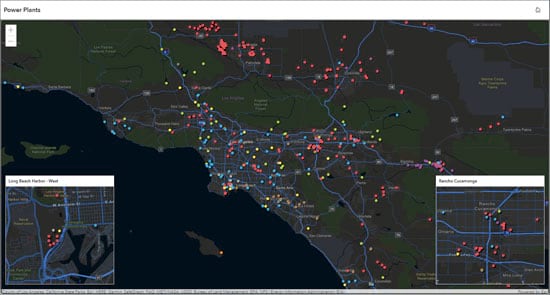
Insets is now out of beta and fully released. Insets displays noncontiguous geographic areas of interest within a single app, using bookmarks, custom inset locations, or using predefined layouts available for several countries, including United States, France, Portugal, Spain, and Japan.
Interactive Legend
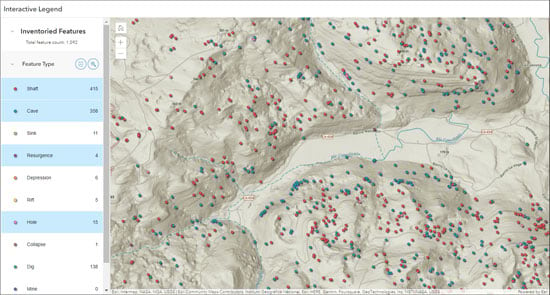
Interactive Legend now supports collapsing portions of long legends and delivers a new side panel style that docks the legend selector on either side of the map, giving users more space to interact with the legend.
Slider
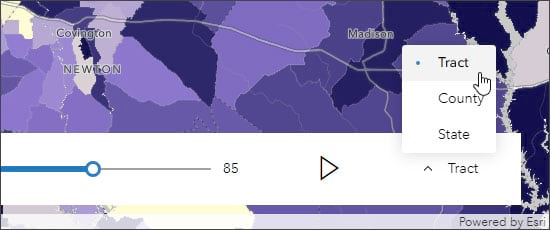
With the Slider template, you can now configure multiple numeric sliders to play different data animations in the app. The data driving the animations can be found in separate layers or in unique fields in a single layer.
Atlas (Beta)
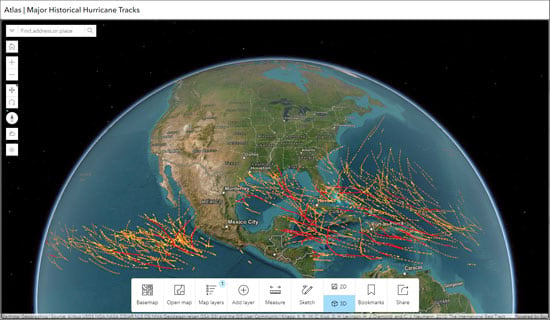
Atlas is a group-based Instant App that is released in beta with this update. The Atlas app empowers organizations to highlight a collection of curated maps and layers based on a point of interest, a geographic location, a theme, or a specific event. Users can easily discover and explore the content, as well as share the maps they create. Some useful built-in tools to help users explore the map include searching locations, switching between 2D and 3D, measuring distance and area, and drawing on the map with sketch tools.
Public Notification (Beta)
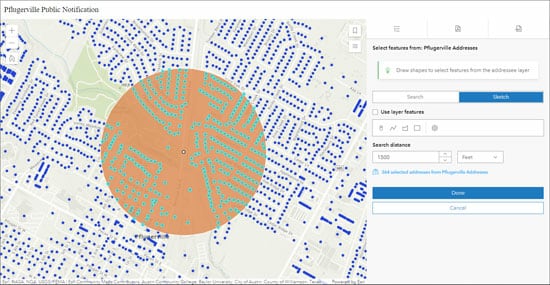
Public Notification enables you to create a collection of features that can be exported to CSV or PDF file. Features can be selected by searching a location, drawing an area of interest, or using existing features. A buffer can be applied to expand the search area.
All attributes are included in the exported CSV file. For the PDF export, the pop-up configuration determines the information that is included. The information in the pop-up can be configured using any pop-up element, and can include Arcade expressions. The pop-up can be crafted to support printing mailing labels or other information reports.
For more information, see What’s new in Instant Apps.

ArcGIS Experience Builder
Use ArcGIS Experience Builder to build modern mapcentric or non-mapcentric web apps and webpages without writing any code. Engage your audience through compelling web experiences on any screen size. Start from scratch or choose from an extensive library of templates that you can easily customize. Add advanced functionality with widgets you can drag, drop, and configure. Enjoy fully flexible layout options to build any web experience for any purpose. ArcGIS Experience Builder includes several new features and updates, described below.
New and updated widgets
The new Add Data widget allows users to add data sources to an app at runtime. The Business Analyst widget has redesigned settings, with options for presetting an infographic and location or letting users choose both at run time. Other widget enhancements include support for histogram charts, the 3D Slice tool, and the ability to choose which layers display in the Map Layers widget.

New message actions
Three new message actions are available for creating interactions between widgets. The Add to map action automatically displays data from the Add Data widget on a Map widget. The Select line action automatically generates an elevation profile for a selected line feature. The Select feature action runs the Business Analyst widget for the chosen feature.
For more information, see What’s new in Experience Builder.

Data management
Offline use
You can select a tile package item from your organization to use as the basemap when you configure a web map for offline use. When you use this advanced offline option, you don’t have to load the tile package to all devices that will take the map offline, and ArcGIS Online does not have to compress the map’s basemap into a tile package to take it offline.
Improve query performance with indexes
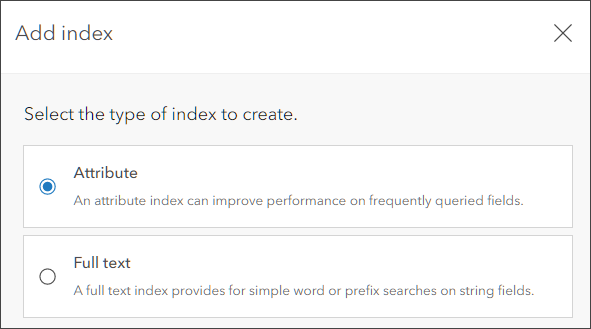
If queries using certain fields in your hosted feature layer are slow, you can define attribute indexes to optimize performance. To improve queries that search for words or phrases in string fields, you can add a full-text index. For more information, see Add indexes to attribute fields.
Improved sharing
ArcGIS Online provides more information to web map owners and organization administrators to help troubleshoot problems with the sharing settings that are configured for the layers in the map.

Sharing and collaboration
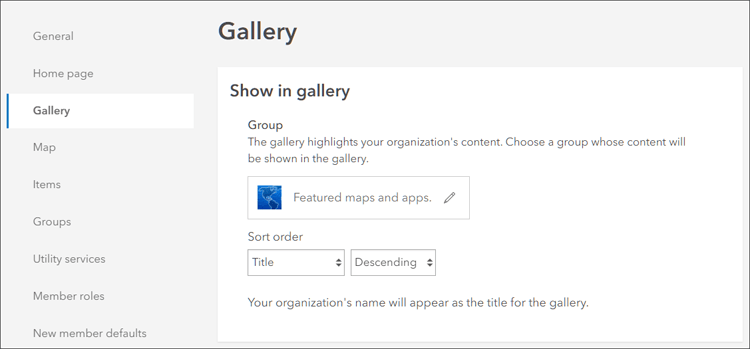
Your organization home page and all other pages have a navigation bar at the top with a series of tabs that you can configure. One of those is the Gallery tab. Organization administrators can configure what is displayed in Settings > Gallery > Show in gallery:
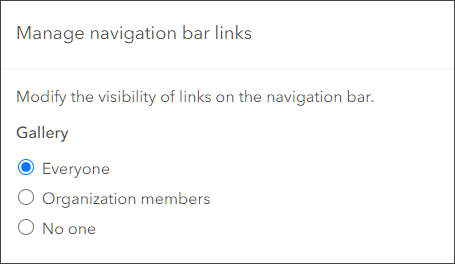
You can also configure who sees the Gallery tab in Settings > General > Navigation bar > Manage navigation bar links:
With this update, a redesigned gallery page is introduced, providing a quick view of item details in a side panel. The gallery also allows viewers to filter by item type, status, categories, and more without needing to leave the gallery.
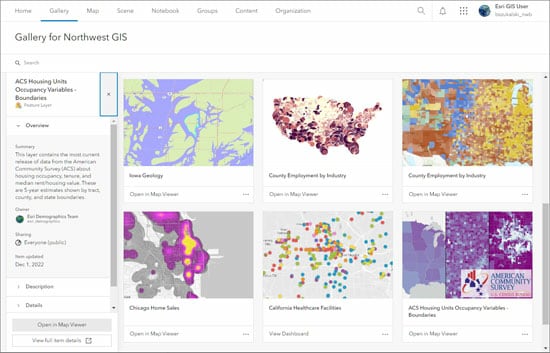
A best practice is to consider who will be able to view the Gallery tab of your organization, and configure it appropriately for the intended audience. For more information, see Navigation bar and Is this the right item?

Accounts and administration
The organization overview page has been enhanced to include at-a-glance information about feature data storage status, with color-coding to indicate when a subscription is close to reaching its feature data storage limit. A redesigned feature data storage chart is also available for organizations with Premium Feature Data Store.
Item view count report
Organization reports are a way for administrators to export important information about organization credits, members, content and activities. A new type of organization report is available in ArcGIS Online. Administrators can now create item view count reports to help them see trends in traffic to specific items in the organization over time. The new report is available from the list of reports, along with others such as activity reports, credit reports, member reports, item reports, and service usage reports.
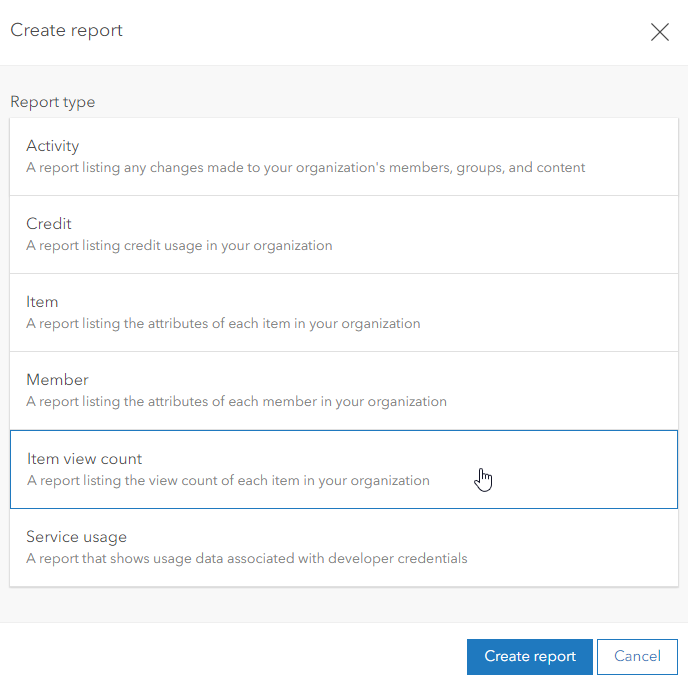
Administrators can download the views and evaluate the usage of an item over a period of time up to a year, as well as understand which days, weeks, or months users are viewing and interacting with their content the most. For more information, see Item view count admin report.

More information
For more information and additional details about this release, see the What’s new help topic or view all posts related to this release. You can also watch an introductory video to see the new capabilities in action.
For other information, see the ArcGIS Online blog articles and ArcGIS Online at the Esri Community.
For news, updates, and information about other products, see the ArcGIS Blog and product resources at the Esri Community.


Commenting is not enabled for this article.