We all love to explore our data using the fast and powerful drawing styles available in ArcGIS Online through smart mapping. Many times, I also want to explore my tabular data. To help me do this, the attribute table as well as associated metadata, is available in the Data tab within the layer’s Item Page.
View the table from the Item Page
Click on the Data tab and view the attribute table. If there are multiple layers (for state, county, and tract, for example), simply click on the Layer: option to toggle through the multiple attribute tables.

The display names, sometimes called aliases, are presented in the table as column headers. Hover over any header and see the description come through. Field descriptions expose any definitions, sources, formulas used, data vintages, and the like that have been included by the layer’s owner. For example, what exactly is a veteran? And what exactly is a bachelor’s degree? The descriptions in this layer make it clear.
, but are not currently serving, on active duty in the U.S. Army, Navy, Air Force, Marine Corps, or the Coast Guard, or who served in the U.S. Merchant Marine during World War II. People who served in the National Guard or Reserves are classified as veterans only if they were ever called or ordered to active duty.\" appears when hovering over the field.")
Detailed View of fields
Click on a specific field and then click Show Detailed View.

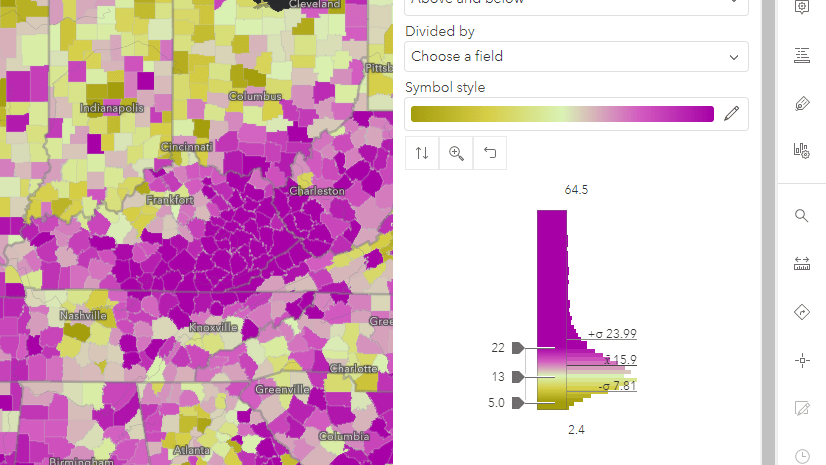
Here you will see a column of values, as well as a histogram for numeric fields or a frequency table for string fields. In addition, you will see the field’s Name, Type, and Settings.
Example of a numeric field showing a histogram:

Example of a string field showing a frequency table of the top 10 values:
, Georgia (159), Virginia (133), etc.")
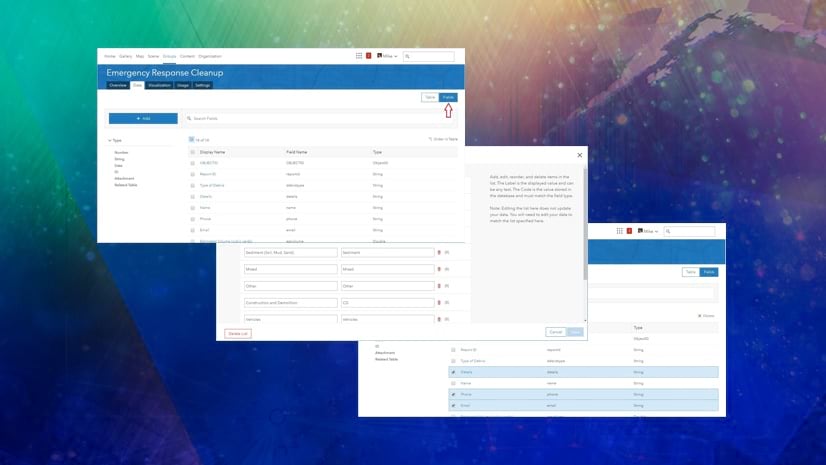
Fields List offers a layer-wide look
Sometimes the fields list showing all available fields contained in the layer will be more informative. Click the Fields button to move between the Table vs. Fields view. Here you can see the total number of fields, and choose to see them displayed as a List or a Table. By default, you will be taken to the List view. The field name, display name (alias), description, database type, and field value type are all visible for each attribute.
From the Fields List, you can sort by Order in Table, Display Name (alias), Field Name (actual field name), or Type (number vs. string, etc.). There are also Filter options on the left side to show only fields of a certain database Type and Field Value Type.

The field value type is an opportunity to get more specific about the value this field is storing, which can be helpful when sharing a layer to a wide audience. For example, a numeric field might be a Count or Amount, Percentage or Ratio, Currency, or more. The field value types take advantage of any attribute field types that have been set by the layer’s owner, and help the map viewer to suggest appropriate symbology styles.
Each field in the list shows all the metadata associated with it in one glance: the alias or display name, the field name, the field value type, the database field type, and the description.

If you own the layer, this is where you can modify aliases, descriptions, and field value types. The benefit of doing this is well worth the effort. If you will be sharing your layer with coworkers, or if you want to document your work for future self, help everyone out by storing as much of the metadata as possible in the layer itself. This way, users do not have to go look it up in documentation elsewhere.
All user types can work in the Data tab
All ArcGIS Online user types, such as viewer, editor, and creator benefit from working in a layer’s Data tab.
Viewers
Viewers have the ability to see the attribute table and associated metadata in a secure environment, even when the layer is not shared publicly. They can also view attachments from the table such as photos or files, as well as navigate related records.
Editors and Field Workers
Editors and field workers can view and edit data that has been shared with them in ArcGIS Online. While in a layer’s Data tab, these users can add or edit attachments, calculate fields, and edit data values as needed. These values can be influenced by available coded value lists and min/max range domains set by the layer’s owner (usually a Creator).
Creators
In addition to all the abilities of viewers and editors, GIS content creators can add and remove fields, and modify display names, field descriptions and field value types. Creators can also define coded value lists and set min/max values for range domains, which helps with quality during data collection.
Metadata shows up in the Map Viewer too
As much as I love understanding a layer through its Data tab, all this metadata is also exposed through the Map Viewer. This allows you to learn about a layer’s various fields, view descriptive statistics and long field descriptions, interact with histograms, and more while you are creating a map. The Data tab of a feature layer’s Item Page is just one more place for your layer to communicate to other GIS analysts, and ultimately, to shine.


Article Discussion: