For those looking to streamline their data management and analysis in ArcGIS, the Calculate fields tool is a familiar ally because it enables you to create new insights from existing data. For example, the tool helps when your dataset is missing a value that needs to be derived from other fields. If you want to know population growth but only have population numbers and years, you can create a field for growth percentage and use the tool to automatically calculate it, saving you from doing each calculation manually.
The real benefit comes after the calculation. You can classify or symbolize your data based on these new values, uncovering patterns, trends, and relationships that weren’t visible before. This turns raw data into actionable insights and helps tell a more compelling story.
And now, creating the essential Arcade expressions that power the Calculate Fields tool has become even more intuitive with the ArcGIS Arcade assistant (beta) by your side. These expressions are what allow you to populate fields with calculated values. Unsure about your Arcade skills? No problem because the assistant takes in your natural language prompts and builds Arcade expressions for you, lowering the learning curve and allowing you to focus on your goals.
Knowing this, how can you prompt the assistant to accurately give you the expressions you need to complete your tasks? Let’s look at a couple real-world examples and prompts you can use to solve challenges.
Example 1: Population growth analysis
Problem: Your department needs to analyze population changes across different countries to determine which areas are experiencing the fastest growth. You have population data from 2022, 2020, 2015, 2010, and all the way down to 1970 in 5-year increments. However, you only need to calculate the change and growth rate between the years 2022 and 2020.
Approach: Use the assistant to generate Arcade expressions to help you calculate the growth rate. you can also ask the assistant to help you classify. More on this below.
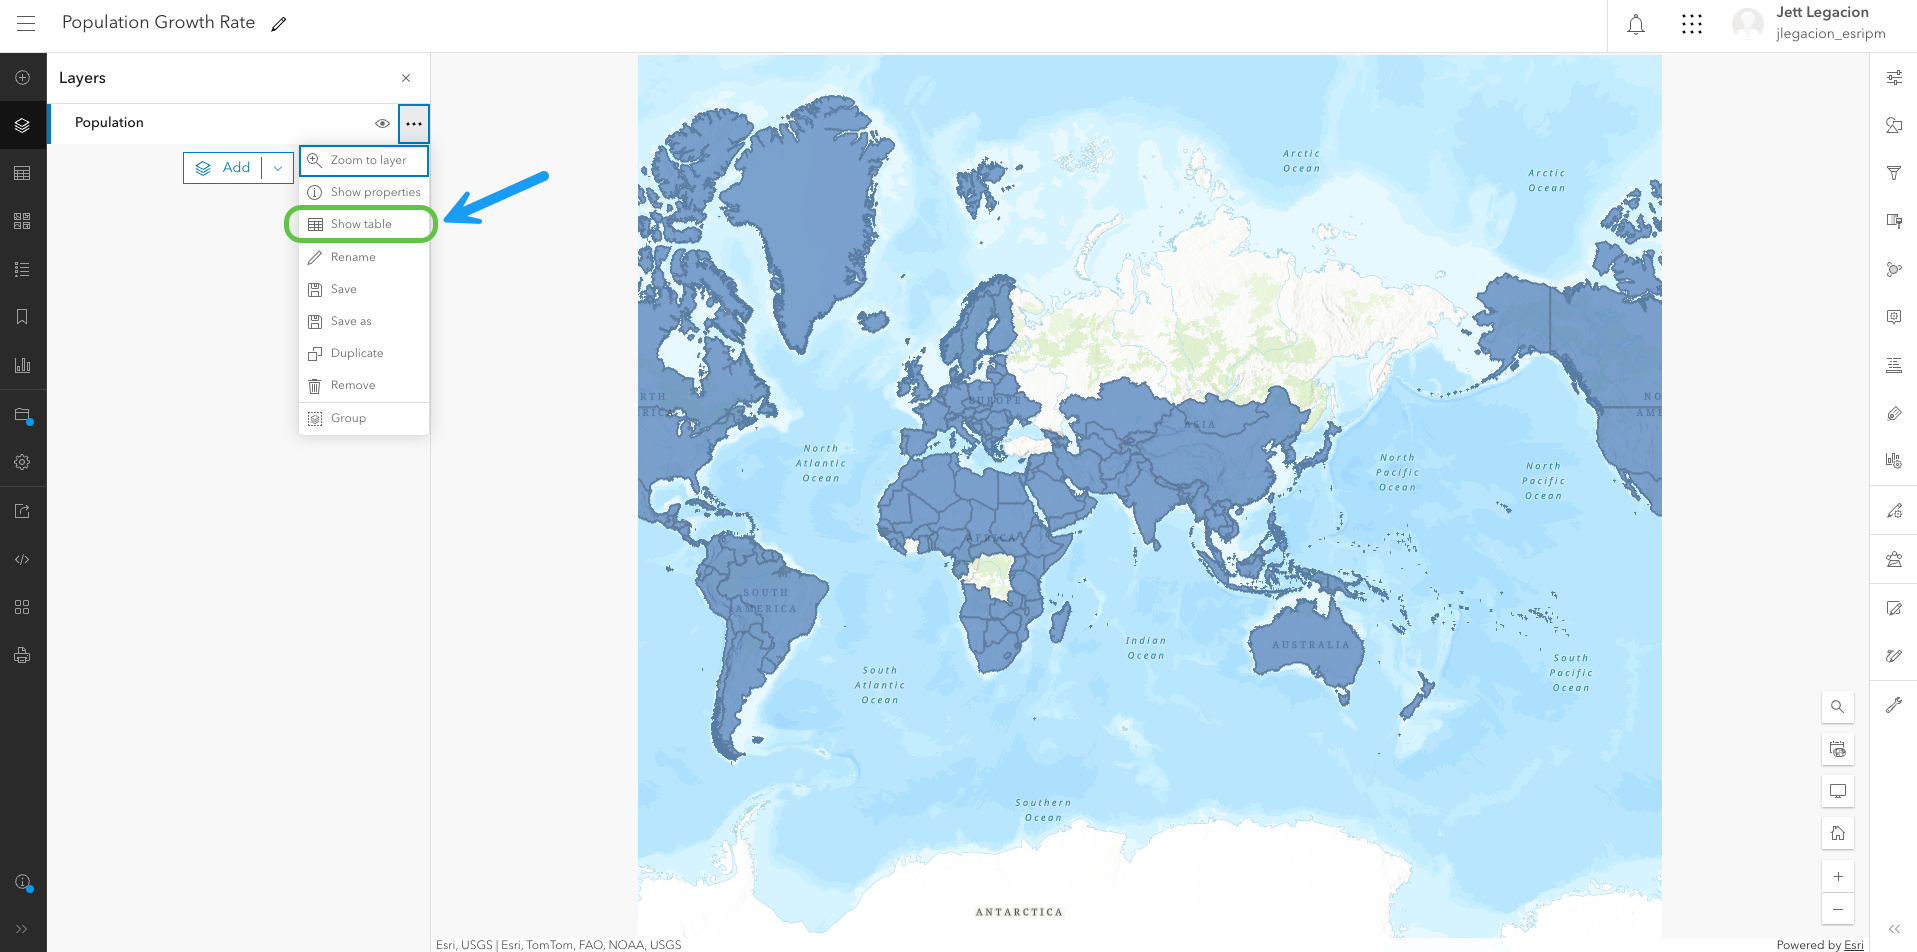
In Map Viewer, you have a world polygon layer that contains population data. This layer’s attribute table is where you will access the assistant to calculate fields. Let’s open up the table.
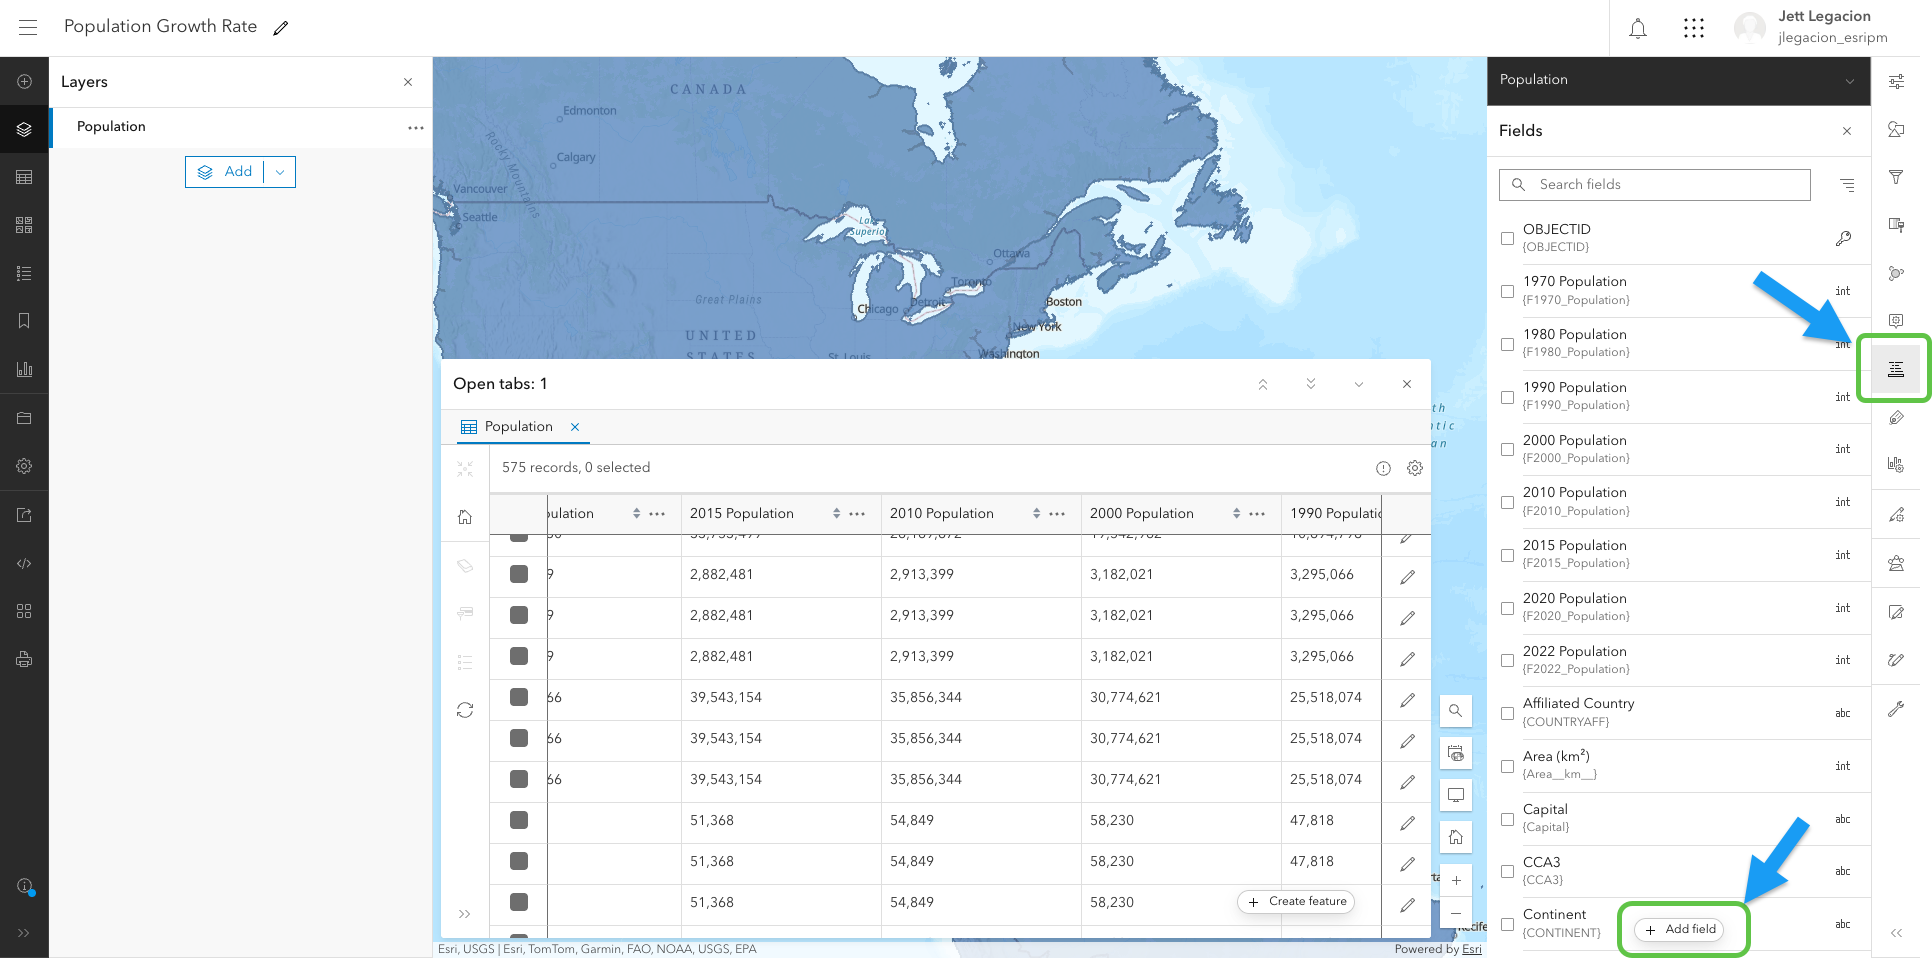
From here, let’s create a new field for the growth rate, since the table currently does not have one. To do this, we’ll first navigate to the “Fields” button and then click “Add field”
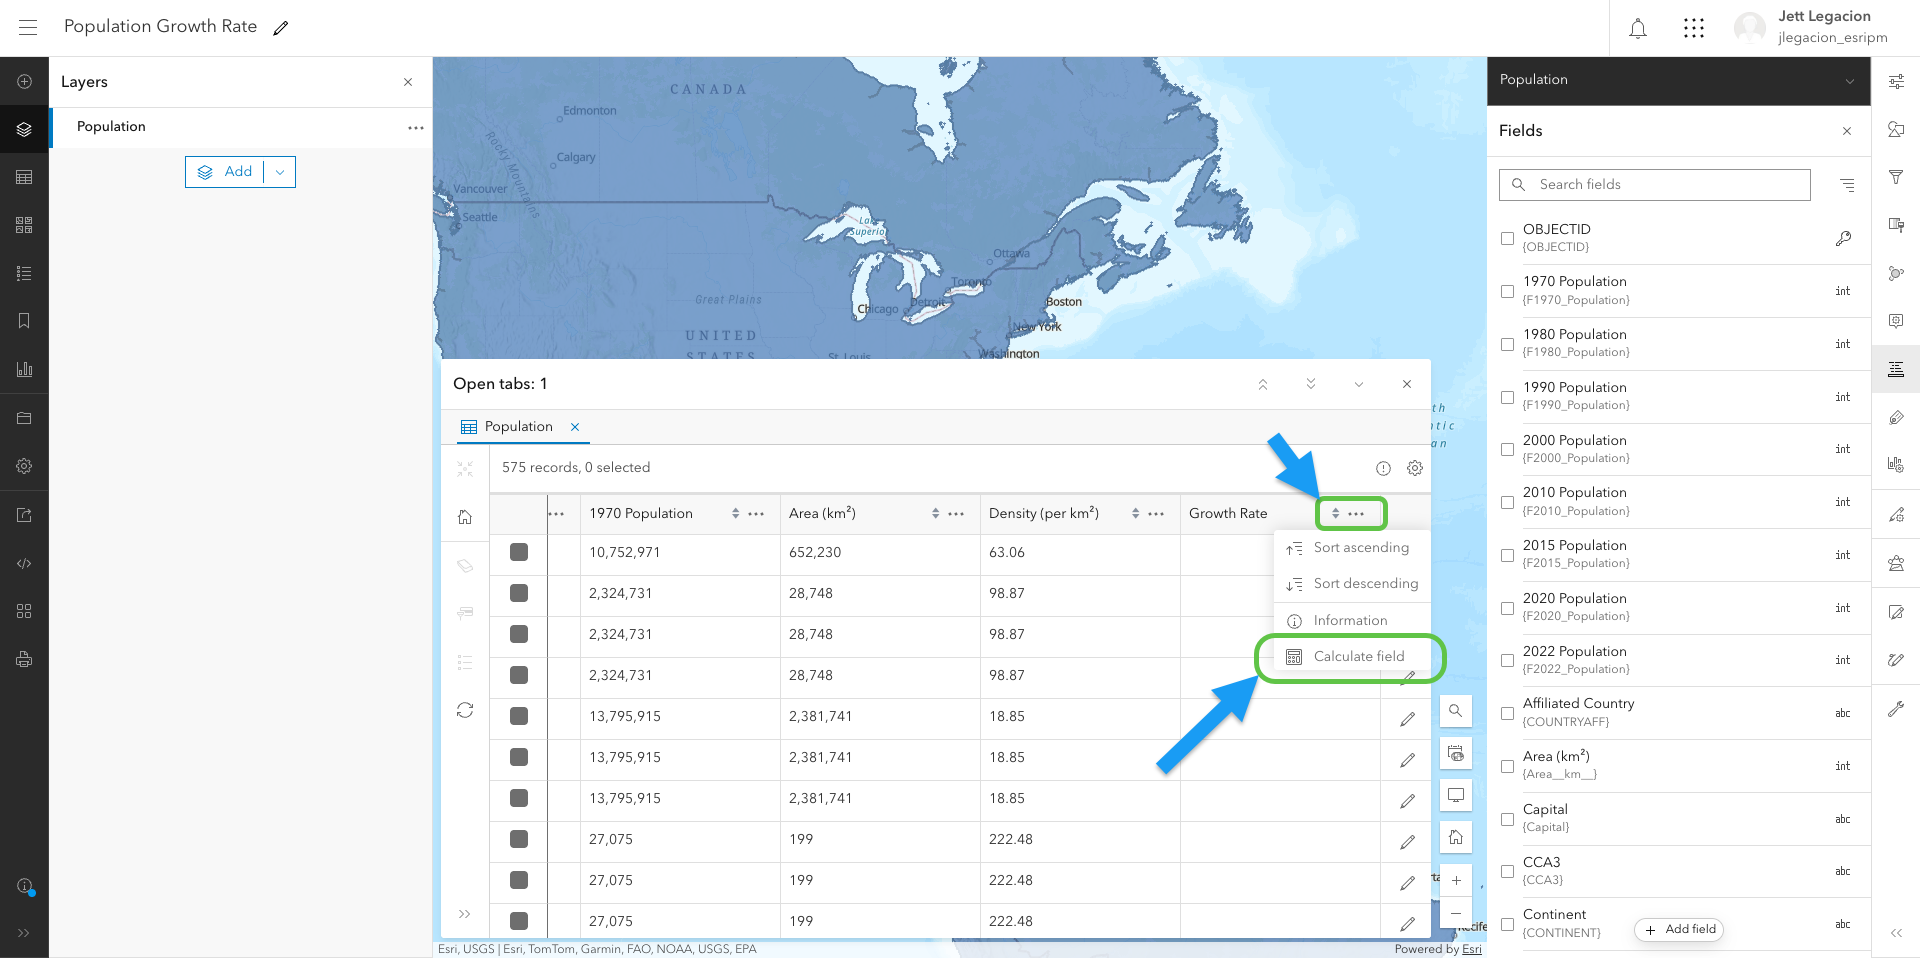
In the currently empty field (Growth Rate) that we just created, we’re going to click the 3 horizontal dots and press “Calculate field”. From there, you’ll have the option to choose between Arcade and SQL. In this case, you want to select Arcade (for the Arcade assistant). You can also choose to filter your data to the portion you want to calculate on. However, this is optional. Click “Next” on the bottom right.
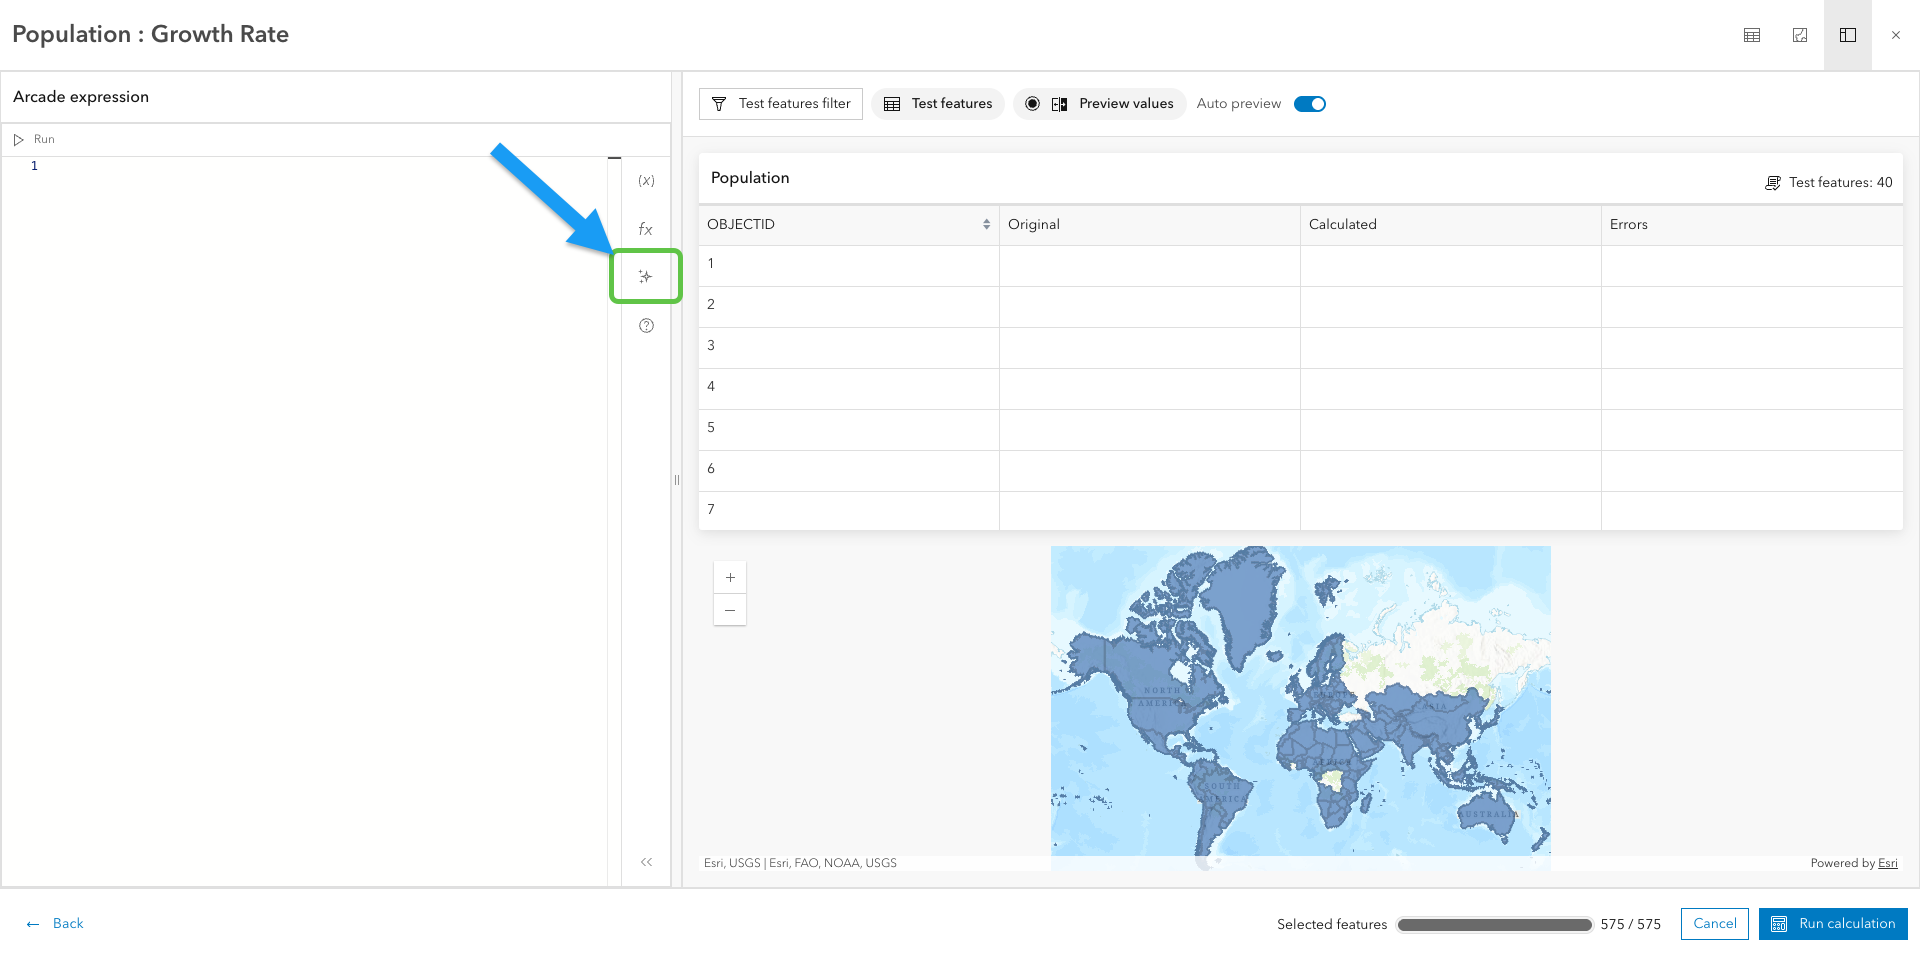
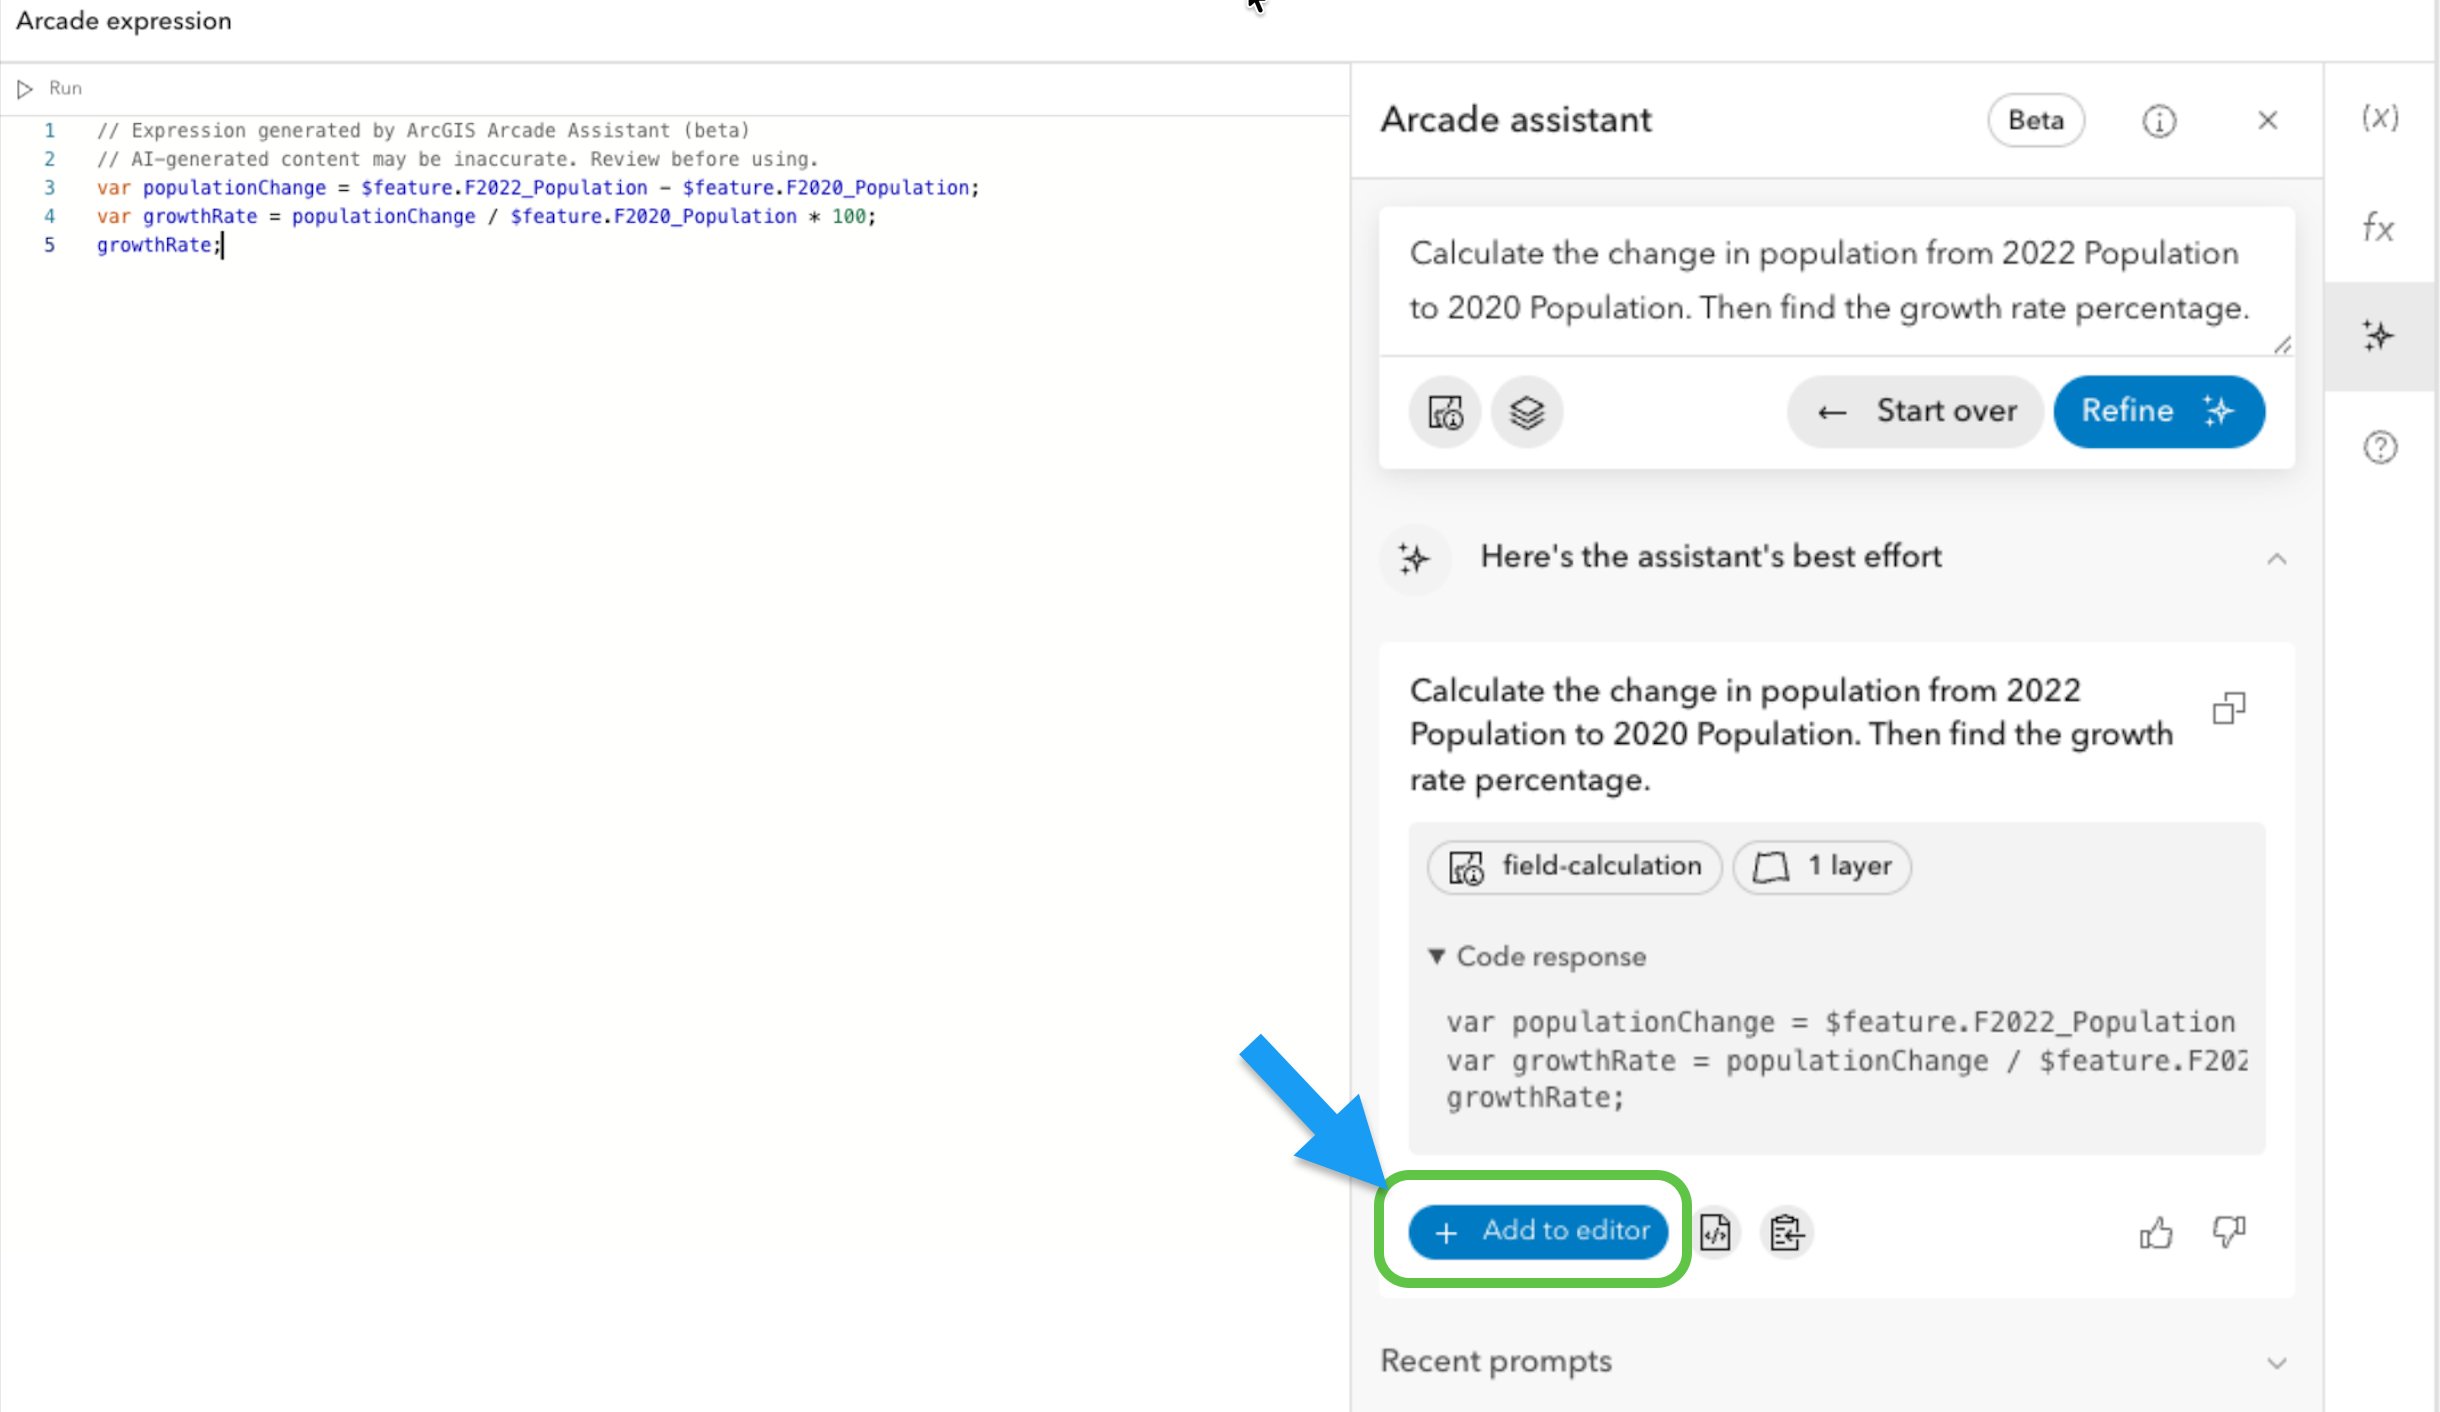
Once we reach the Arcade expression editor, we can find the assistant by clicking the Arcade assistant button. Now we’re ready to prompt.
Prompt tips :
- Refer to the fields you want the assistant to reference by their actual names. For example, “2020 Population” and “2022 Population”)
- Stay concise to keep your prompt clean and optimal for the assistant
- Be precise and specific
To insert the code that was generated by the assistant, click “Add to editor” and “Run calculation” at the bottom right of the screen.
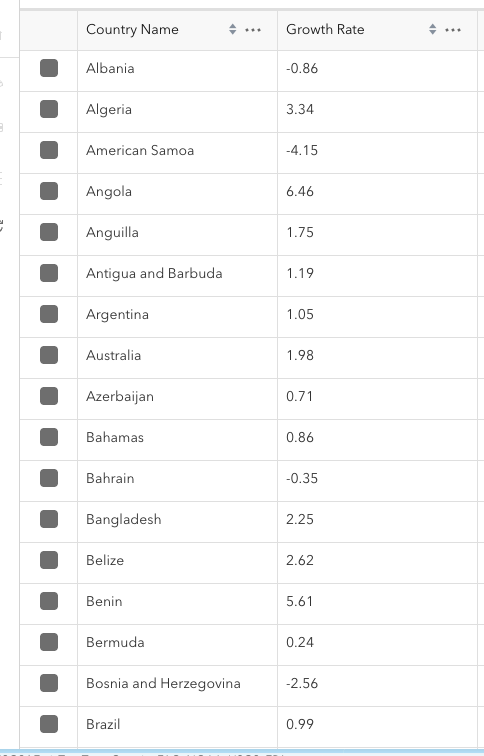
Now the Growth Rate field is populated with the calculations we wanted. Each field value now equals the change in percentage from 2020 to 2022.
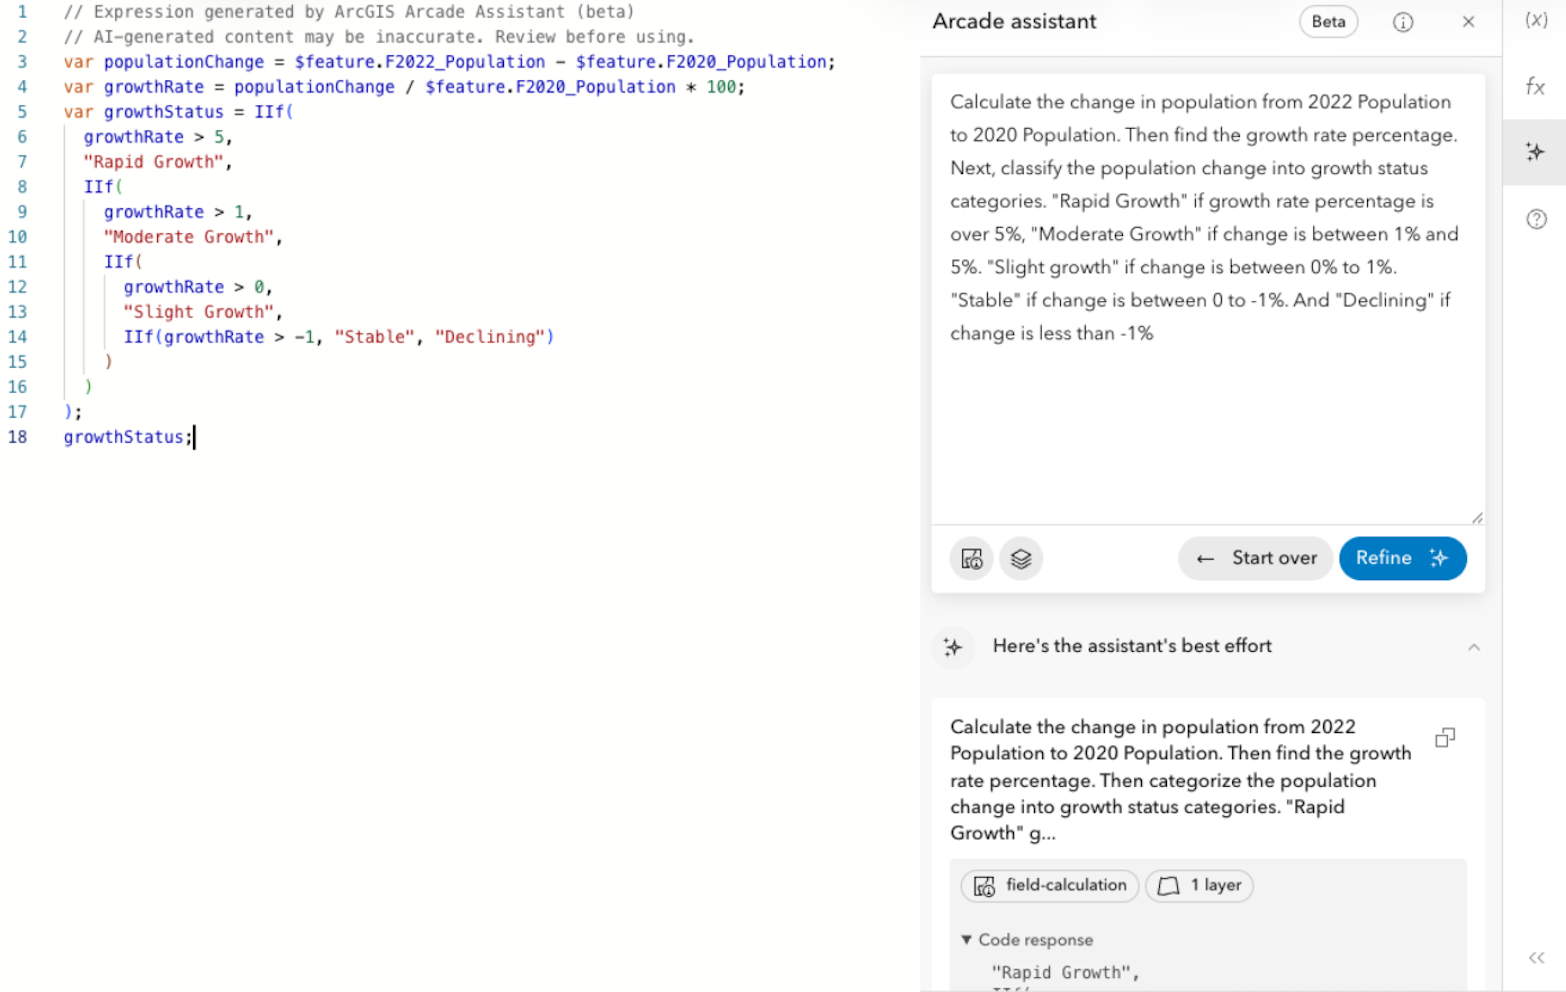
Let’s take a step further by classifying the values into categories like “Rapid Growth”, “Moderate Growth” and so forth. To start, let’s create a classification field and open up the assistant like we did previously, and enter our prompt.
Note: Since we are in a newly created field, “Classification”, we are going to repeat the prompt used for the “Growth Rate” field and then ADD classification instructions.
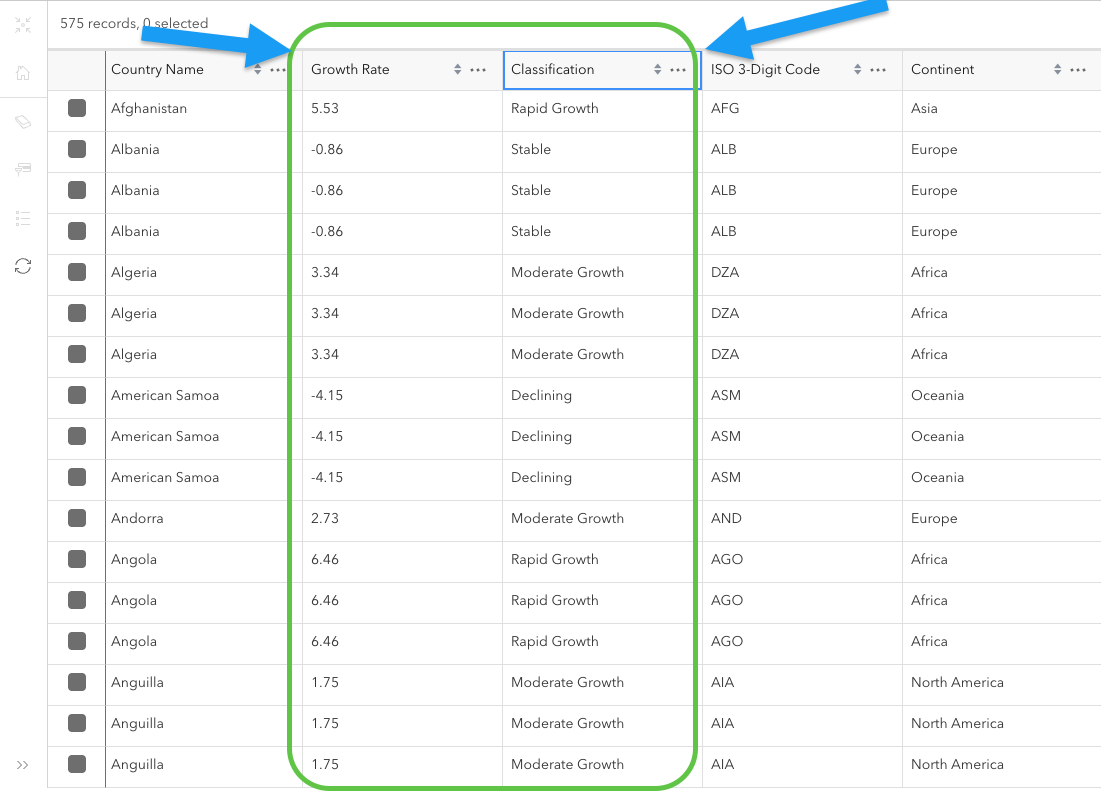
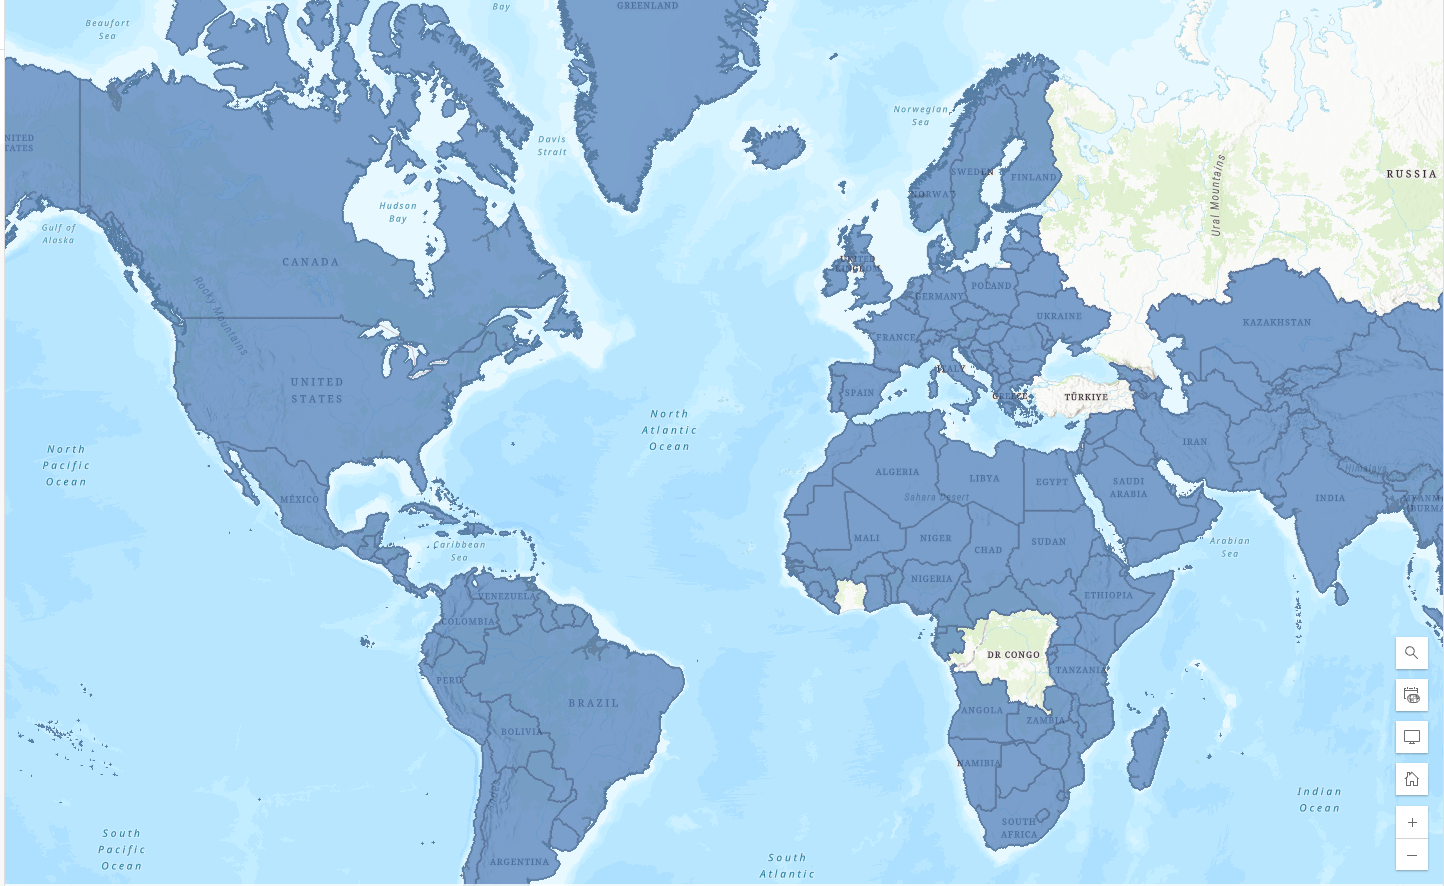
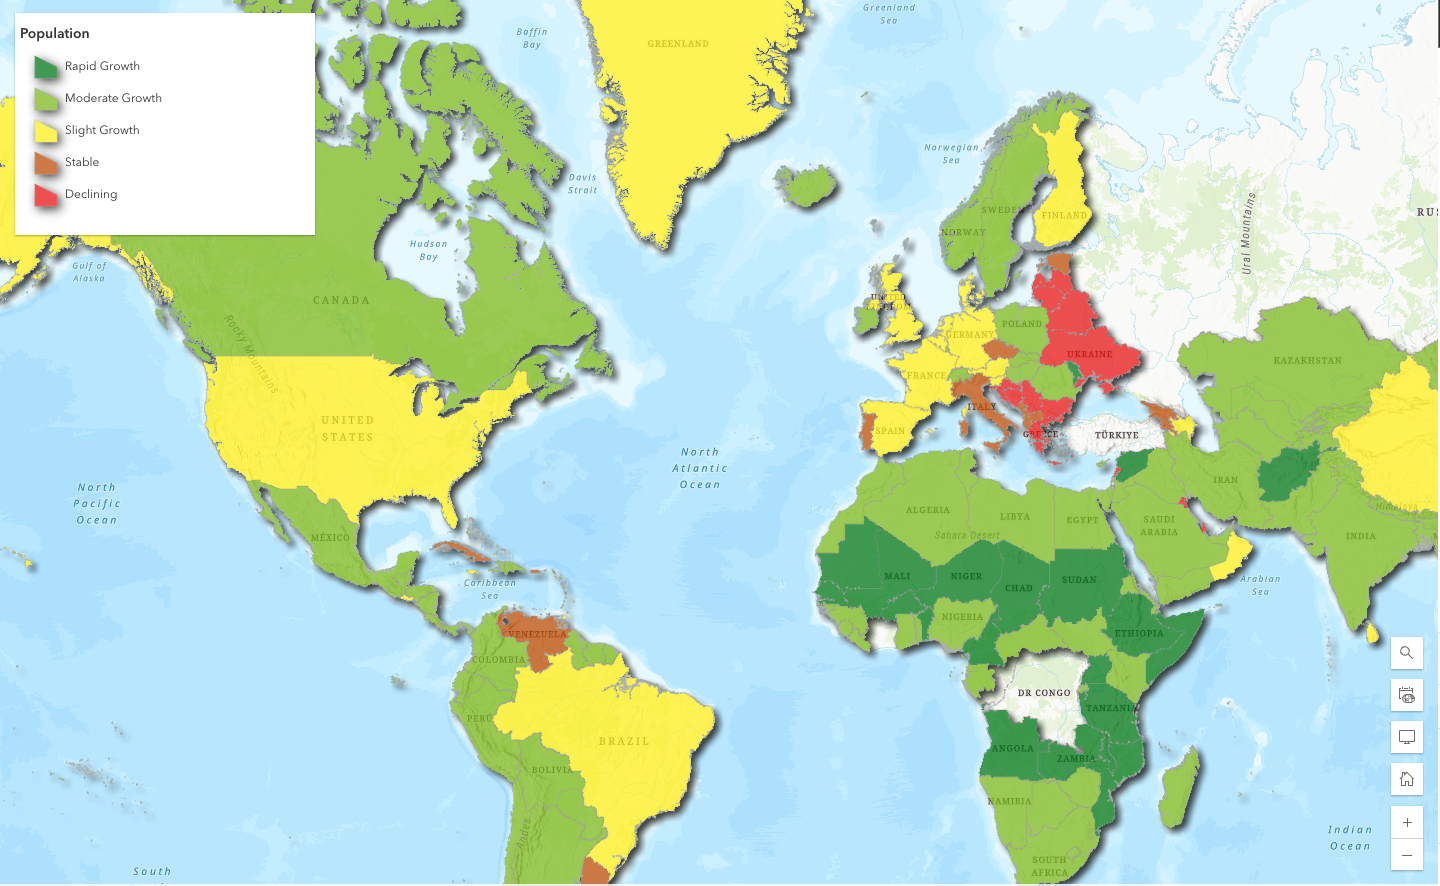
Now our two new fields, Growth Rate and Classification, have been correctly populated with the help of the assistant. Let’s symbolize based on the classification field to help visually clarify what countries are growing the fastest or slowest.
Before
After
To recap:
We prompted the assistant to fill out two new fields that we created with calculations to help us better understand the data. Once we successfully calculated fields, we were able to symbolize based on our classification field to craft a more engaging, but also insightful visual.
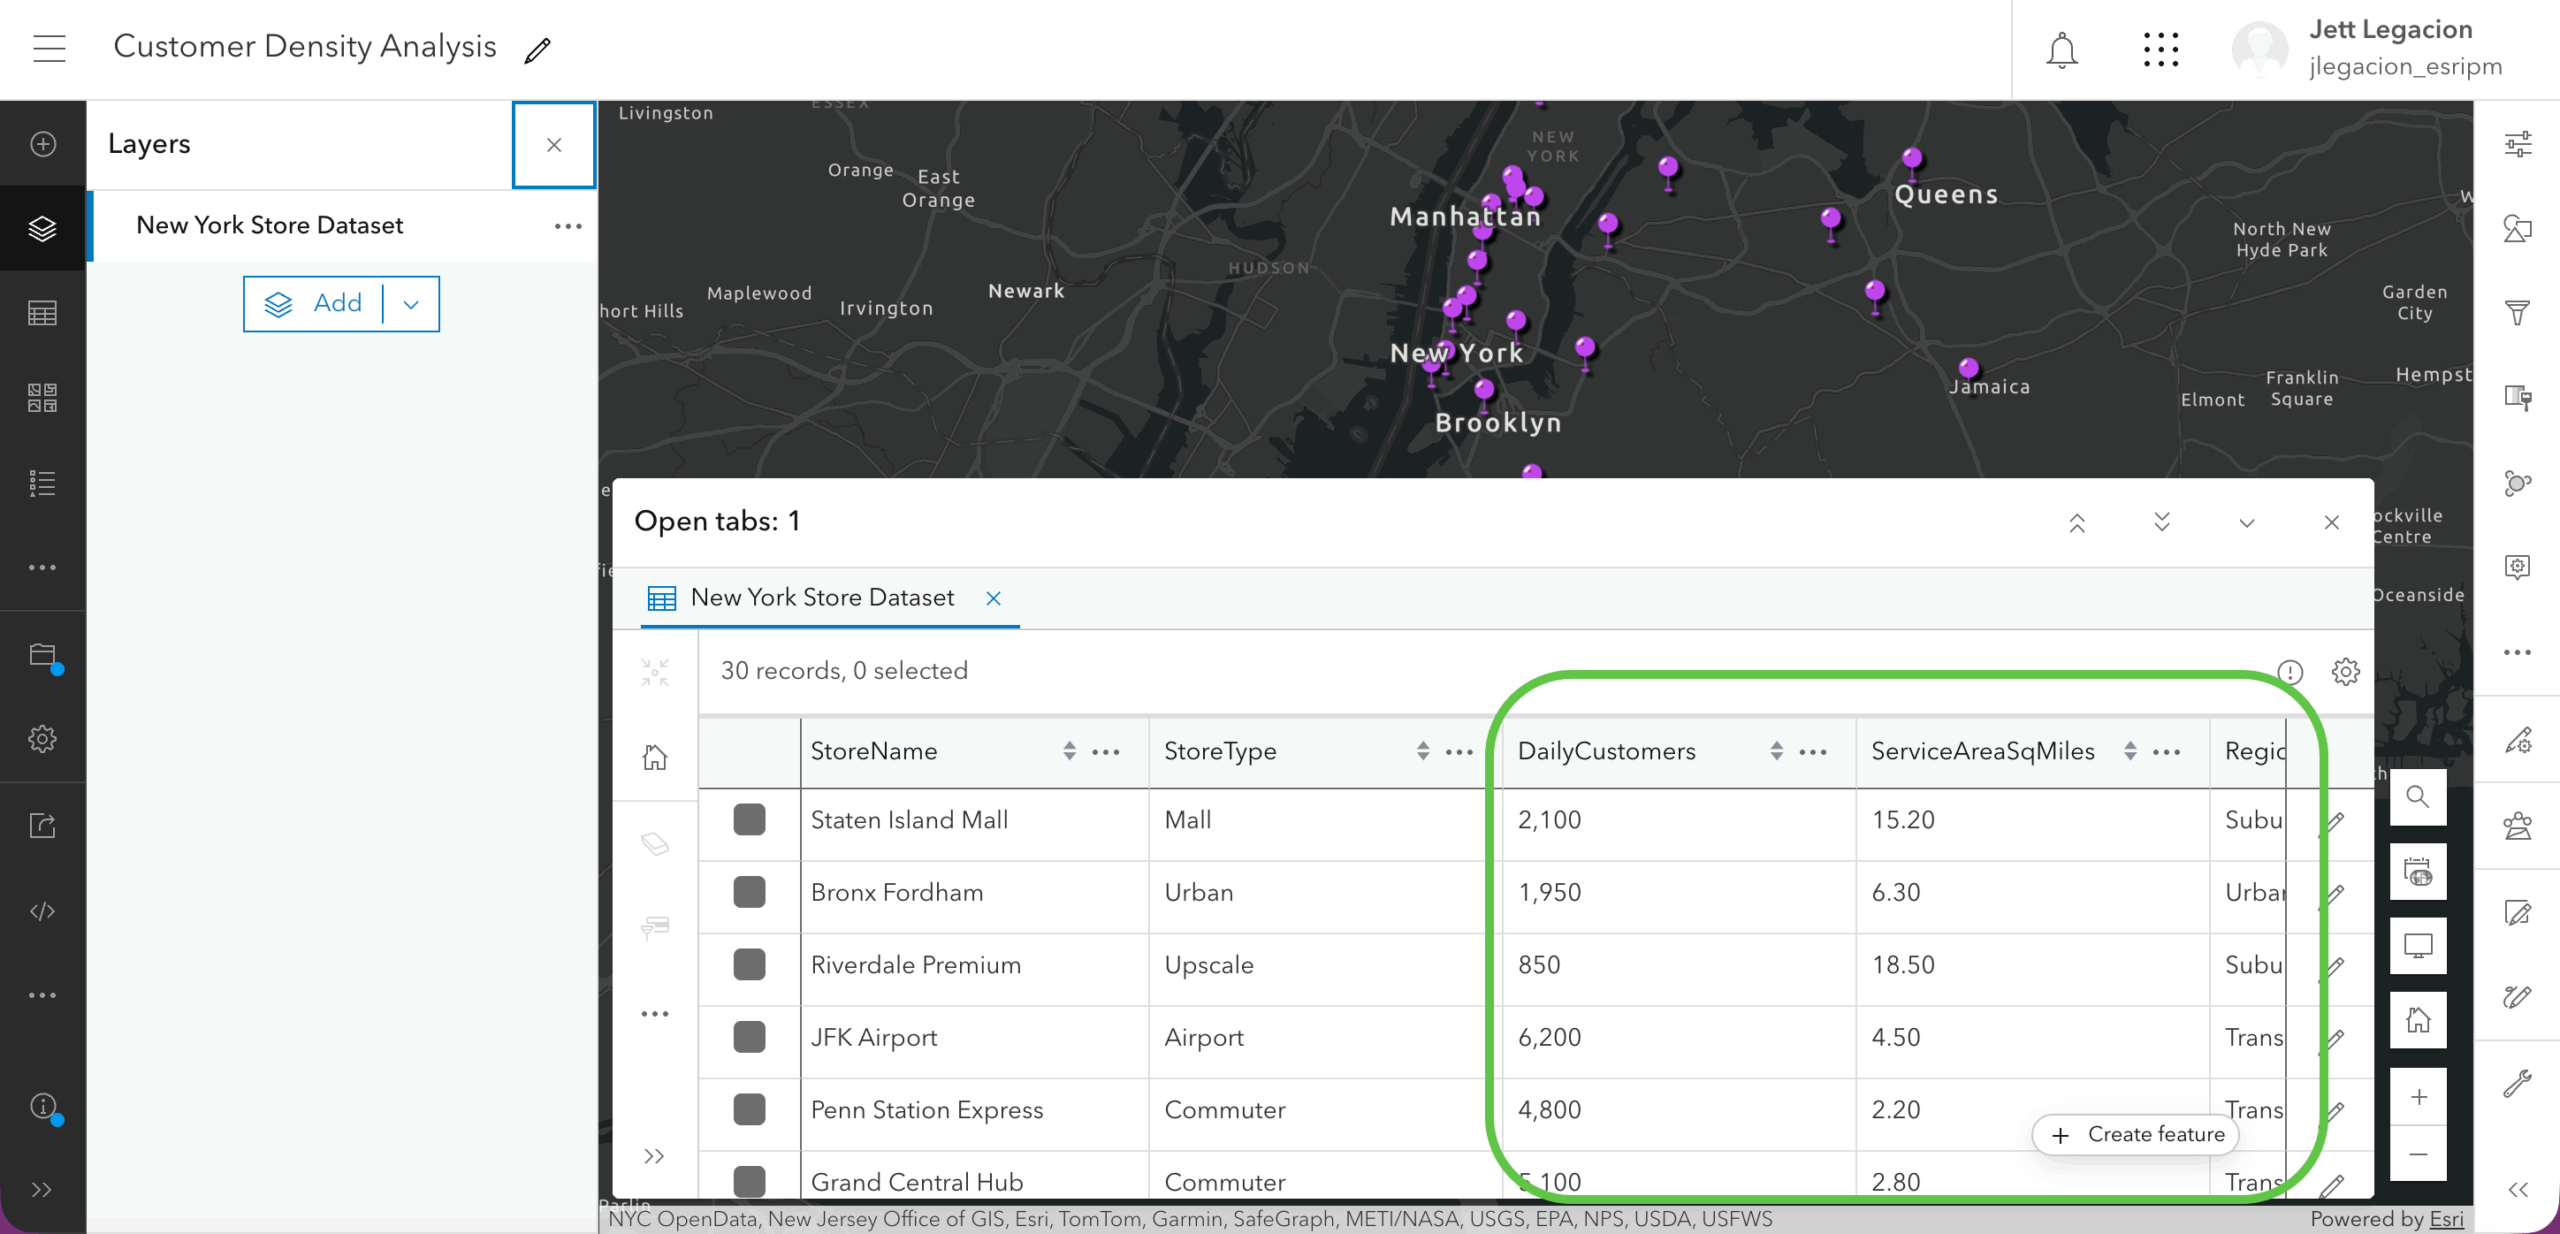
Example 2: Customer density analysis
Problem: You are a retail chain owner who wants to evaluate store performance by calculating customer density (customers per square mile) to determine which locations might be overcrowded or underutilized. This will help you decide where to open new locations or expand existing ones.
Approach: Use the assistant to generate Arcade expressions to help you calculate the customer densities of your units. You will also classify the results using a similar process to example 1.
In Map Viewer, you have data (fictional for demo purposes only) that showcases the number of customers a particular unit gets daily and how much area it covers. Let’s create a new field to first discover the customer density, and second determine if the unit is “overcrowded”, “optimal”, or “underutilized”.
Using the same process in example one, let’s create the new classification field.
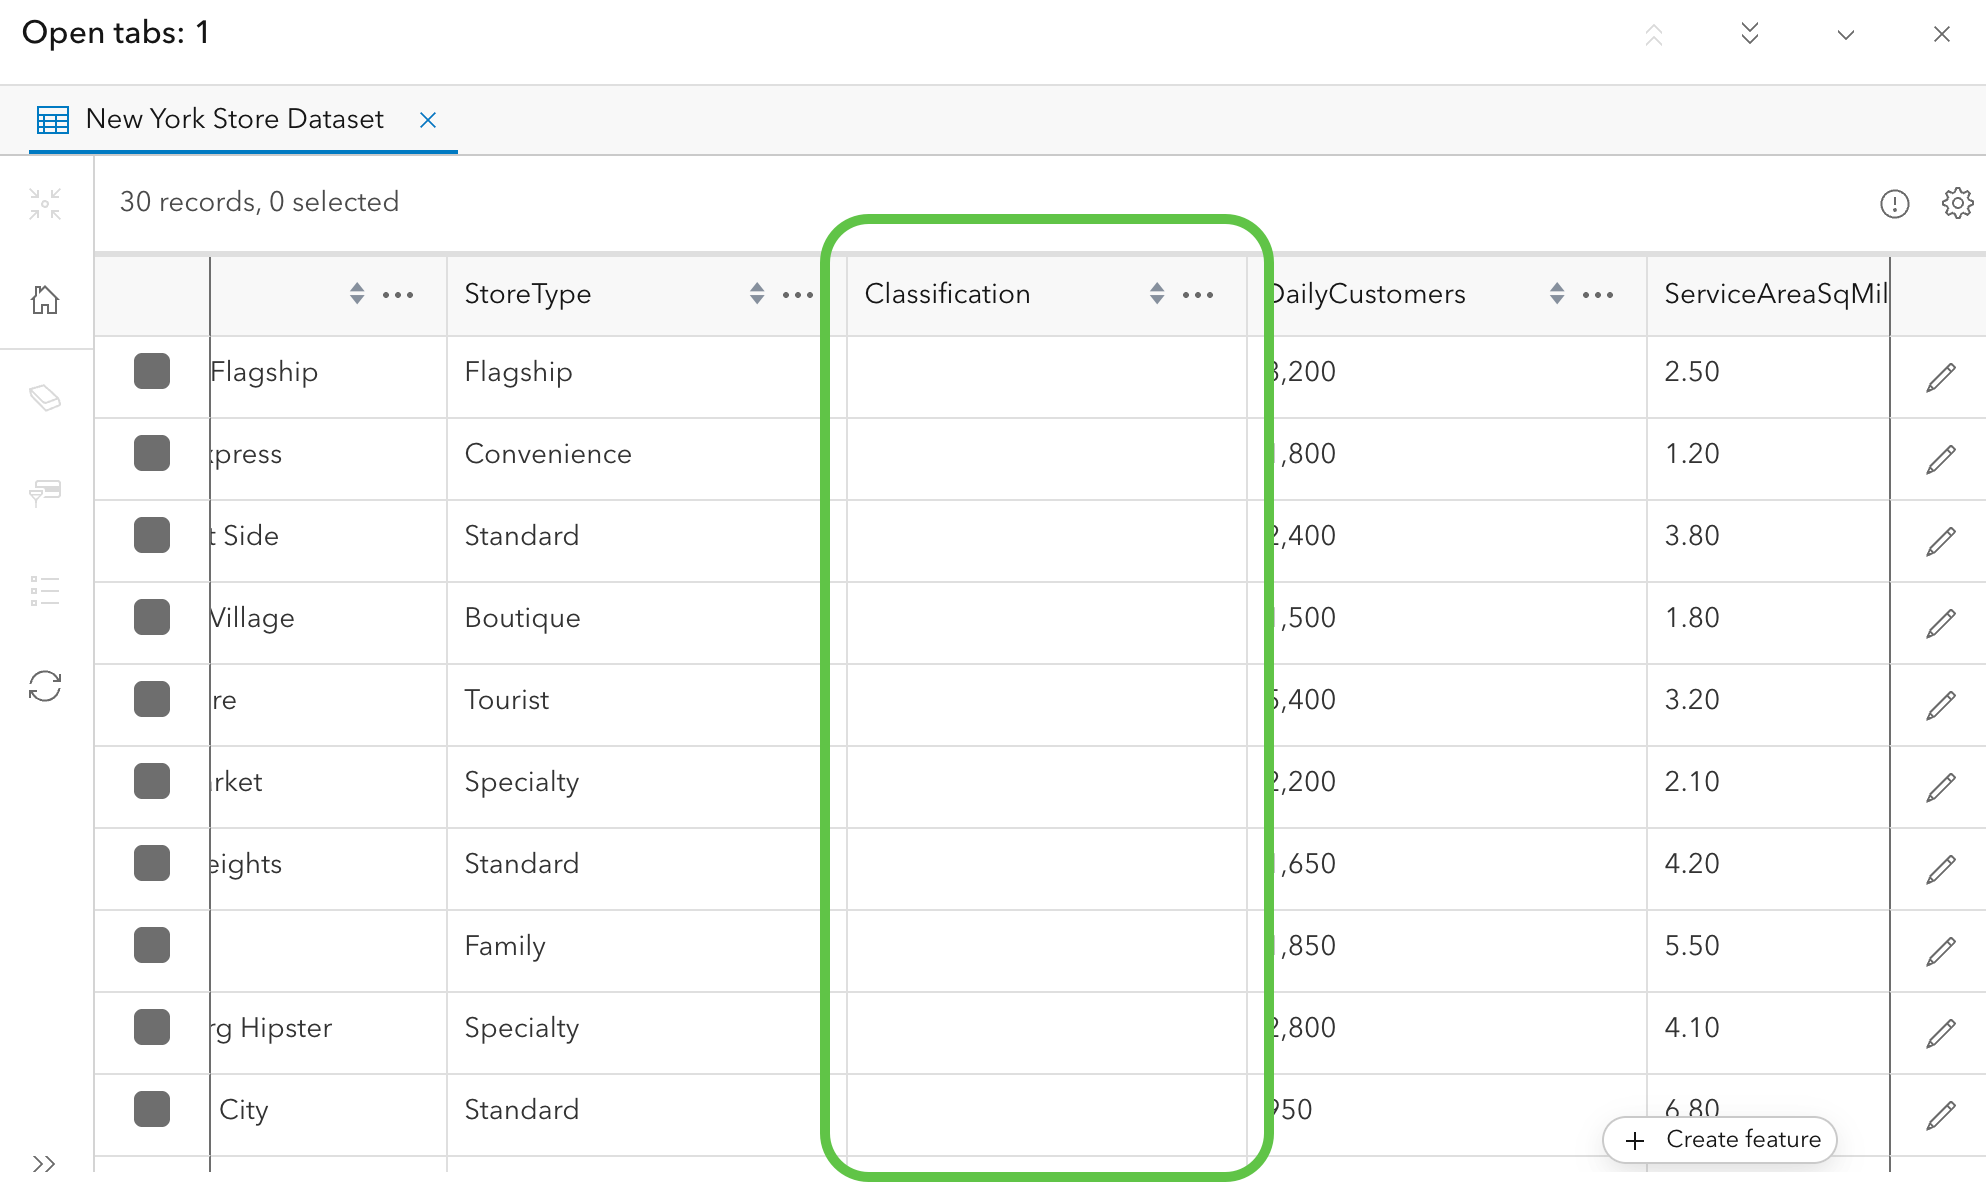
Open up “Calculate field” using the 3 horizontal dots in the “Classification” field, and access the assistant to enter the prompt.
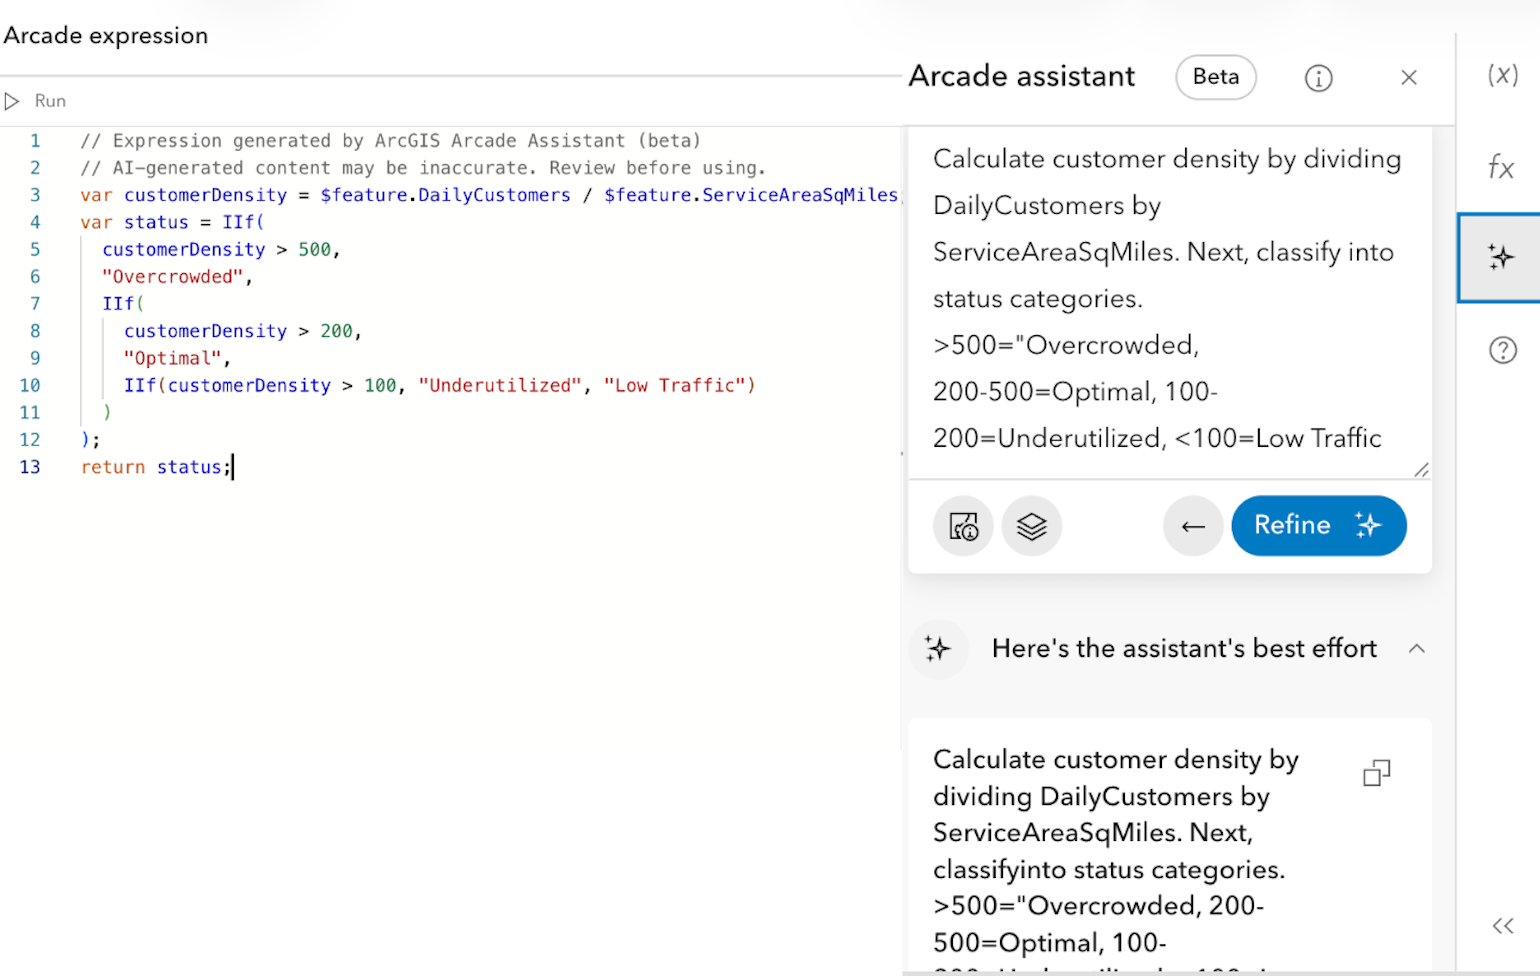
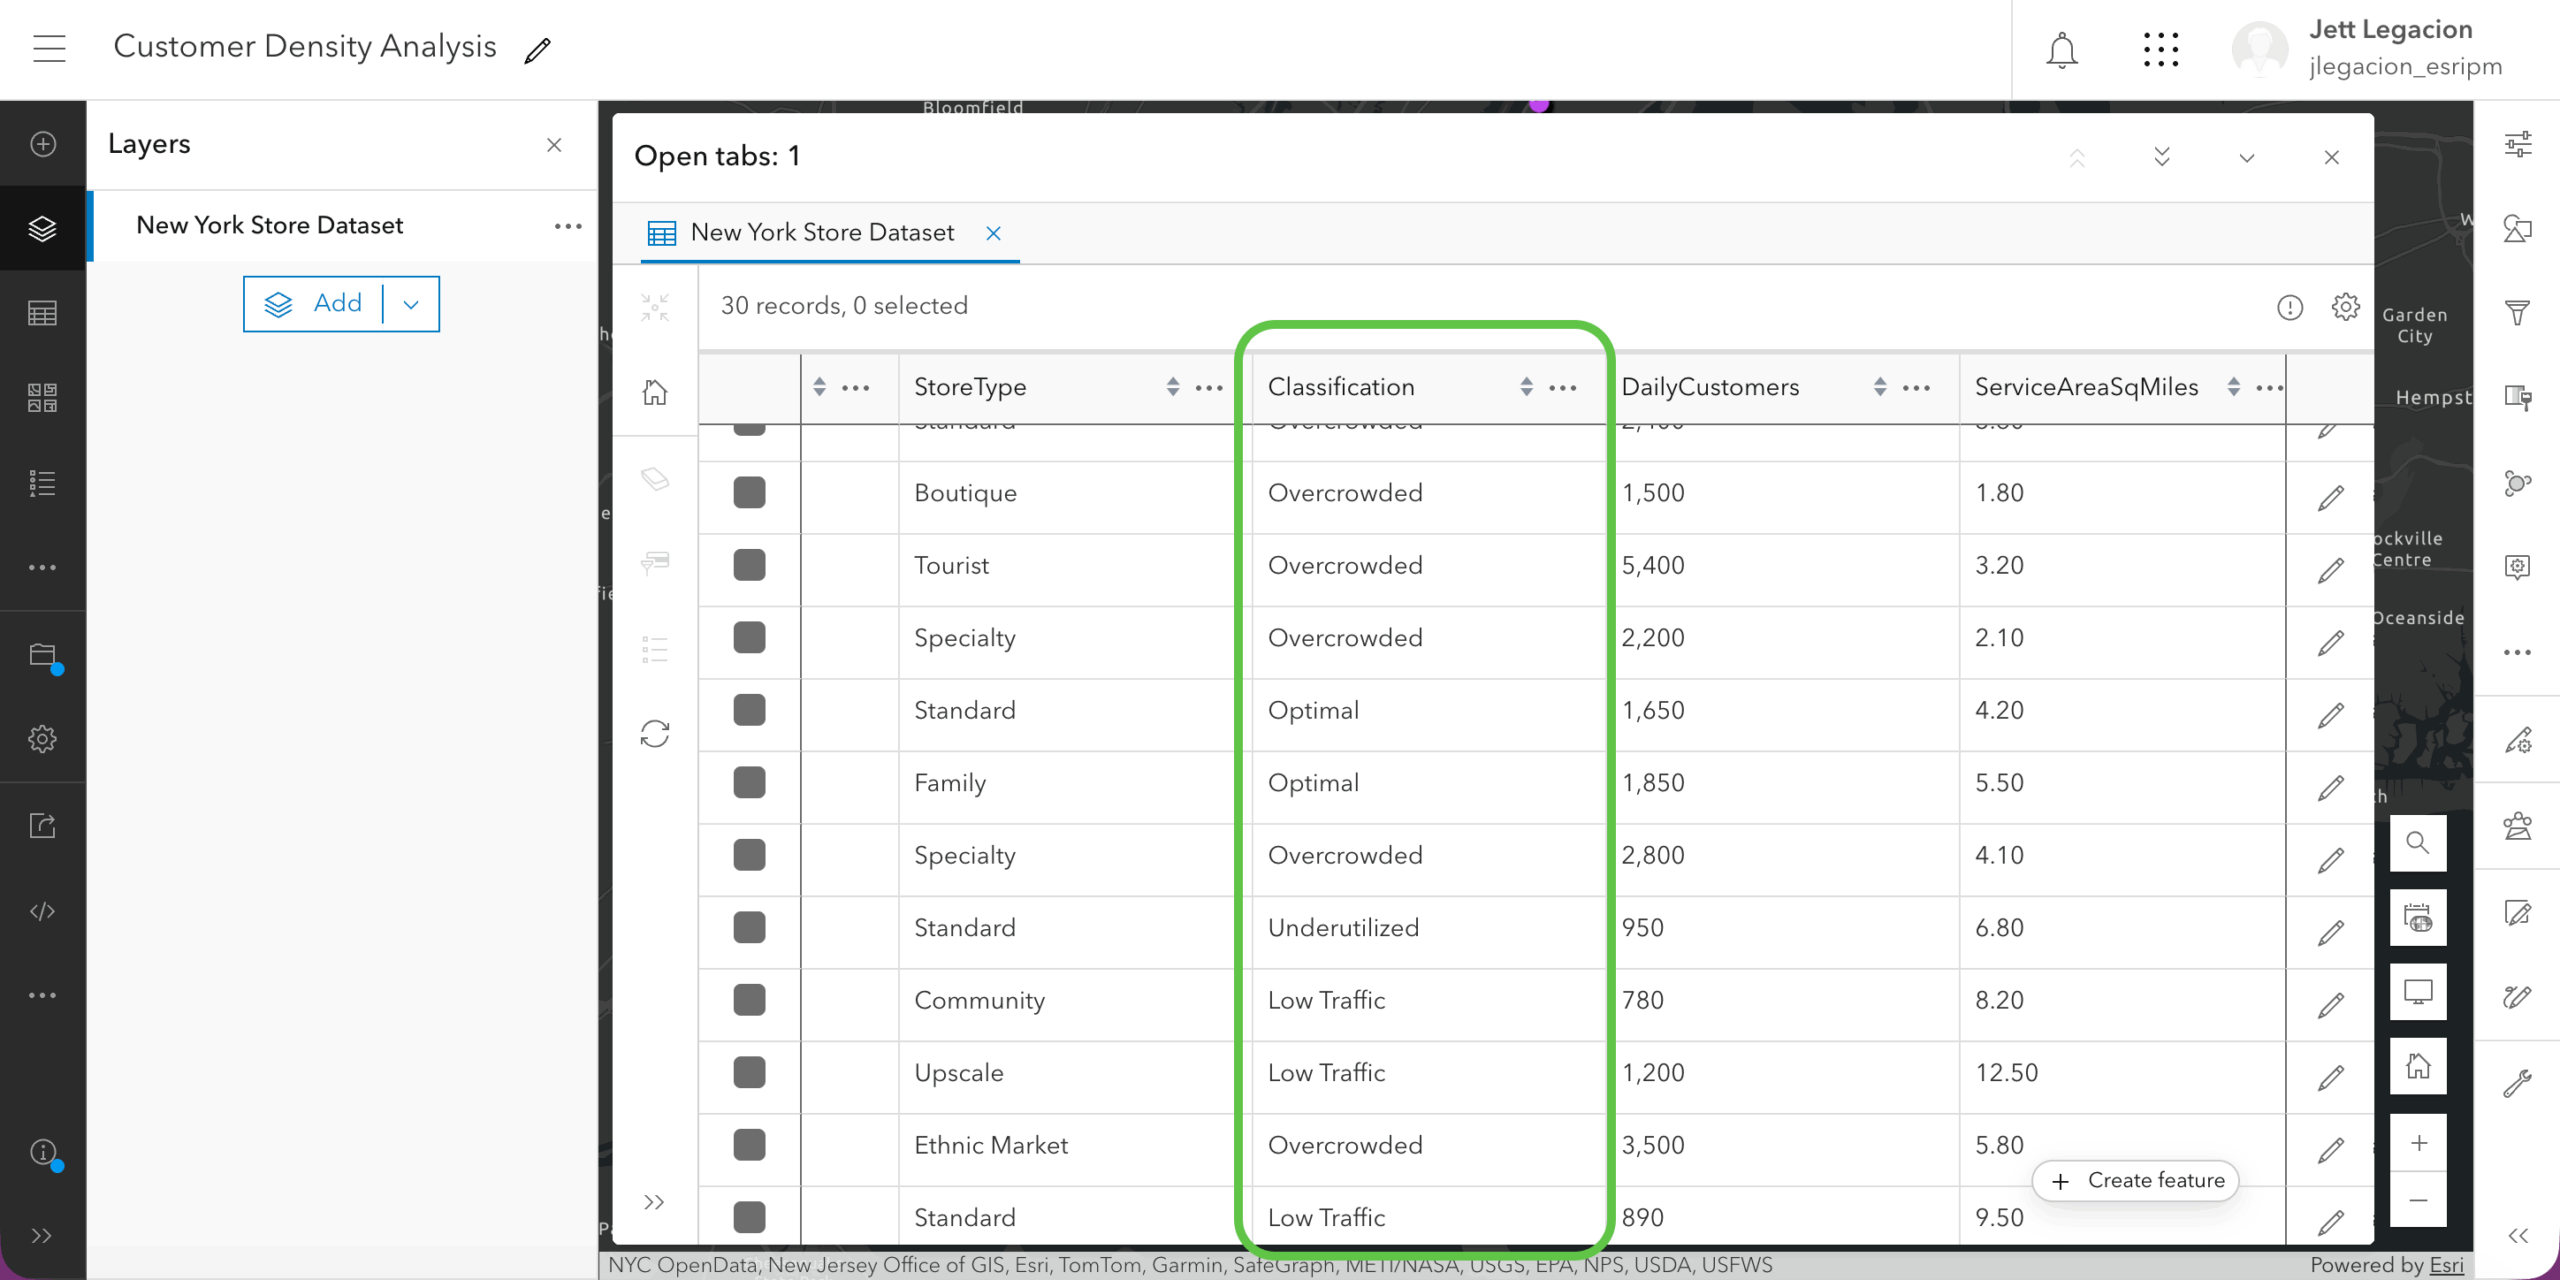
Again, click “Add to editor” to insert the code generated by the assistant, and click “Run calculation”. Now, your “Classification” field is populated with the correct calculated values.
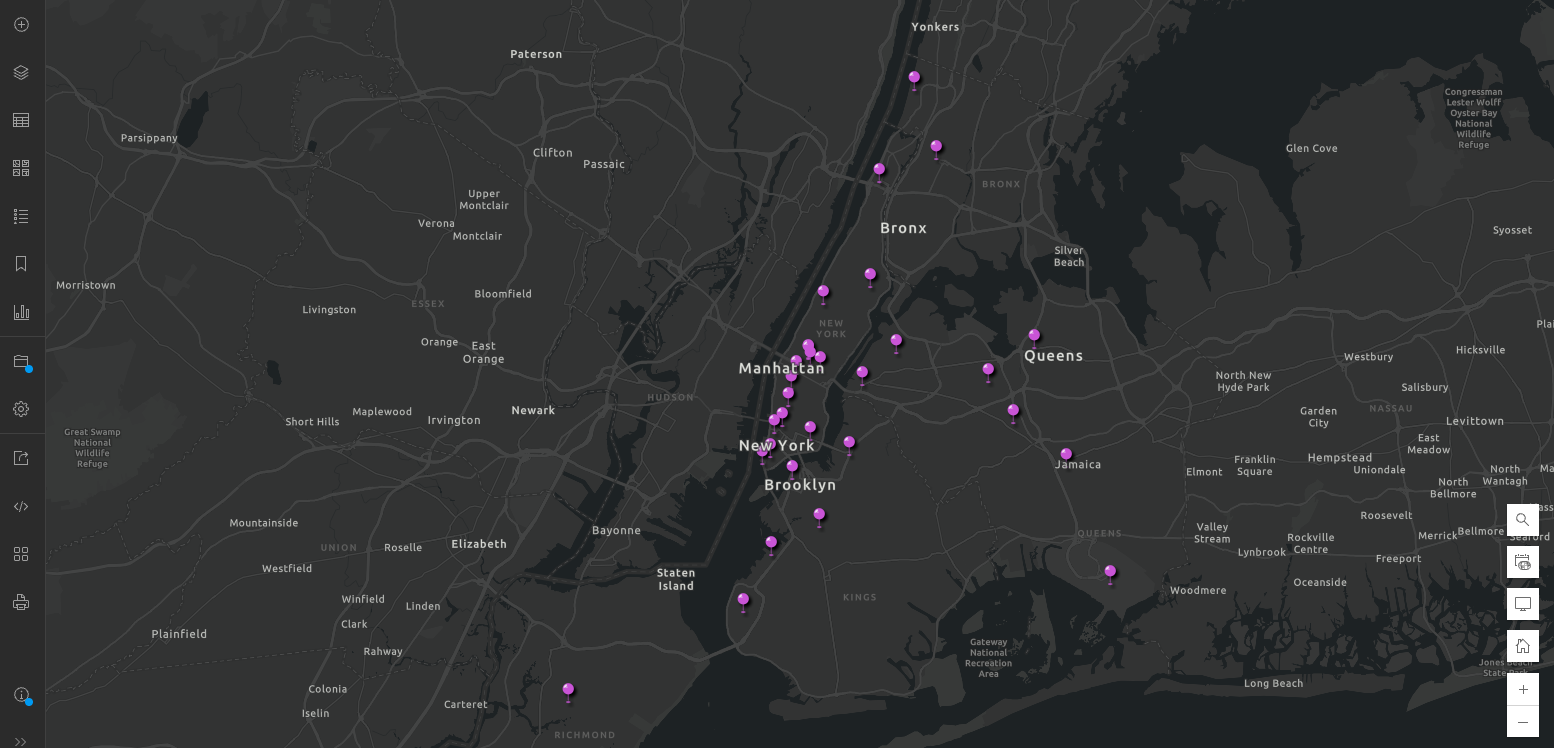
Similar to the process in example 1, you can symbolize the points based on the new calculated field.
Before
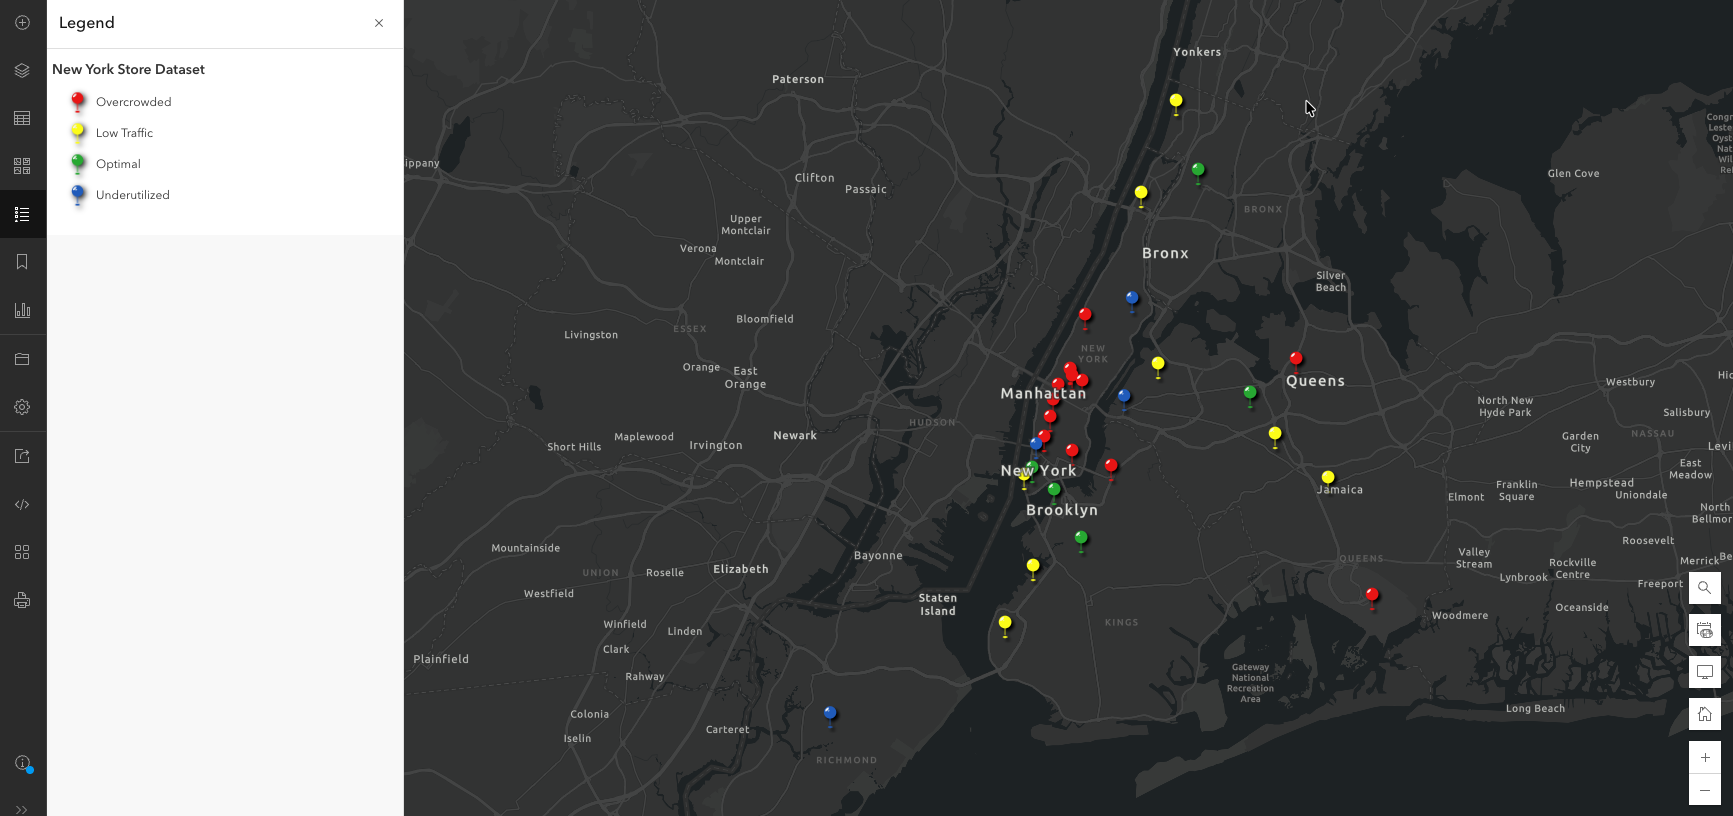
After
To recap:
We prompted the assistant to calculate the customer density for each of our units, and classified the values into categories that help us visually understand store performance.
Tying it all together
The Arcade Assistant makes field calculations more accessible by converting plain-language prompts into working Arcade expressions. Although we only demonstrated the assistant in Map Viewer, the Arcade assistant can also be accessed in Scene Viewer, ArcGIS Web Editor, and the data tab, with more availability coming. Its UI experience is the same throughout these different platforms and is used in the same way. As demonstrated in the population growth and customer density examples, you can use specific prompts to handle both calculations and classifications within the same workflow. The quality of your results depends on how clearly you describe your data fields and the logic you want to apply.
For more advanced field calculation techniques, Arcade assistant documentation, prompt writing tips, and information about AI assistants across ArcGIS, visit:


Article Discussion: