We’re excited to announce the beta release of the ArcGIS Arcade assistant.
The Arcade assistant uses artificial intelligence (AI) to generate ArcGIS Arcade expressions from instructions typed in natural language. This capability is currently only available in ArcGIS Online Map Viewer.
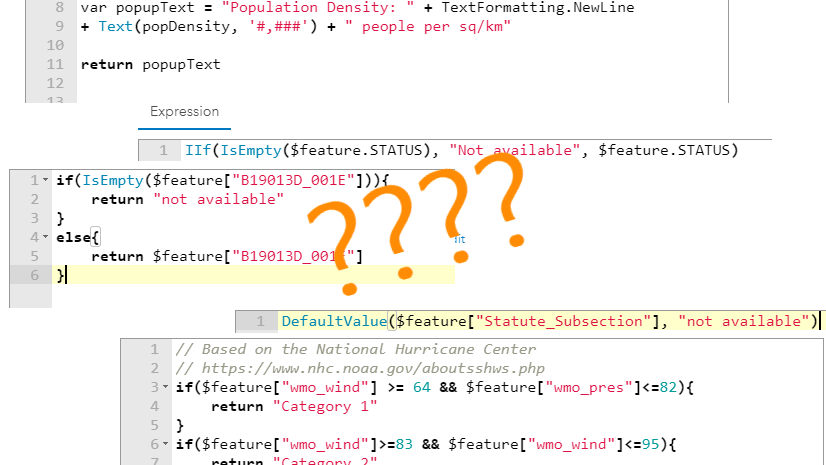
Arcade can be used to dynamically calculate on-the-fly attribute values or custom content in various mapping contexts. Examples include,
- Formatting a label’s text. (e.g. numbers to have commas, dates in various formats, or strings with replaced text and proper casing).
- Calculating a value for rendering, such as classifying attributes from multiple columns to a single category, or computing a number using various attributes as input to a formula.
- Calculating values in a popup or dynamically creating popup elements that render conditionally depending on a feature’s values.
The assistant can add value to your work in two ways:
- Efficiency. Writing expressions can take time. By providing commands in plain natural language, you avoid having to worry about complex logical statements, syntax quirks, and cryptic field names.
- Assisting beginners. While writing Arcade has been simplified thanks to the Arcade editor, there can still be a steep learning curve to becoming a confident Arcade author. The assistant flattens this curve by doing for the user what they may not be able to do for themselves.
Try it out!
To access the Arcade assistant, all of the following must be true.
- You must be signed in to an ArcGIS Online organizational account.
- AI assistants must be enabled in your organization.
- The organization must not opt out of beta features.
Once AI assistants are enabled in your organization, open a map in Map Viewer containing one or more feature layers, such as this map and sign into your organizational account. Open the Arcade Editor in one of the following configuration panels:
- Labeling
- Layer styling
- Popup attributes
- Popup elements
- Aggregation
Then look for the sparkle assistant icon in the right action bar of the editor.

Click “Proceed” in the assistant’s welcome dialog.

Now you can interact with the assistant.

Examples
Let’s take a look at a few examples of how you can build popup content with the help of the assistant. Each example uses this web map (don’t forget to sign in to your organization if you want to follow along). This web map contains a layer with educational attainment data at different levels.
Example 1: Popup calculations
I would like to include the percentage of the population with a college degree in the popup. However, this field doesn’t exist in the data. Arcade can calculate it for me with the fields available.
Prompt: Calculate the percentage of the population who completed at least a bachelor’s degree. Round the result to the nearest whole percentage. Summarize in a sentence where the critical values are royal blue and in bold. Return as a text element.

Once an answer is generated, I can choose to replace the existing expression with the result, or just add it to the editor at the location of the cursor.
It’s important to carefully review the response from the assistant. It’s not perfect and sometimes gets things wrong. So checking the result for performance issues and errors is an important part of the process.
The answer looked good, so I applied it to the popup. Here was the result.

Pretty good, right? However, as I clicked around, I saw something that bothered me.

A NaN value leaked through to the popup. This happens anytime Arcade returns a calculation that divided by zero. I definitely don’t want my users to see this. So I re-entered the expression editor, copied the previous question and added additional instructions to get a more desirable result.
Prompt: Calculate the percentage of the population who completed at least a bachelor’s degree. Round the result to the nearest whole percentage. Summarize in a sentence where the critical values are royal blue and in bold. If no one lives in the area, then return “Area with zero population” in italics. Return as a text element.

Now the result is much better.

Conditionally displaying content elements based on data values is one of the powerful capabilities Arcade has to offer that you cannot accomplish in the popup UI of Map Viewer.
This goes to show that while I was initially clear in my request to the assistant, I didn’t specify what to do if the user clicks a feature without data. Fortunately, you can go back to the assistant and provide it with some more detail.
Example 2: Popup tables
Arcade also allows me to create tables dynamically. The default popup in Map Viewer is often bloated with too many variables.

Even when you reduce the field list to just a few data values, you may want to dynamically sort the rows based on the highest data value, or for the cells to be highlighted based on attribute values. You can do this in Arcade and return the result as an HTML table.
However, building an HTML table from scratch can be tedious and prone to simple mistakes that are difficult to debug. Fortunately, the Arcade assistant does a good job of generating tables with dynamic capabilities.
Prompt: Create an html table listing education levels in order from highest education to lowest. Columns should include education level, and number of people who completed each level. Format numbers with commas. Highlight the row with the highest value.

The generated expression is a bit longer, but comes back with a correct result. To see the table rendered in the popup, you must click “Done” in the editor component.

The assistant did a great job. It did exactly as I specified. Despite that, I pictured the table looking nicer. So I need to clarify my expectations to the assistant. Again, I copied the previous prompt and built upon it with details on how I wanted the table styled.
Prompt: Create an html table listing education levels in order from highest education to lowest. Columns should include education level, and number of people who completed each level. Format numbers with commas. Highlight the row with the highest value in light blue. Format the table so the width fills the container and the border is light gray.
The result was much better. Open the map and click various features to see the dynamic nature of the table as different rows are highlighted.

Similar to the previous example, I can account for areas with no population by displaying other content.
Example 3: Popup with chart
Finally, I may want to add a chart to show a simplified aggregation of different education levels: completed college, completed high school, and didn’t complete high school. The following example demonstrates how I can do this.
Prompt: Create a media element with a column chart with the following values: number of people who completed a college degree (including associates degrees), number of people who completed high school (including some college and GED), and number of people who didn’t finish high school.
Note how I need to be specific in my request. There are several kinds of elements I could create in a popup, so specifying “media element with column chart” helps the assistant understand the type of configuration I need to generate. I also specified how I want it to aggregate data in different categories.
Again, I need to click “Done” in the editor to see the chart rendered in the popup.

While the assistant does well in these scenarios, it won’t necessarily have all the context it needs in generating exactly what you want. For example, I would like the chart colors to match my map colors as the same categories exist there. The assistant doesn’t include the entire web map configuration in its context, so I would need to provide those colors to the assistant myself, or modify the expression after the fact.
I hope you feel empowered to go down either path. If a task seems simple enough to accomplish by modifying the expression, then go for it! Upon opening the editor, I can easily see where color is specified in the expression. I just need to replace those with the values from the map.

How to write an effective prompt
Hopefully the examples provided you with some insight on how to effectively interact with the Arcade assistant. In summary, here are some guidelines for having a successful interaction with the assistant.
- Be clear and concise in your request. Being overly verbose can confuse the assistant.
- Avoid ambiguity and vague language. Specifying the kind of data and columns you want in a generated table is more effective than simply stating, “generate a table”.
- Using exact field names is not required, but provide sufficient detail.
- Understand the context Arcade is working with. In all cases available now, Arcade will only be aware of the fields in the layer in which the Arcade is being applied. The assistant won’t be aware of symbology values and properties, other expressions in the layer, specific data values in a field, or other layers in the map or portal (for now).
We need your feedback!
During the beta stage of this project (and beyond), your feedback will be crucial for helping us improve the experience for generating Arcade expressions from natural language. To submit feedback, use the thumbs up or thumbs down icon on the card displaying the assistant response to your question.
Then fill out the form and submit.

The more feedback, the better. We’d love to see your reactions both positive and negative. What worked well vs. what didn’t? Was your expectation met? Did the assistant get the answer wrong? What enhancements do you hope to see in the future? All of that information can be submitted in the form.
If you are completely satisfied with the answer and your experience, submit your feedback in the form anyway! All information you provide will help us improve the assistant even if it feels unnecessary.
Final thoughts
Keep in mind the Arcade assistant is still in its infancy, so it’s not perfect. It will occasionally generate incorrect responses, or return an error. If this happens, simply resubmit the question or rephrase the question. The assistant could be hung up on a specific term in the prompt that may need to be replaced.
Also, continuously evaluate your language. Consider how you would interact with a human if you asked an Arcade expert to write an expression for you. When coworkers interact, it often takes follow up questions, whiteboard sketches, and multiple attempts before one person fully understands the other. This communication dynamic is the same when interacting with AI assistants.
We’re excited to hear your feedback! If you have any questions, please reach out.


This is pretty neat, thank you for the blog, hopefully more blogs on this will also follow and also on how to use the Arcade AI assistant in Dashboard, Experience Builder and ArcGIS Pro.
Great to see this new feature and wondering if this will be available in other AGOL tools including both Field Maps Designer and QuickCapture Designer.
Hi,
I keep receiving this message: I’m having trouble with this request. Please try again by rephrasing or re-asking the question. Is this expected behavior?