Imagery in ArcGIS Online makes it easy to host, explore, analyze, and share imagery at scale-without standing up or maintaining your own infrastructure. From simple visualization to advanced analytics and deep learning, organizations can turn imagery into actionable insights using a secure, fully managed SaaS environment. Once imagery is organized and published, teams across the organization can use it in maps, apps, and analysis workflows to support faster, more informed decisions.
The February 2026 update builds on this foundation with enhancements that reduce friction in hyperspectral workflows, speed up analysis, and make it easier to extract meaning from complex imagery datasets.
This includes:
- Enhanced support for hyperspectral imagery
- New item type – Esri Spectral Library (*.esl) – You can now upload and share
.eslspectral library items directly in ArcGIS Online and make it accessible across the ArcGIS platform. - New raster types when creating hosted imagery – AVIRIS and EMIT raster types are now available for building richer, sensor‑specific hyperspectral imagery layers.
- Two new raster functions – Use Subset Bands to extract interested raster bands, Label Bad Bands to specify bad bands that can be avoided during downstream analysis.
- New item type – Esri Spectral Library (*.esl) – You can now upload and share
- Raster Analysis
- New Living Atlas layers with optimized raster analysis – Additional Living Atlas layers are now tuned for higher‑performance raster analysis.
- Two new tools:
- Geomorphon Landforms Raster Tool in Map Viewer – Automatically analyzes each cell in a surface raster to detect its pattern and classify terrain into common landform types for faster, data‑driven landscape interpretation.
- Summarize Categorical Raster Tool in Map Viewer – Quickly generate per category pixel counts directly for faster interpretation of classified imagery layers.
- New environment setting: Enable Accelerated Analysis (beta) – An new raster analysis environment setting enables high speed adaptive processing on select deep learning tools at no additional cost.
- One new raster function:
- Mosaic Rasters By Band Indices – Mosaics overlapping pixels of a collection of images based on criteria defined by their band indices.
- Other imagery enhancements
-
- Arcade support for imagery layer – Map Viewer now supports Arcade expressions in imagery layer pop-ups to dynamically display pixel data and image metadata.
-
- Oriented imagery enhancements
-
- Improved 3D Search in Oriented Imagery showing tall structures – More precise and relevant search results when filtering and locating oriented images in 3D scenes.
- Filtering by Time enabled in Oriented Imagery Viewer – Faster, cleaner review workflows for oriented imagery collections.
-

Enhanced support for hyperspectral imagery
New item type – Esri Spectral Library (.esl) Support
A new item type has been added to allow sharing and accessing Esri Spectral Library files across the ArcGIS platform. The Esri Spectral Library (.esl) stores sensor information, material name, and lists of wavelengths and values. This is required for some hyperspectral analysis workflows.
New raster types when creating hosted imagery
Hyperspectral raster types for both AVIRIS and EMIT imagery have been added to the list of raster types and can be used to create imagery layers. These raster types include preset processing templates and metadata.

Two new raster functions
Two new raster functions, Subset Bands and Label Bad Bands, have been added to Map Viewer. The Subset Bands raster function allows the extraction of a selection of raster bands using a range or list. This function can be used to reduce the number of raster bands to streamline analysis without using losing critical information. Adjacent hyperspectral imagery bands are often correlated, so removing the redundancy to focus on the most unique and informative bands. The Label Bad Bands raster function allows you to specify a set of bands or a range of bands as bad, which prevents them from being used in analysis tools and other functionality.
Raster analysis
New Living Atlas layers with optimized raster analysis
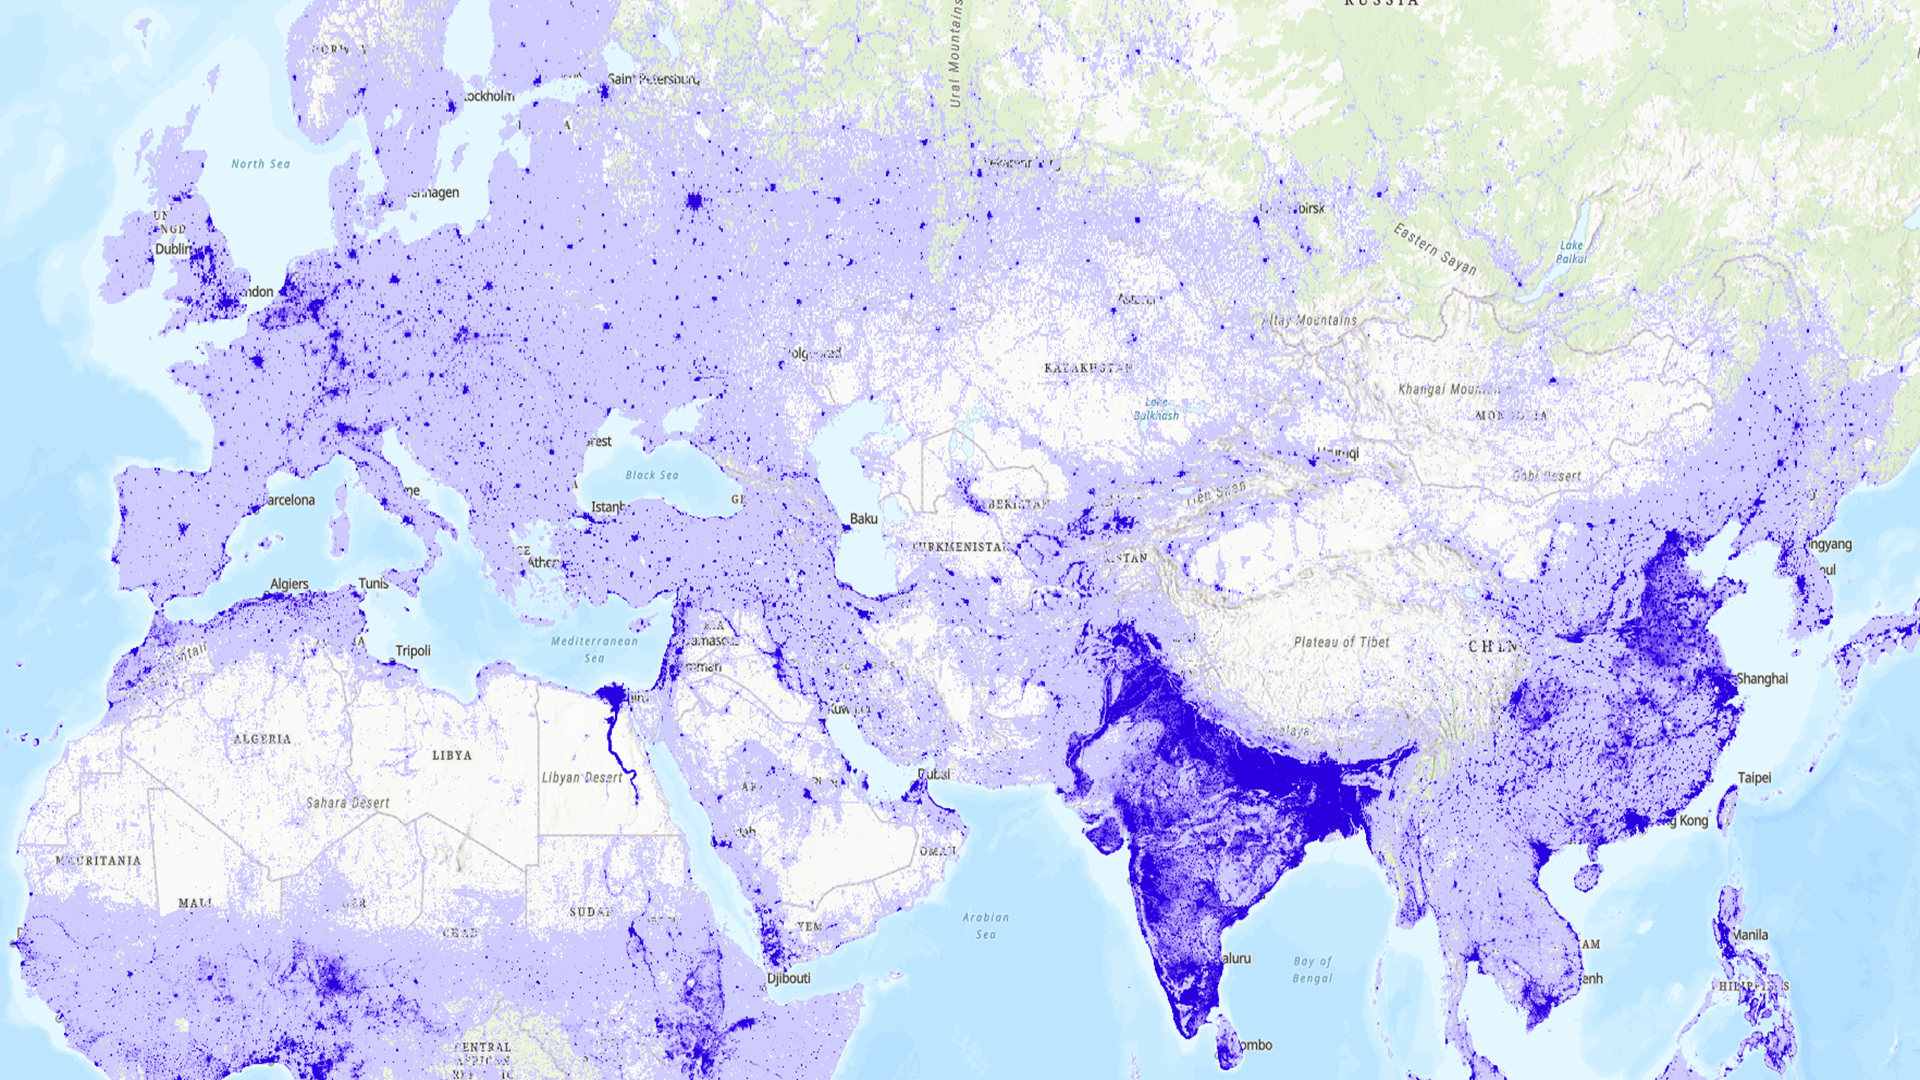
ArcGIS Living Atlas of the World has included a variety of global Earth observation imagery layers. These layers have empowered users across industries to perform powerful visualization and analysis directly within ArcGIS Online without the need to download large datasets. These imagery layers now include demographic thematic imagery layers and additional land cover thematic layers.
This optimization was introduced in a previous release on a select set of ArcGIS Living Atlas imagery layers, enabling support for significantly larger areas of analysis. This capability is currently available for imagery layers belonging to the Living Atlas Imagery Layers Optimized for Analysis group. For more information about the optimization and how to enable it, please refer to the blog, ArcGIS Living Atlas ready-to-use imagery layers for analysis.
Two new tools
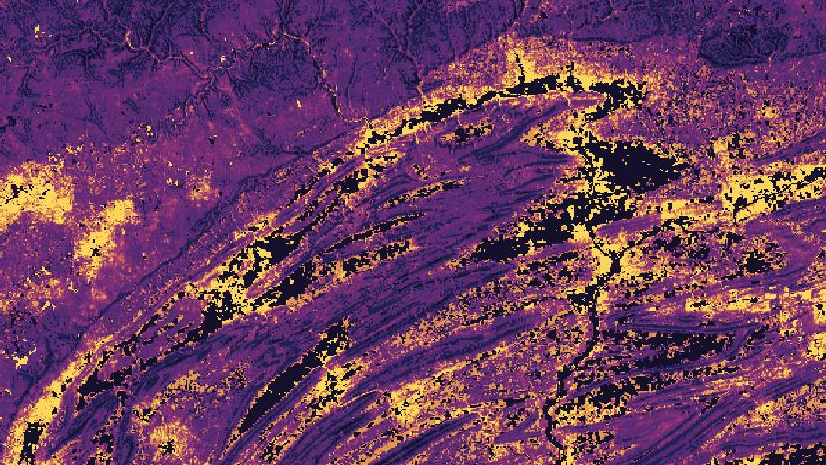
Geomorphon Landforms Raster Tool in Map Viewer
The Geomorphon Landforms raster analysis tool calculates the geomorphon pattern of each cell of an input surface raster and classifies them into common landform types, such as Peak, Valley, Ridge, Pit, among others. By classifying terrain into landforms, it’s possible to find out where mountain peaks are to optimize the placement of wildfire monitoring towers or identify where valleys are to understand where rivers and streams flow.

Summarize Categorical Raster Tool in Map Viewer
The Summarize Categorical Raster tool has been added to Map Viewer to create a table containing the pixel count for each category in each slice of a multidimensional categorical raster.
New environment setting: Enable Accelerated Analysis (beta)
A new environment setting has been added to Map Viewer that permits raster analysis to use the high-performance runtime backend, which can run large-scale raster analysis tasks more efficiently, the following tools are currently supported:
- Classify Pixels Using Deep Learning
- Detect Objects Using Deep Learning

You can enable this setting in the tool and in the environment settings in Map Viewer.
This feature is in beta. More analysis tools and raster functions will support this feature in future releases.

Other imagery enhancements
Arcade support for imagery layers
You can now use Arcade to work with pop-ups for imagery layers in Map Viewer.
After you add an imagery layer or tiled imagery layer to the map, access the Pop-ups panel and click Attribute expressions to build Arcade expressions, or click Add content to add an Arcade element to the pop-up.
You can write expressions that return values from pixel, image metadata, attributes for displaying in the pop-up. For example, you can perform on-the-fly unit conversion for temperature data from Celsius to Fahrenheit; you can grab the RGB values from clicked pixel to dynamically color the pop-up text that matches the pixel rendering.
$pixel variable allows you to get pixel values and other pixel-dependent information; $imageCollectionItem returns the image attributes in the image collection that is currently in the view. You can read more about this new feature through this blog. The latest ArcGIS Arcade release note for developers (version1.35) can also be found here.

Oriented imagery enhancements
Improved 3D Search in Oriented Imagery showing tall structures
Searching for oriented images can now use horizontal and vertical coordinates from where you click in a 3D scene—filtering and ranking imagery based on actual elevation and viewing angle—so you get photos that truly match the feature you selected. Whether you click a rooftop, the 20th floor of a building, or the top of a transmission tower, the viewer returns imagery that shows the proper location in 3D space rather than ground‑level shots behind it, giving you far more precise, relevant, and efficient results for elevated assets and complex environments.
Filtering by Time enabled in Oriented Imagery Viewer
We’ve made it easier to explore oriented images based on when they were captured. After enabling time on an oriented imagery layer, users can use the time slider to interactively filter images taken within a selected date range. When they click on the map to find images of a location, the viewer now honors those time settings, ensuring users can focus on imagery from the timeframe they care about. This enhancement is especially valuable for organizations that collect imagery of the same area over time. It streamlines the process of reviewing the latest captures, locating older imagery for comparison, and managing repeat collections in a single, organized place. Inspection workflows benefit from faster access to relevant images and a clearer view of change over time.

Ready to take the next step?
As an ArcGIS Online user, you can start exploring these new imagery capabilities today. The Product Team is interested in your thoughts and ideas as you explore. Influence the direction of future releases when you visit us and leave a comment via the Imagery in ArcGIS Online community on Esri Community.
Interested in seeing how others are using imagery in ArcGIS Online? Check out stories from Skytec, LLC, the City of Johns Creek, and the National Trust from the UK.
As an ArcGIS Online user, you can start exploring these new imagery capabilities today. Read blogs on the latest practices and tools such as, mapping mangrove dynamics with raster functions or mapping urban heat islands with Landsat imagery. Explore the tutorial gallery.


Article Discussion: