Have you ever considered where pockets of poverty exist and who is most affected? Unfortunately, global trends show that children are most impacted by poverty. Around the world 385 million children live in extreme poverty, and in 2013 the World Bank found that 19.5 percent of children in 89 countries lived in a household that survived on U.S. $1.90 per day per person or less.
Why is poverty such a critical issue? Because it relates to the overall well-being of a person. Those living in poverty may lack access to basic food, housing, and healthcare. Growing up without consistent nutrition, shelter, and safety can have long-lasting developmental impacts on children and can cause lifelong problems.
In 2015, the United Nations and world leaders developed a series of goals to improve situations for people, places and environments globally. In total, there are 17 of these Sustainable Development Goals that nations are striving to meet by 2035. This activity focuses on Goal 1: No Poverty and corresponding indicators that can be used to measure poverty. Check out the web app below, or open the app here.
Protecting Children with UN Sustainable Development Goals
A side-by-side comparison of data for goals 1.3.1 (proportion of children covered by social protections) and 8.7.1 (proportion of children engaged in economic activity). Data sourced from the UN Sustainable Goals open data portal.
Step 1: Visualize Global Poverty
Sustainable Development Goal 1, “No Poverty” is achieved when we “End poverty in all its forms everywhere,” and “should be understood as deprivation beyond the lack of income and resources to ensure a sustainable livelihood.”
Poverty is felt through hunger, malnutrition, limited access basic services and educational opportunities, social discrimination and exclusion. In order to secure a future of sustainable economic growth, it is essential for countries to promote economic equality.
1. Visit the UN Sustainable Development site.
Most of the data for the Sustainable Development Goals is curated and maintained by the UN Statistics Division. There are also countries that host their own open data portals featured on the data page.
2. Under Explore Spatially Referenced Data by Goal, click the first goal, No Poverty.

3. In the data catalog, search for 1.1.1.
4. Open the result titled Indicator 1.1.1: Proportion of population below the international poverty line (percent)
The data page displays information about the dataset. You can view a sample attribute table in the Data tab, or view chart visualizations by clicking on an attribute.
This data is made available courtesy of UNData.
5. Under About, click Create Webmap.

The layer opens in ArcGIS. Each country is symbolized with a graduated point symbol. The larger the circle, the higher percentage of the population lives in poverty. Some countries haven’t reported data, and are symbolized with a gray circle.
6. Sign in to your ArcGIS Organization.
Note: If you don’t have access to an ArcGIS organizational account, get a free ArcGIS trial.
7. Click Save, then Save As, and save a copy of the web map to your account.
The data appears as points, but to better visualize it, the data should be converted to polygons.
8. On the Change Style pane, click Done.
9. On the ribbon, click Add, then click Browse Living Atlas Layers. Search for “world countries” and add one of Esri’s World Countries layers by clicking the plus.
10. Click the back arrow to close the pane. In the Contents pane, hover over your World Countries layer and click the Perform Analysis button.

11. On the Perform Analysis pane, expand Summarize Data, then click Join Features.
12. Ensure that Number 1, Choose target layer, is set to World Countries.
13. For Choose layer to join to target layer, click the menu and choose the Indicator 1.1.1 layer.
14. For Select the type(s) of join, click Choose a spatial relationship and choose Intersects. For Choose join operation, make sure Join one to one is selected.

15. Name the layer World Poverty, uncheck the Use current map extent box, and click Run Analysis.
When the analysis finishes, the layer will be added to the map. By default, all the countries are shown in the same color. To see the data, you’ll change the symbology to show a choropleth map.
16. Uncheck all layers except for World Poverty, then hover over the World Poverty layer and click the Change Style button.
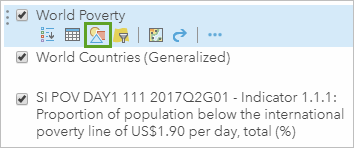
17. On the Change Style pane, expand the Choose an attribute to show menu and choose Value Latest Year.
Value Latest Year is the attribute that shows the latest reported value for any country that has reported data. The countries are symbolized with a default graduated color scheme that shows low values in a light yellow and high values in a dark blue. The light yellows blend in to the basemap, so before analyzing the map, you’ll change the symbology.
18. For Counts and Amounts (Color) click Options, then click Symbols. Choose a color ramp that stands out from the basemap. If necessary, click Invert to show the higher values in darker colors.

From a visual analysis, it appears that Europe, North America, and South America have the lowest levels of poverty. Several African countries report high levels of poverty, as do the Asian nations of Turkmenistan, Uzbekistan, and Papua New Guinea. Some countries, such as Libya and Saudi Arabia, haven’t reported data for this metric.
19. Click OK, then Done and save the map.
Step 2: Compare Child Poverty
Now that you’ve mapped global poverty, you’ll map reported data for percentage of children involved in economic activity. This indicator is measured with the goal of eradicating forced labor and ending modern slavery and use of child soldiers.
1. On the ribbon, click Add and choose Search for Layers.
2. Click My Content and choose ArcGIS Online, then search for 8.7.1 owner:unstats_admin.
3. Click the plus to add the result Indicator 8.7.1: Proportion of children engaged in economic activity, by sex and age (percent) to the map.
4. Hover over the World Poverty layer and click Perform Analysis.
5. Expand Summarize Data and choose Join Features. Enter the parameters as follows:
- Choose target layer: World Poverty
- Choose layer to join to target layer: Indicator 8.7.1
- Join type: Spatial relationship
- Join operation: one to one
- Result layer: Childhood Poverty
6. Uncheck Use current map extent and click Run Analysis.
7. Turn off all layers except for Childhood Poverty.
8. Hover over the Childhood Poverty layer and click Change Style.
9. Change the attribute to show to Value Latest Year 1.
Because you joined the datasets for global poverty and children in the workforce together, there will be many similar attribute names. Later, you’ll edit the names to make them more clear, but for now, remember that any attributes with a ‘1’ appended are from the economic labor layer.

Already, you can see that more countries have reported data for poverty rates. ArcGIS Online offers an easy way to visualize and compare relationships where data is present.
10. Click Done.
Step 3: Compare data to find patterns
1. Hover over the Childhood Poverty layer and click the ellipses. In the More Options menu, click Copy.
An identical layer is added to the map.
2. Turn off the original layer, then open the Change Style pane for the Childhood Poverty- copy
The layer currently shows Value Latest Year 1 from Indicator 8.7.1: Children engaged in economic activity. Now you’ll add the Value Latest Year attribute from Indicator 1.1.1: Global poverty for comparison.
3. Under Choose an attribute to show, click Add attribute and choose Value Latest Year.
4. Under Select a drawing style, scroll down to Relationship and click Select, then click Options.
5. Click Symbols, and choose the blue-pink-purple color palette. Click OK, then Done.
The relationship symbology style is a new way of creating bivariate maps that lets you easily compare two topics on a single map because only the countries with data for both indicators are shown. Because the two attributes being compared, Value Latest Year and Value Latest Year 1 can be confused, you’ll rename them.

6. Hover over the Childhood Poverty- copy layer and click the ellipses. In the More Options menu, click Rename and replace the default name with Global Childhood Poverty.
7. Click the ellipses again and click Configure Pop-up.
8. Under Pop-up Contents, click Configure Attributes.
9. In the Configure Attributes window, uncheck everything except for Country, Value Latest Year, and Value Latest Year 1.
10. In the Field Alias column, click Value Latest Year and type Global Poverty. Click Value Latest Year 1 and type Engaged in Economic Activity. In the Configure Pop-up pane, click OK.
Now when you click on a country, the pop-up shows only those three attributes.
11. At the top of the Contents pane, click Legend.

The Legend pane shows the symbology for all the layers that are turned on, and your changes will be reflected here. By comparing the legend to the map, you can see the two extremes of the spectrum: first, that countries shaded purple have a high poverty rate, and large proportions of children working to support themselves or their families. Conversely, countries in light pink have low poverty rates and small proportions of children at work. In between there are countries like India and Turkmenistan with relatively low poverty rates but high proportions of children working, and countries like Mongolia and Serbia with relatively high poverty rates, but small proportions of children contributing to the economy.
If you toggle between layers in the Contents pane, the legend will help you perform more visual analysis on the countries. If you were looking at ways to base policy on this information, you could use the maps you created to answer the following questions:
Questions for Consideration
SDG 1: No Poverty
- Which countries have the highest poverty rates?
- Where does it appear that children are protected from labor?
- Where should international efforts to alleviate poverty be targeted?
- Within individual countries, what are some ways of improving the situation for children facing challenges associated with poverty?
Questions pertaining to both indicators
- Where do you see overlaps in patterns between the two maps that you have created for each indicator?
- Where are the most affected areas that efforts should be focused toward helping improve the condition for children?
- What sorts of place-based policies could be designed to help improve the conditions for children?
Next steps: Share links to story map
You now have three maps showing UN Sustainable Development Goals data. With a little extra work, there are several ways you can share these.
- Embed the maps in a Story Map using Get Started with Story Maps.
- Create a Web App, like in Get Started with ArcGIS Online or Fight Child Poverty with Demographic Analysis.

Commenting is not enabled for this article.