Segmentation is like turning on a spotlight in a dark room. It reveals the hidden patterns in how people live, work, and engage with the world around them based on where they are and who they are. Geodemographic segmentation blends geography with demographics to paint a rich portrait of communities.
At its core, segmentation helps us answer: Who lives here? What do they care about? And how can we connect with them more meaningfully?
There are two primary building blocks of segmentation data: geographic data and demographic data.
- Geographic data tells us where people live based on characteristics like housing density, urbanicity, and building types.
- Demographic data provides insight into who lives there using indicators such as age, gender, family structure, education, and income.
This approach has evolved over decades, shaped by the growing need for precision in marketing, planning, and public service. ArcGIS Tapestry’s June 2025 update is the result of these efforts. See ArcGIS Tapestry methodology for more information on how Esri creates ArcGIS Tapestry.
Why does segmentation matter?
There are many uses for segmentation. A key purpose is targeted marketing, where businesses direct their efforts toward specific customer groups that share certain traits relevant to their products or services. Segmentation isn’t just for marketers, it’s a tool for decision-makers across industries. Whether you’re launching a product, planning a park, or designing a public health campaign, segmentation helps you:
- Target the right audience
- Understand community needs
- Tailor messages and services
- Visualize behavior across space
From real estate to recreation, healthcare to humanitarian work, segmentation data helps you see the people behind the places.
Segmentation helps you ask and answer critical questions to get to know your audience:
- Who are the people in this area?
- What challenges do they face?
- How do they engage with the world around them?
It’s about more than data points. It’s about stories—the rhythms of daily life, what drives people, and their habits.

How did segmentation evolve?
Before segmentation became a marketing mainstay, businesses relied on mass production and broad messaging, hoping one product could appeal to everyone. But as early as the 1800s, thinkers began to challenge that idea. One of the first was Charles Booth, a social reformer who mapped London’s neighborhoods using color-coded classifications to reveal patterns of poverty and wealth. His work laid the foundation for understanding how geography and social conditions intersect.
In 1956, Wendell R. Smith formally introduced the term market segmentation, arguing that businesses needed to recognize and respond to the diverse needs of consumers. His ideas were echoed and expanded by marketing legends like W. Edwards Deming, Philip Kotler, Sergio Zyman, and David Aaker, who emphasized the importance of understanding behavior in a complex marketplace.
A major leap came from geography professor Robert Webber, who developed A Classification of Residential Neighborhoods (ACORN) system in the UK to classify neighborhoods using Census data. Alongside Ken Baker, he adapted ACORN for the U.S., layering in survey data and clustering techniques to create a more behaviorally driven system. To make it more relatable, segments were given names and visuals, turning raw data into intuitive insights.
In 2002, Esri acquired CACI Marketing Systems and rebranded the U.S. version of ACORN to Community Tapestry, eventually launching the next-generation Tapestry Segmentation in 2014. Today, ArcGIS Tapestry represents over 50 years of innovation, offering a multidimensional view of American neighborhoods. ArcGIS Tapestry reveals not just where people live, but how they live, what they value, and how they engage with the world. The June 2025 release of ArcGIS Tapestry marks the most recent update.

What makes ArcGIS Tapestry unique?
ArcGIS Tapestry doesn’t just categorize data, it enriches the story you tell. It weaves together dozens of demographic threads to reveal the full fabric of U.S. communities. People with similar lifestyles tend to cluster together, and Tapestry captures those patterns with remarkable clarity.
Each segment is a story: where people live, how they live, what they value, and how they spend their time and money. It’s like zooming out on a quilt and suddenly seeing the full design.

A tale of two households
Imagine two neighborhoods: Household A and Household B. On paper, they look nearly identical: similar median incomes, similar average ages. If you’re scouting new trade areas for expansion, both might seem like equally good candidate households.
To demonstrate, let’s compare the typical household in two neighborhoods using selected demographic variables that distinguish each.

Household “A” falls into Segment G2, the Up and Coming Families segment, which consists of young families living in newer suburban homes. These households are larger, often with kids and pets, and their spending reflects that. They’re investing in their homes, buying smart tech, and filling weekends with family outings to zoos, aquariums, and movie theaters. They commute longer distances, often beyond their county lines, and prioritize comfort and connection in their daily lives.

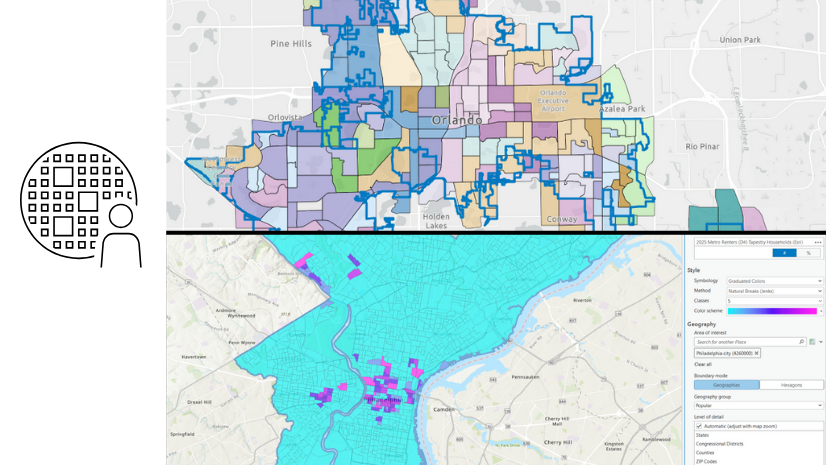
Household “B”, on the other hand, is in Segment D4, the Metro Renters segment, which is primarily highly educated, mobile young professionals living in dense urban cores. These are mostly non-family households, often singles or roommates, who rent apartments and rely on public transit, biking, or rideshares. They’re digital natives who use tech for everything from banking to shopping to reading the news. Their spending leans toward health, aesthetics, and sustainability—think organic groceries, sleek home decor, and eco-conscious choices.
So, while age and income offer a surface-level snapshot, they don’t tell the full story. Tapestry segmentation reveals the deeper layers, including how people live, what they value, and how they engage with the world around them. It’s this multidimensional view that turns data into insight and insight into smarter decisions.
The art of insight
Segmentation tools like ArcGIS Tapestry enhance understanding of communities and support data-driven decision-making. In a diverse marketplace, segmentation allows businesses to focus on consumers whose needs align with their offerings.
ArcGIS Tapestry is more than a dataset, it’s a lens. A way to see the invisible patterns that shape our world. Whether you’re a business leader, urban planner, nonprofit strategist, or curious explorer, segmentation gives you the power to understand people in place.
And like any great tapestry, the beauty lies in the details.
Get started using ArcGIS Tapestry
Be part of history and start your ArcGIS Tapestry exploration today. Check out some of the following resources to learn more and try out some workflows on your own.


Article Discussion: