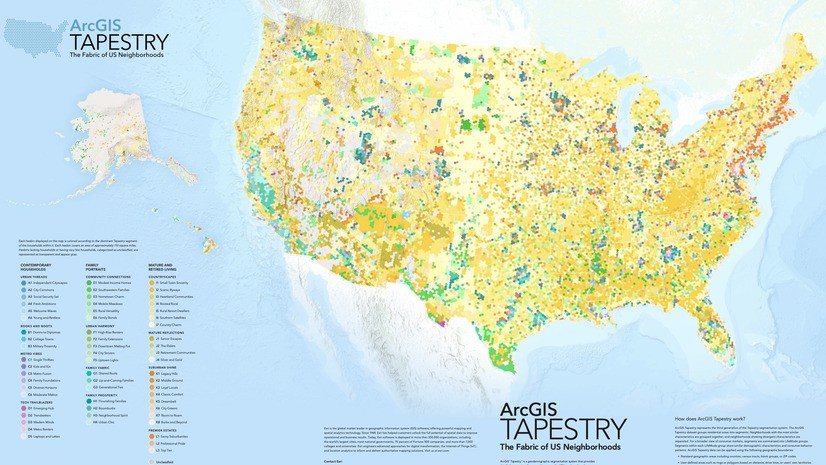
ArcGIS Tapestry data contains detailed summaries of communities across the United States. This dataset groups residential areas into segments based on shared demographic, socioeconomic, and lifestyle characteristics. Neighborhoods with the most similar characteristics are grouped together, and neighborhoods showing divergent characteristics are separated. Tapestry data can be used to understand a community’s complexity. Each segment provides insight into patterns at the neighborhood and community level and can be used to compare segments and groups.
You can use ArcGIS Tapestry data in ArcGIS Pro, ArcGIS Online, and ArcGIS Location Platform. Some examples include:
| Product | Workflow example | Use case example |
| ArcGIS Pro | Infographics:
From the Map tab, in the Inquiry group, click Infographics to interactively view infographic templates. |
Run the Dominant Tapestry infographic to view the dominant segment for your site. |
| ArcGIS Pro
|
Enrich tool:
From the Analysis tab, in the Geoprocessing group, click Tools and search for Enrich and select Enrich (Analysis Tools). This tool adds demographic and landscape facts about the people and places that surround or are inside data locations |
Use customer-derived areas to perform target marketing, using Tapestry data to classify your target customers. |
| ArcGIS Online | Enrich Layer tool:
In Map Viewer, click Analysis and click Tools. In the search field, type Enrich and select the Enrich Layer tool. This tool supplements point, line, and polygon features with demographic and landscape data. |
Enrich a web map with Tapestry data to identify vulnerable communities. |
| ArcGIS Location Platform | Reproduce the Enrich Layer tool steps in Map Viewer. | Enrich a web map with Tapestry data to identify vulnerable communities. |
In this blog article, you’ll walk through using Tapestry data in ArcGIS Pro and ArcGIS Online in the following scenarios:
- Using the Enrich tool in ArcGIS Pro, let’s map customer spending by Tapestry segment in Denver, Colorado, to create a digital marketing campaign.
- Using the Enrich Layer tool in Map Viewer, let’s analyze vulnerable communities to create a disaster preparedness strategy in New Orleans. This workflow is also reproducible using ArcGIS Location Platform.
Using ArcGIS Tapestry data in ArcGIS Pro
You can use ArcGIS Tapestry data in ArcGIS Pro, specifically in the Enrich tool. This tool enriches data by adding demographic and landscape facts about the people and places that surround or are inside data locations.
You’ll use the Enrich tool in ArcGIS Pro to map the Dominant Tapestry Segment for census tracts. Then, you can zoom in to Denver, Colorado, and analyze consumer spending by segment.
Start your project
First, open ArcGIS Pro and create a new project or open one of your existing projects. Click the Analysis tab and click Tools. Search for Enrich and select the Enrich tool.

Add a web map
Click Input Features and browse to the Living Atlas option. Let’s use the Census Tracts feature layer. This feature layer was created by the Esri account Esri _Federal_Data, which registers content of interest from the U.S. federal data community. Either scroll to the Census Tracts result or enter a search term to find the feature layer.

Select variables
In the Variables section, click the Add button to browse the data browser. Enter tapestry in the search field and select the 2025 Dominant Tapestry Segment (Esri) result. Let’s also add a consumer spending variable to the analysis. Click Categories and select the Spending category and the Spending Total subcategory. Select the 2025 Total Expenditures (Consumer Spending) variable list using the value’s averages.

Now that the variables are selected, click OK and click Run to perform the analysis.

Style the map
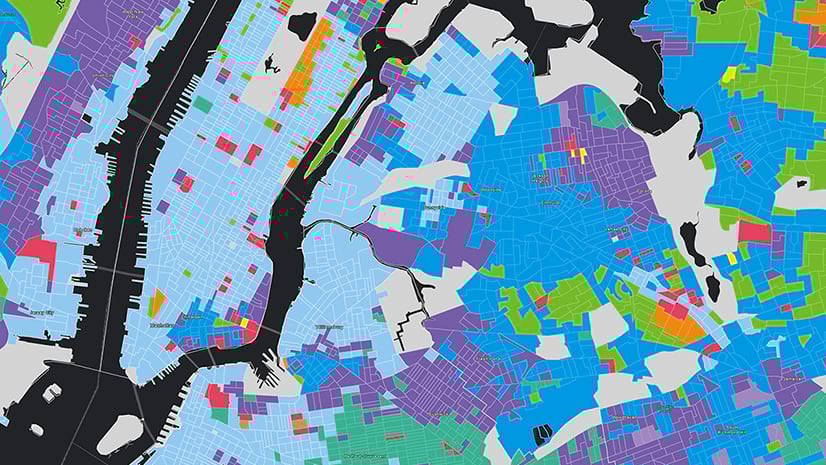
To distinguish between Tapestry segments, let’s style the map. Click the Feature Layer tab on the ribbon and click Symbology. Select the Unique Values style. Since you want to look at the distribution of Tapestry segments, for Field 1, select the 2025 Dominant Tapestry Segment variable. The map automatically updates to use color-coding for each segment.

Zooming to Denver, Colorado, we can see a variety of dominant segments.

Click on a site to view the underlying tabulated data in a pop-up.

Analyze the results
From this analysis, you can assess the different customers in Denver, Colorado, and how much they typically spend on retail goods. The digital marketing campaign can be customized so that it has the best engagement for each targeted segment.
Using ArcGIS Tapestry data in ArcGIS Online
You can use ArcGIS Tapestry data in ArcGIS Online, specifically in the Enrich Layer tool using Map Viewer. The Enrich Layer tool supplements point, line, and polygon features with demographic and landscape data.
An example of using the Enrich Layer tool in Map Viewer with Tapestry data is for policymakers to identify vulnerable communities to assess where resources need to be allocated during a disaster.
Twenty years after Hurricane Katrina devastated this community, recovery is still ongoing, and it is of the utmost importance to mitigate future risk and protect the residents.
In this scenario, you will add an ArcGIS Living Atlas web map of census tracts, filtering to look at Louisiana. Then you can add Tapestry and car ownership data, style the map to highlight patterns in the Dominant Tapestry LifeMode group and zoom in to the Ninth Ward neighborhood of New Orleans.
Add a web map
You’ll start by adding an ArcGIS Living Atlas web map. Click Layers and change the content type to Living Atlas. Let’s use the USA Census Tract Boundaries feature layer. Enter census tracts and select the USA Census Tract Boundaries result. Click + Add to add it to the map.

Filter the map
Now that the web map is added, filter the results using a condition to mitigate the credit consumption. Click Filter and use the following condition:
- For the field name, choose State Abbreviation.
- For the operator, choose is.
- For the value, choose LA.
Now the map only displays census tracts in Louisiana.

Enrich the layer
It’s finally time to use the Enrich Layer tool to add data! Click Analysis and click Tools. In the search field, type Enrich and select the Enrich Layer tool. Do the following to set up your enriched layer:
- In the Features to enrich section, for Input features, select the USA Census Tract Boundaries layer.
- In the Enrichment data section, click + Add variable. In the data browser, add the following variables:
- 2025 Dominant Tapestry Number
- 2025 Tapestry Household Base
- 2025 HH Owns or Leases Subcompact Car (Percentage)
- 2025 HH Owns or Leases Compact Car (Percentage)
- 2025 HH Owns or Leases Intermediate Car (Percentage)
- 2025 HH Owns or Leases Standard Car (Percentage)
- 2025 HH Owns or Leases Luxury Car (Percentage)
- In the Result layer section, enter an output name, such as Disaster preparedness.
Click Run to run your analysis. Click on a census tract to view its Dominant Tapestry segment and variable values for car ownership.

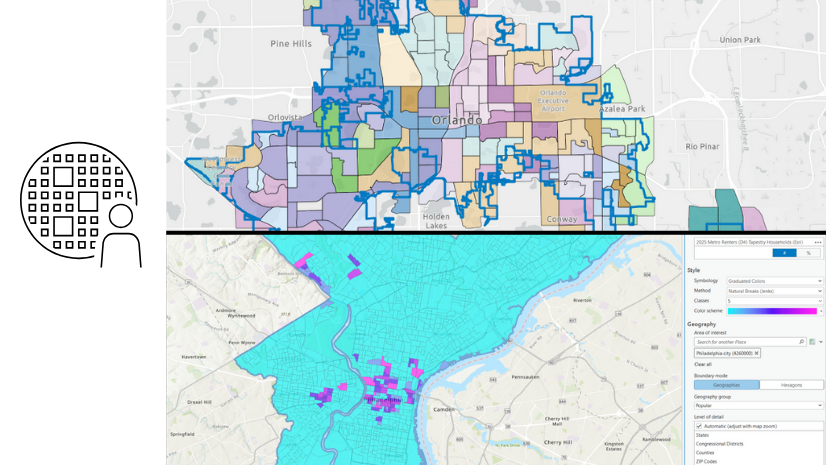
Style the map
For a quick view of the different Tapestry segments, click Styles and click + Field. Select the 2025 Dominant Tapestry Number variable. The map automatically adjusts to use different colors for each represented Dominant Tapestry segment.

Zoom to New Orleans
You’ll add a filter to zoom in to New Orleans. Click Filter and use the following condition:
- For the field name, choose County FIPS Code.
- For the operator, choose is.
- For the value, enter 071.
Click on a site to view the underlying tabulated data in a pop-up.

Analyze the results
From this analysis, you can assess the vulnerability of communities in Louisiana. The Tapestry variables provide a contextual overview of community composition based on shared demographic, socioeconomic, and lifestyle characteristics. For disaster preparedness, resources may need to be allocated to certain segments based on characteristics like young families or seniors. Additionally, the car ownership variables show where there is low car ownership and therefore residents may need heightened evacuation support during disasters.
This example has shown that you can use Tapestry data in the Enrich Layer tool using Map Viewer in ArcGIS Online.
Using ArcGIS Tapestry data in ArcGIS Location Platform
You can also perform this workflow using ArcGIS Location Platform. ArcGIS Location Platform provides direct access to high-quality location services and integrated location intelligence with applications and business systems using a complete set of mapping APIs, SDKs, services, and tools.
Simply login to your portal at https://location.arcgis.com and reproduce the above steps using Map Viewer. Note that performing spatial analyses results in service transaction fees. To see other examples of enriching data using ArcGIS Location Platform, see these tutorials.
Conclusion
This blog article has highlighted how you can utilize the updated Tapestry data in ArGIS Pro, ArcGIS Online, and ArcGIS Location Platform. There are countless other ways to use Tapestry data and we hope this inspired you to incorporate this dataset into your mapping and analysis.


Article Discussion: