Approximate Reading Time: 5 minutes
The Count Overlapping Features tool, introduced in ArcGIS Pro 2.5, makes determining the number, area, and location of overlapping polygons simple! This blog uses this tool with species habitat range data to create a biodiversity map.
Get started
Biodiversity refers to the different types of life in an area, including the variety of plant and animal species. To map biodiversity, we need to distinguish between the areas with a low to a high number of overlapping habitats or ecosystems.
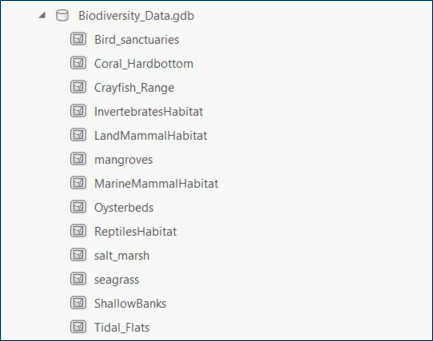
Like with most projects, we need to start with some data. The database pictured below contains multiple polygon feature classes for various species’ habitat ranges and ecosystems. Our task is to use this data to create a biodiversity map.
Brainstorm Solutions
A simple approach to observe overlap would be to add all the datasets to a map, set each layer symbology to partially transparent, and observe the change in opacity from light to dark. However, it may become difficult to distinguish between slight changes in opacity. Moreover, setting transparency will not produce an output feature class that tells us how many features overlap. What is the best way to identify and quantify overlapping feature layers?
Count Overlapping Features
The Count Overlapping Features geoprocessing tool quantifies the number of overlapping input features to an output feature class. This tool is helpful when working with one or many layers with overlapping polygon features.

Prepare the species data
The data for this project comes from the Florida Fish and Wildlife Conservation Commission and includes 13 ecosystem and habitat polygon feature classes.
Some habitat features extend beyond Florida’s state land and water boundaries. First, use the Pairwise Clip tool to cut the features to only include the areas in the Florida state waters and land boundary.
Next, after looking at the data, there are a few potential problems:
- Some of the feature classes have multiple features per species. For example, the layer for marine mammal habitats contains information for five different species of aquatic mammals, including whales, dolphins, and manatees. We want each unique species to be a single feature within the feature class.
- Some of the species’ polygons overlap other polygons of the same species, which would result in double counting that species in that location.
Use the Pairwise Dissolve tool to resolve these issues by dissolving each feature class based on the species name attribute (SCINAME). Dissolving based on the species type ensures we get a count of the unique plant and animal species rather than a count of raw polygon features. So, for instance, the marine mammal habitat layer is dissolved into five features.

Run Count Overlapping Features
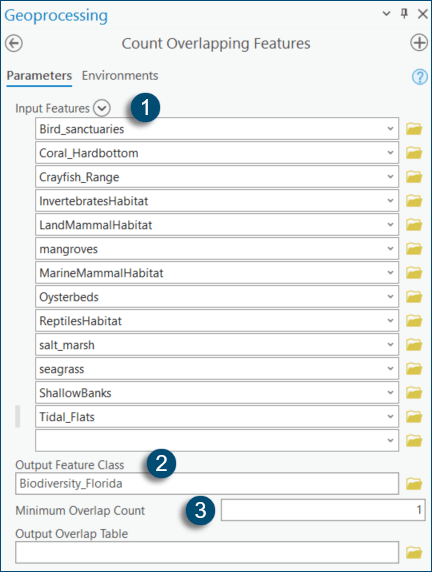
Using the Count Overlapping Features geoprocessing tool: (1) add each of the prepared layers to the Input Features, (2) specify the output feature class or leave it default, and (3) leave the Minimum Overlap Count at the default value of 1, meaning that the final output will include any location with one or more species.
Result Details
After running the Count Overlapping Features tool, open the attribute table for the output layer. Notice that there are two fields: COUNT_ and COUNT_FC, which correspond to the number of overlapping features (i.e., rows of data) and feature classes, respectively.
Note: Databases have reserved keywords, including COUNT; therefore, the field name, COUNT_, includes an underscore character to avoid breaking database rules.

The COUNT_ field measures the number of overlapping features in a location, whereas the COUNT_FC field measures the number of overlapping feature classes in that location. Therefore, the COUNT_ field has larger values compared to the COUNT_FC field because some feature classes include multiple species or ecosystem attributes.

Biodiversity Map
Florida’s coastal wetland and marine areas have an amazing amount of biodiversity! Two areas of focus with high biodiversity, as indicated by a higher count of overlapping ranges of habitats and ecosystems, are highlighted using the inset maps of Apalachee Bay and the Florida Keys.

Summary
This blog provides an example of using the Count Overlapping Features geoprocessing tool with polygon data to show the area overlap of plant and animal species in Florida. This tool also works to count overlapping point and line input data, and the geometry type of the output feature class will be the same as the inputs. Note: all input features must have the same geometry type.
The next time you want to understand and quantify the overlap of your feature data, look no further than the Count Overlapping Features tool!


Article Discussion: