Have you ever run a hot spot analysis?
If you haven’t (or if it has been a while), give it a try!
It’s a powerful spatial analysis tool that helps us find statistically significant clusters in our data. These clusters help us confirm if the patterns we perceive when observing a map are worth our attention and resources.
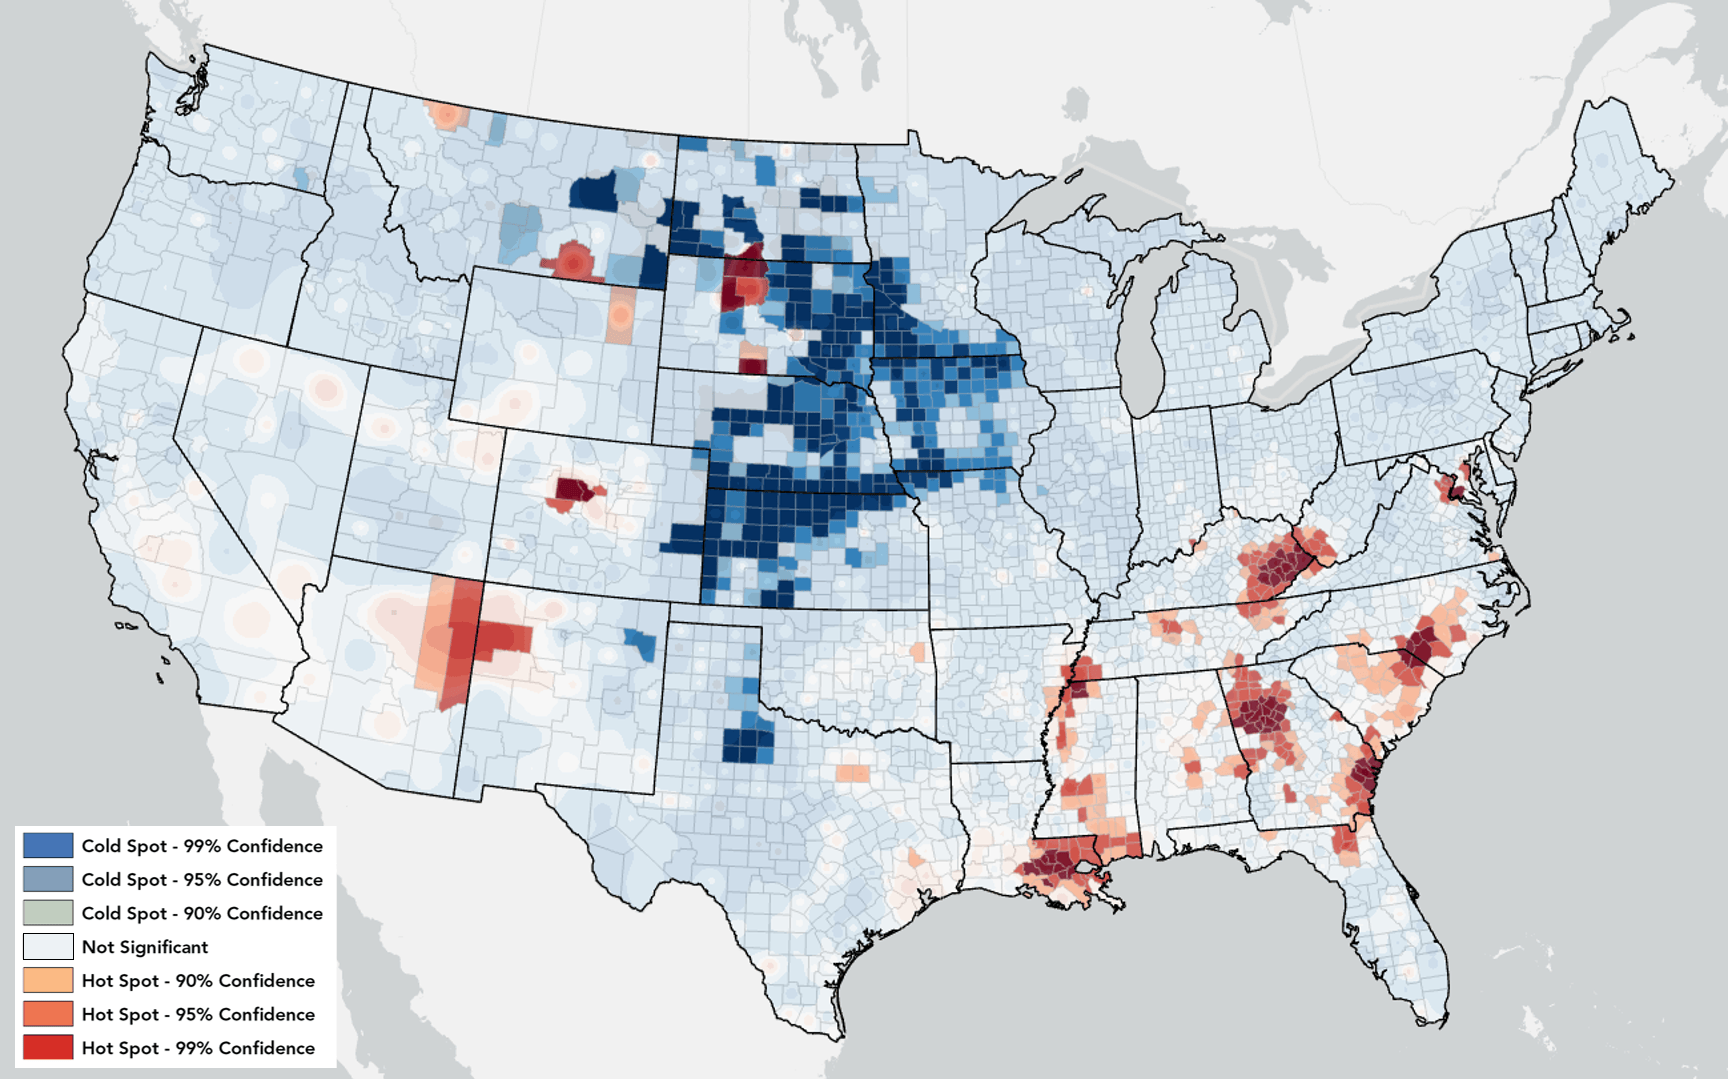
Hot Spot Analysis is one of the foundational spatial analysis tools – it’s often the first tool we run to start uncovering spatial patterns in our data. But have you ever considered how the neighborhoods you choose in this tool can change the results?
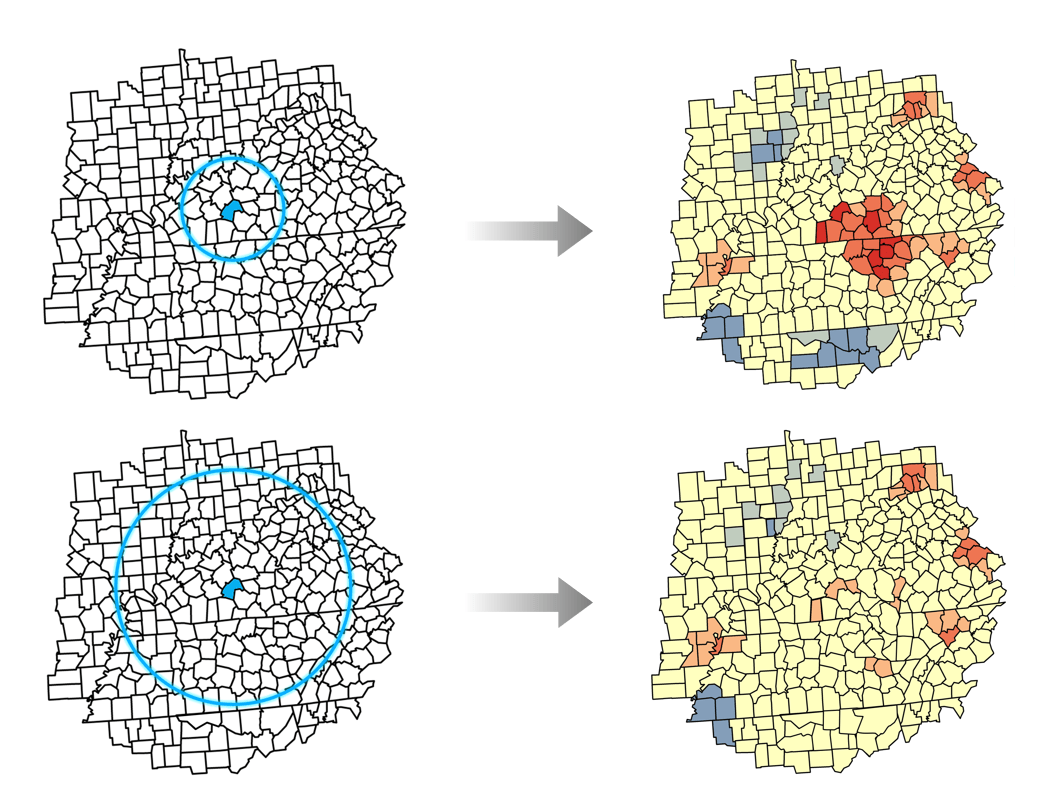
When you run Hot Spot Analysis, you select a conceptualization of spatial relationships, and this defines the neighborhoods used in the analysis. Like with many other Spatial Statistics tools, a useful analysis depends on defining and thinking critically about what it means for a feature to be considered near another feature. For example, you might say that features sharing a boundary, or features within 150 kilometers of each other, are considered neighbors. A slight difference in the definition of a neighborhood can lead to important differences in the results, so this is a critical part of the analysis to understand, decide, and communicate with your results.
But it is often difficult to fully understand and select appropriate neighborhoods when doing analysis. Today, we select and decide on neighborhoods using dropdowns and parameter settings – hardly an inviting or interesting way to think about geography!
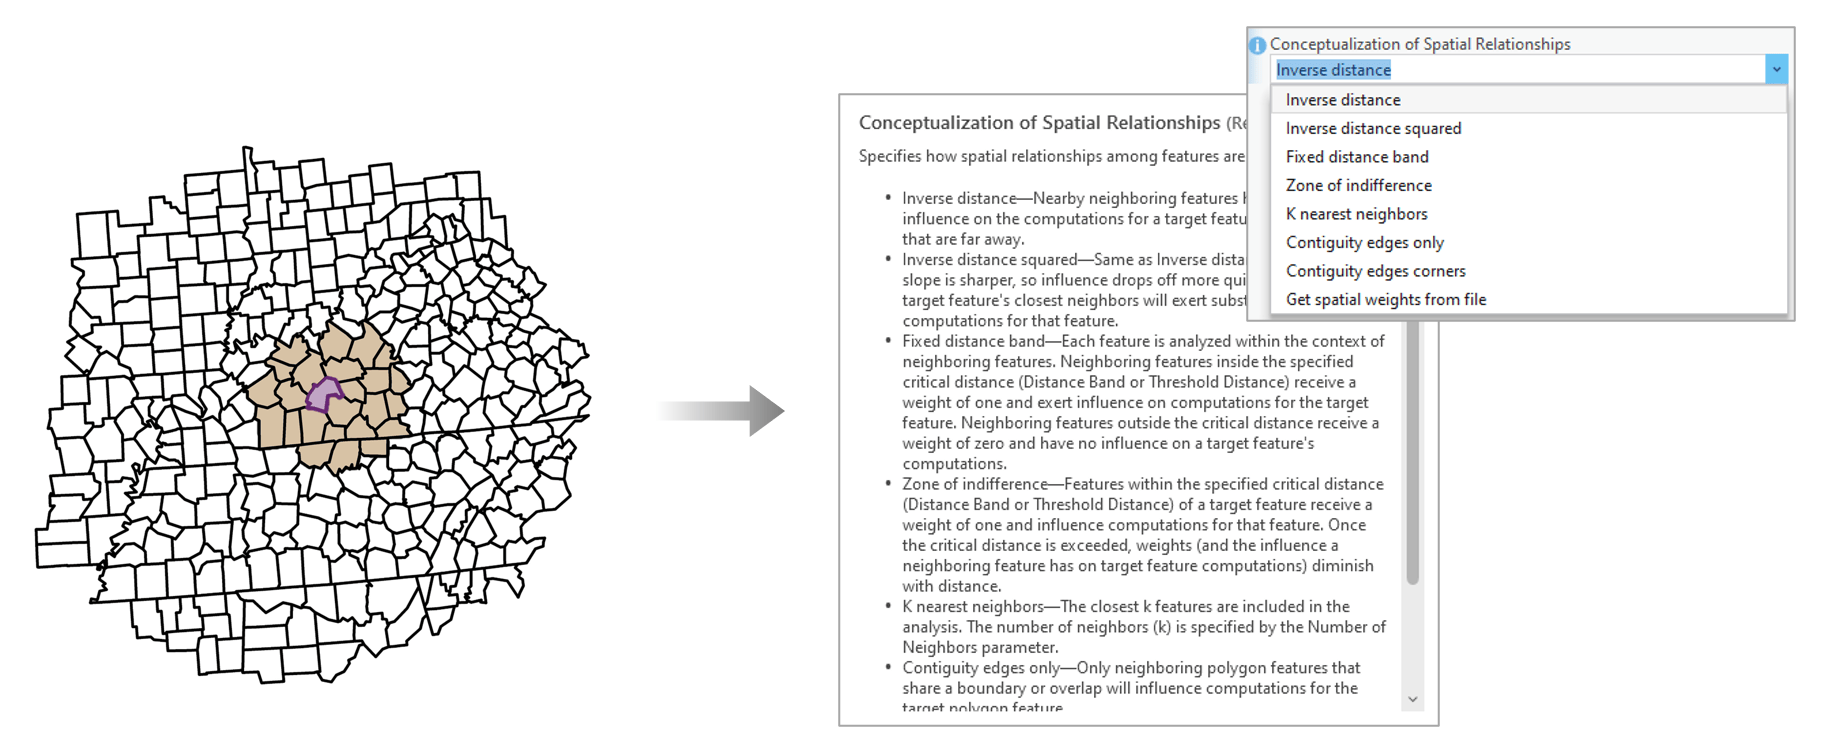
To help you understand and explore neighborhoods, ArcGIS Pro 3.2 now includes Neighborhood Explorer: an experience that will help you learn about and refine your spatial statistics analysis. Here’s the basics of how it works:
Beyond exploration, neighborhood definitions can be edited, saved, and shared. For example, a starting definition of neighborhoods leaves an island without neighbors. This may be perfectly reasonable, but if domain knowledge suggests that the island is closely related with coastal communities across a strait, you can manually edit and add neighbors to that feature to better reflect the spatial relationships in the data. The resulting neighborhood definition can be saved as a spatial weights matrix file, and used in Spatial Statistics tools or shared with colleagues for reproducibility.
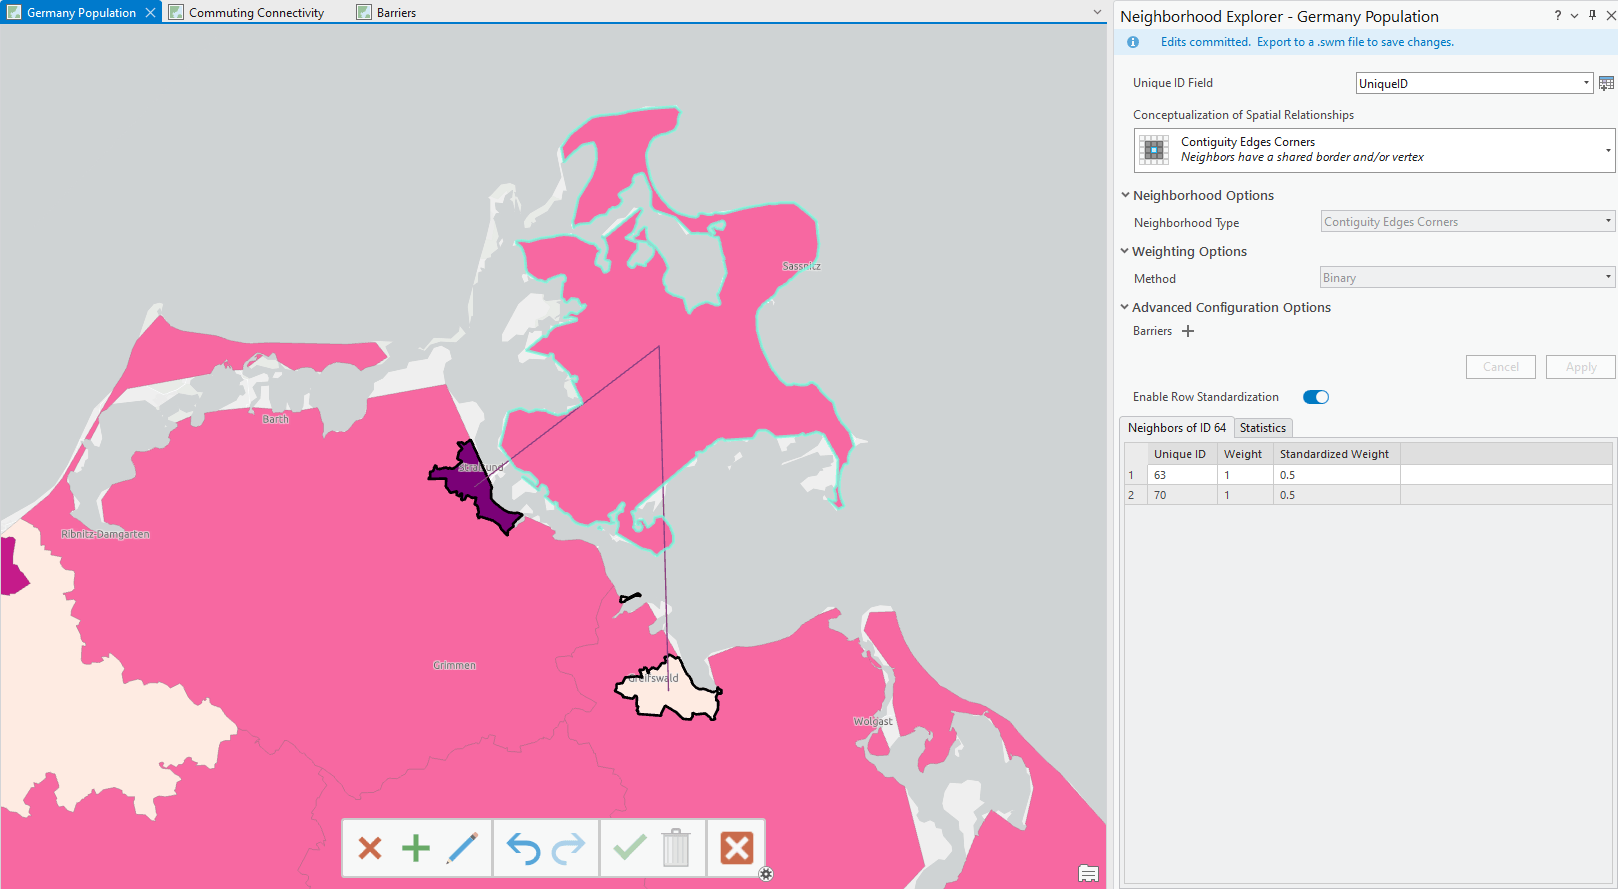
Neighborhood Explorer shines when used alongside Spatial Statistics tools, but it can also help you explore connections in your data.
For example, the U.S. Census Bureau publishes commuting journey to work data and you can use this data to create a spatial weights matrix and visualize the connections using Neighborhood Explorer. Once a location is clicked, you can explore commute patterns: the clicked location displays where people reside, and the neighbors correspond to where people that live in that location are commuting to. These aren’t simple spatial relationships where we define a distance or use contiguity.
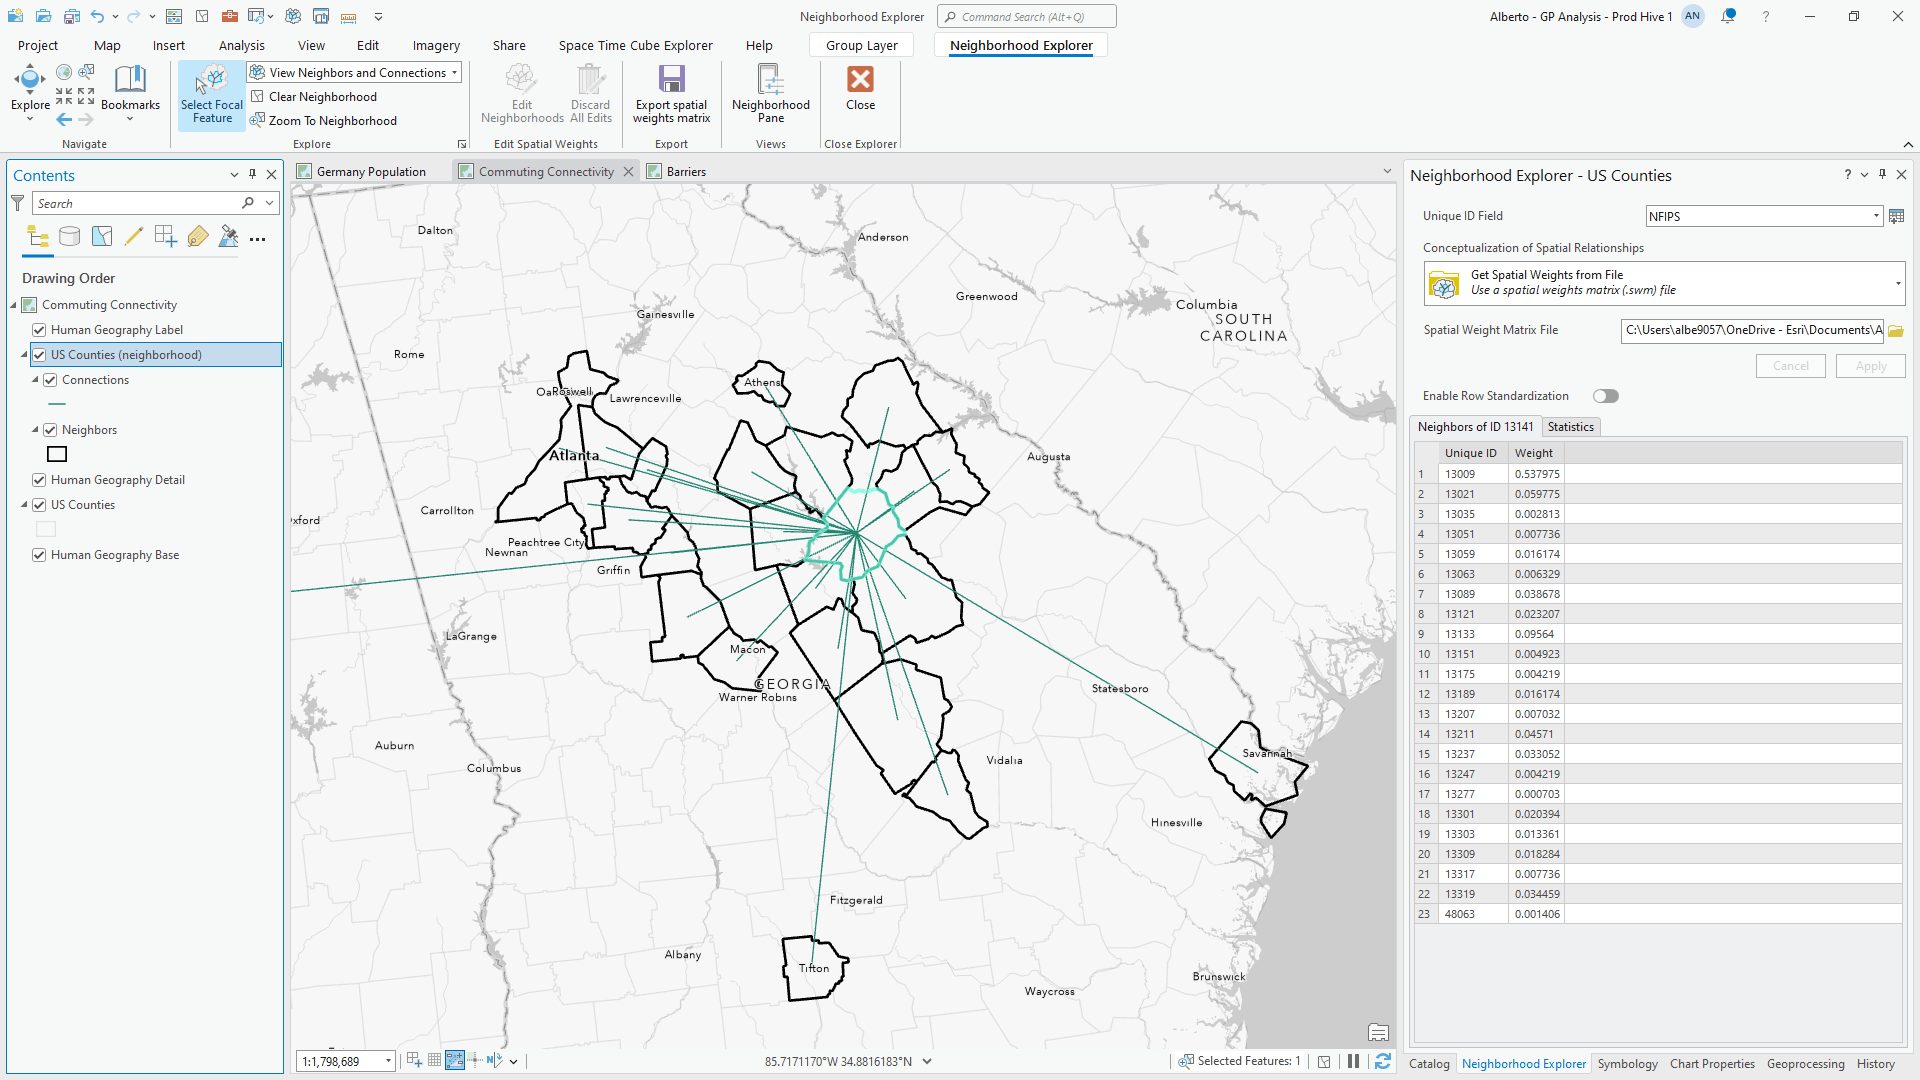
Neighborhood Explorer is a capability that helps you learn about spatial relationships and refine your analysis. We hope it also helps you communicate these concepts, and help propagate the importance of geography as we understand the world.
"Everything is related to everything else, but near things are more related than distant things."

Article Discussion: