How Emergency Managers and Public Health Officials Should Address FEMA Administrator’s Seven Critical Steps with GIS
On Friday, March 27, 2020, a letter from Federal Emergency Management Agency (FEMA) administrator Pete Gaynor went out to local, state, and federal emergency managers and public health administrators. The letter included guidance on seven important steps recommended to successfully stop the spread of coronavirus disease 2019 (COVID-19).
The letter acknowledges the unprecedented and demanding nature of the COVID-19 pandemic and calls on all involved to work collaboratively to deliver solutions that are locally executed, state managed, and federally supported.
Geography has long been an important component of public health preparedness. Geographic information system (GIS) technology operationalizes the geographic role for each of the steps Gaynor outlines, resulting in more efficient workflows, a deeper understanding of the situation, clarity in resource allocation, and better-informed decision-making. What follows is a review of the seven steps, seen through a geographic lens, along with embedded examples and links to resources.
1. Enhancing Social Distancing and Good Hygiene, Because Mitigation Matters
With GIS, responders can monitor the impact of social distancing orders and public safety directives and can help disadvantaged individuals find resources to help themselves. Both of these mitigation efforts involve geographic problem solving.
a. Support good hygiene where it’s most needed.
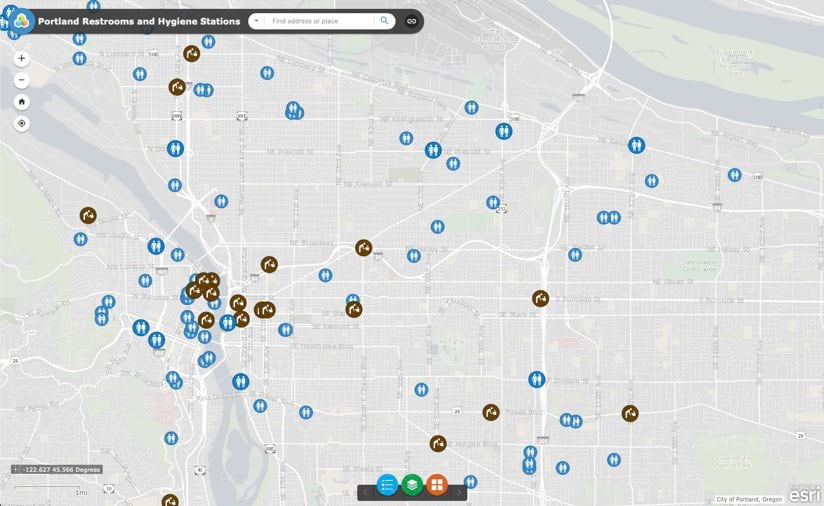
GIS is a powerful tool for determining where the most vulnerable residents live. Using data from the Centers for Disease Control and Prevention’s CDC Social Vulnerability Index 2018—USA, cities such as Portland, Oregon, have identified areas where people experiencing homelessness congregate. Once those areas are known, they can target the delivery of sanitation stations to slow the spread of disease. GIS underpins the analysis, supports the efficient distribution of stations, and helps residents find these resources with online and mobile apps. The city can use similar apps to assign and monitor ongoing maintenance.
b. Share pertinent information to support behavioral change recommendations.
Sharing COVID-19 case data in real time, map-based dashboards help inform the public and convince them to stay home. However, finding areas where people are not adhering to social distancing orders can be challenging.
c. Review human mobility data to target increased messaging and/or enforcement.
Many municipalities have tapped into aggregated mobility data from a variety of sources. Through geographic analysis and visualization, municipalities can see patterns of behavior and areas of higher activity on a map. This will help authorities devise focused and relevant strategies to warn residents about the risks they pose to themselves and to those they come in contact with. When one gathering place or area of high movement is found, its parameters can be used to query and find similar areas for targeted interventions.
The use of GIS helps authorities visualize policies and correlate them with behavior, seeing if directives have an impact on the spread of the virus. Keeping a constant eye on results helps to quickly surface best practices that other communities can follow to flatten the curve.
d. Include population vulnerabilities in the analysis.
More in-depth spatial analysis can be completed to assess a population’s risk of transmission, by exploring human mobility data. A population’s resources and vulnerabilities factor into susceptibility to the disease, including access to health care and exposure pathways.
When digging deep into analytics, the MapMasq plug-in to ArcGIS assists organizations in aligning with the Health Insurance Portability and Accountability Act of 1996 (HIPAA) privacy protection rules. Data can be properly anonymized as points or aggregated using various methods that still allow a localized view. Authorities run and rerun these and other spatial analytics for ongoing monitoring across space and time to keep on top of changing conditions.
2. Integrating Emergency Management and Public Health Operations
The call to create a unified emergency management/public health team builds on the principles found in the National Incident Management System (NIMS). NIMS provides a unified command structure under the incident command system (ICS). A unified command organizes leadership from multiple departments, agencies, or disciplines to ensure that the response is jointly planned, managed, and adjusted in coordination with the experts needed to address the incident. This pandemic requires health and emergency management communities to unite to deliver an effective response.
a. Deploy data sharing hubs.
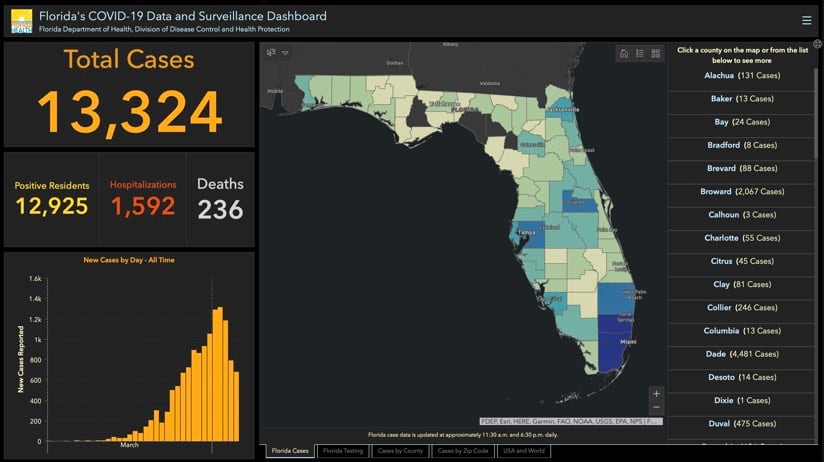
GIS provides a key input to enhance data gathering, sharing, visualization, and analysis. It also underpins real-time dashboards that have proven to be central in providing an at-a-glance awareness of the current state of the disease’s spread. The fusion approach revolves around data sharing hubs that provide a place for partners and the public to access and share location-based data and initiatives. The states of Florida and Texas provide good examples of how GIS helps pull together data and resources for COVID-19 response. Esri has written a blog post explaining ways to share and collaborate using ArcGIS that includes links to COVID-19 guidance from the federal government.
b. Connect directly to key resources.
States leverage funding resources from the Centers for Disease Control and Prevention (CDC) to create and maintain public health infrastructure like the CDC’s Health Alert Network site to get important messages out to health professionals. The site also contains a variety of tools and systems designed specifically for responding to this type of health emergency. States can reach out to their local or state public health department for specific resources.
c. Enable data integration and usage.
The distributed nature of GIS means that data can be dispensed and used across different locations and devices, with apps and shared maps providing real-time inputs and transparency to all levels of government and the public. Rather than providing data in static formats like PDFs, GIS brings actionable data in ways that allow access and use by aligned organizations for a shared response and a sense of community. Ideally, a repository of critical data assets would be compiled to improve efficiency.
3. Collecting Hospital Bed Capacity Data
The call to inventory hospital beds is a distinct “what is where” problem that holds great urgency. However, now is not the time to send workers to hospitals to count and tally the beds they see. Health-care providers are fully engaged in responding to this crisis, and in-person data collectors could become infected and/or spread the disease.
a. Collect current hospital bed capacity data remotely.
Daily hospital bed census data may be collected digitally. If current health technology systems are not in place to capture and transmit that data to those who need it, then the Hospitalization and PPE Inventory ArcGIS Solution could be a good option. This provides a collection of maps and apps to inventory hospital capacity and personal protective equipment (PPE) available at local hospitals and acute care centers. An online or mobile survey tool could be configured to uniformly gather updated data on a regular schedule. Current initiatives are being spun up through the National Healthcare Safety Network to collect data directly from hospitals as well as initiatives through the National Association of Public Safety GIS (NAPSG) to align with the public safety community (Fire, EMS and Police).
b. Tap into baseline hospital bed capacity data from Definitive Healthcare.
Many localities have turned to Esri partner Definitive Healthcare’s USA Hospital Beds dataset as a baseline, using GIS to understand normal hospital bed utilization, licensed beds, staffed beds, and intensive care unit (ICU) beds for hospitals across the US. This commercially available data was made available for free for over 12months and taken down in May of 2021.
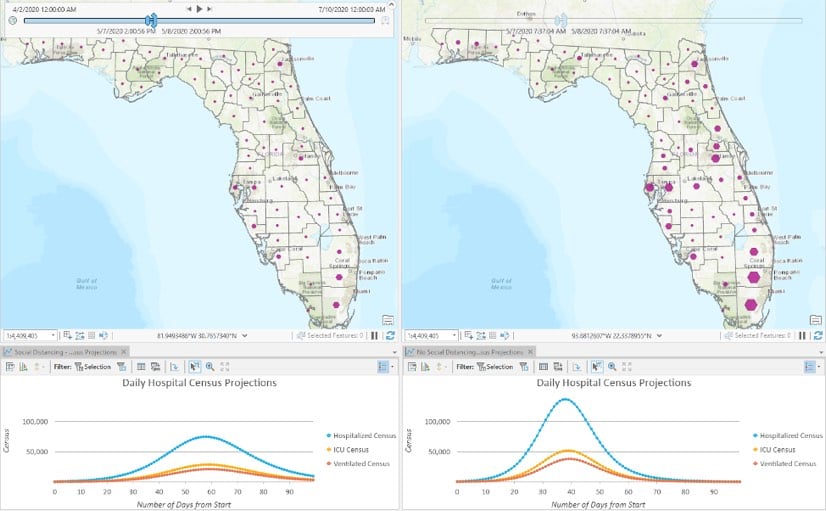
c. Model hospital surge with CHIME and FluSurge 2.0.
The Predictive Healthcare team at Penn Medicine created the COVID-19 Hospital Impact Model for Epidemics (CHIME) to determine when particular hospitals or regions will be oversubscribed. In addition, the CDC has provided a hospital surge model with its FluSurge 2.0 tool. The CHIME model is now available as geoprocessing tool within ArcGIS Pro and the Esri Spatial Statistics Team is working to make FluSurge available in a similar manner. Modeling scenarios can easily be updated as more data comes in. Esri is actively exploring ways to plug other models like the Institute for Health Metrics and Evaluation (IHME) model into ArcGIS to allow users to compare models and leverage the models of their choice.
d. Build your capacity and surge models into your regular preparedness workflows.
Capacity and surge analyses should build on existing linkages between hospitals, public health administrators, and local hospital associations that band together in times of an emergency under existing programs like the US Department of Health & Human Services Hospital Preparedness Program.
Every hospital is required to have a license for each hospital bed, and the licensing authority is typically the state public health department. South Carolina shares this data publicly in its Find a Facility interactive map.
The tally and location of licensed hospital beds, ICU beds, and utilization rates can be enhanced with regular updates to keep the count current. GIS can also be used to monitor diminishing capacity needs and to determine if resources should be sent somewhere else. GIS underpins a data-driven approach to allocate scarce resources while factoring in population size, demographics, social distancing measures, and vulnerability.
4. Standing Up Alternative Care Sites
To add capacity when hospital demand surges, FEMA suggests looking at alternative care locations like convention centers, hotels, shuttered hospitals, college or university dormitories, or vacant open space in commercial buildings. The locations of existing shelters are an important input early on in this analysis.
a. Perform site suitability analysis.
Site suitability workflows are the bread and butter of GIS. These workflows are frequently used by businesses to decide where to open a new store or grow services in an existing location. GIS provides the means to explore potential properties and to compare these sites to points of dispensing (PODs) for the Strategic National Stockpile. Examining the proximity of sites to PODs and factoring in drive times provide input into logistics. GIS also can be used to differentially weight potential locations to favor concentrations of vulnerable populations and transit accessibility, among other variables, to make equitable decisions that serve everyone in the region.
A recent white paper, Locating COVID-19 Testing, Treatment, and Resource Distribution Sites, details a geographic modeling approach to identify locations related to COVID-19 response. Spatial statistics were applied to first calculate population demand, and then to find the most suitable locations. The results provide a defensible decision support methodology to ensure that individuals with the highest needs have priority access to the care they require during this crisis.
5. Inventorying and Maintaining Situational Awareness on Critical Equipment, such as Ventilators
a. Inventory and track critical equipment based on location.
The call to check all hospitals, acute care sites, and outpatient locations for ventilators deserves a location-enabled mobile application to aggregate this inventory. Putting these assets on the map provides an active view to indicate levels of use and to track devices as they are moved.
Ventilators are not licensed in the same way as X-ray machines and other diagnostic devices, so inventories have not previously existed. If existing reporting tools are not available the Hospitalization and PPE Inventory ArcGIS Solution can provide a method to collect some of this critical information. However, an app that ties into the existing reporting infrastructure of public health and hospital associations would help normalize and persist data collection and sharing of this critical resource. For example, San Bernardino County California created a COVID-19 ArcGIS Dashboard that displays ventilator utilization and availability across the county along with detailed stats on cases, deaths, testing and localized outbreaks to paint a more complete operational picture to drive decision-making.
b. Practice location-allocation.
Once an inventory is created, the data can be mined, using GIS to plan where and how inactive devices could be moved to priority sites for equitable allocation during a hospital surge. Advanced GIS users can tag assets with tracking sensors to show location within a facility and to track and alert administrators if the device is moved. Complete asset visibility and real-time device tracking enable rapid event response.
6. Finding Personnel to Prepare for the Hospital Surge
a. Connect to existing systems for health-care workforce augmentation.
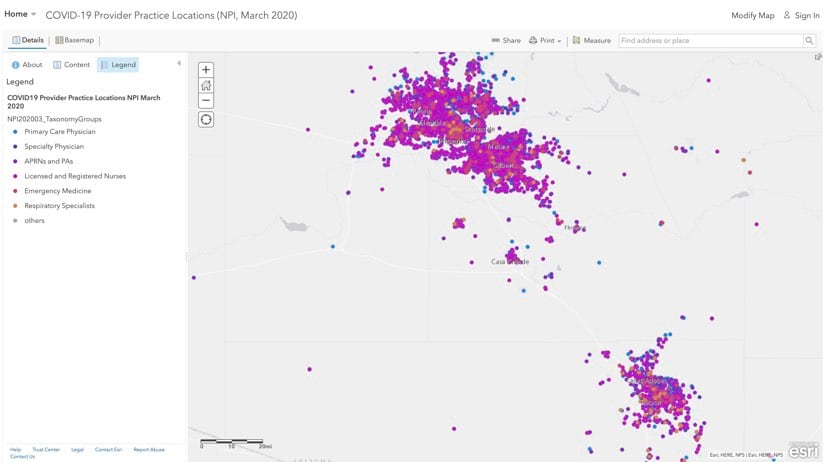
While working to find medical professionals who might fill in during spikes of need, authorities should be tapping into established public health infrastructures like the Emergency System for Advance Registration of Volunteer Health Professionals. It is the place where licensed and credentialed health professionals register and interface with their state coordinator to receive work assignments. Data from the Centers for Medicare and Medicaid Services’ National Plan & Provider Enumeration System (NPPES) provides the practice location for physicians and health-care specialists. An interactive map created by HealthLandscape displays the practice locations of health-care specialties designated as the most likely to be needed for COVID-19 response. Augmenting health-care staff based on proximity to need makes sense for cost and efficiency reasons and also to speed caregivers to where the need is most urgent in order to save lives.
b. Keep track of critical personnel in real time.
Some hospitals have applied real-time location intelligence to track high-demand personnel, such as pulmonologists and respiratory therapists, within facilities. Tracking individuals during work hours can be fine-tuned to keep tabs on caseload and potential exposures and to improve personnel interactions.
7. Managing Personal Protective Equipment Carefully
a. Manage distribution from the Strategic National Stockpile.
FEMA stood up its Supply Chain Stabilization Task Force to speed and prioritize the flow of personal protective equipment (PPE) such as N95 masks and surgical masks and other critical equipment such as ventilators. The task force uses GIS to allocate and distribute supplies from the Strategic National Stockpile to locations most in need (current and anticipated).
b. Use GIS to explore alternate supply chains.
FEMA has also urged local responders to source PPE supplies of their own rather than depend solely on federal resources. Those looking to move stockpiled inventories can tap into modern tools for supply chain digitization in order to plan for and mitigate delivery disruptions. Sensors on shipments can provide real-time location and movement of supplies, a strong consideration in times when lives are on the line. Some jurisdictions have deployed interactive map-based dashboards to track personal protective equipment distribution status and keep track of supply inventories.
Summary
As administrator Gaynor notes, these are unprecedented times, and many lives are at stake. Esri is offering data, maps, applications, and many other location intelligence resources via the COVID-19 GIS Hub. Esri’s Coronavirus Response web page provides a collection of maps and apps that can be used by public health agencies to understand the impact of COVID-19 and share information about the pandemic with their communities. The new Coronavirus Business Continuity solution provides tools for organizations of all types and sizes to understand the operational capacity of workers, monitor the status of facilities, and communicate disruptions to customers and stakeholders. Local authorities and organizations that need help in crafting their responses can reach out to the Esri Disaster Response Program for assistance.
Resources
All links included above, and more, are categorized below for easy access.
Public Health Preparedness
- National Incident Management System from the Federal Emergency Management Agency
- Public Health Preparedness: A Geographic Approach, a story map overview from Esri
- “Public Health Preparedness, Your Forgotten Partner” by Christopher Thomas, GovLoop, April 17, 2017
Data Sharing
Approaches
- ArcGIS Hub, a community engagement software from Esri
- Distributed collaboration, via Portal for ArcGIS
Health Administration Networks
- Health Alert Network from the Centers for Disease Control and Prevention (CDC)
- State & Territorial Health Department Websites, via CDC
- COVID-19 landing page from the Association of State and Territorial Health Officials (ASTHO)
- COVID-19 response site from the National Association of County and City Health Officials (NACCHO)
Data
- COVID-19 GIS Hub, a collection of maps, datasets, applications, and more, to aid COVID-19 response from Esri
- Esri COVID-19 data in ArcGIS Living Atlas of the World
- Homeland Infrastructure Foundation-Level Data (HIFLD) data from the National Geospatial-Intelligence Agency (NGA)
Solutions
- Shelter Locator, a configurable tool to quickly deploy a public resource to find emergency shelter, part of ArcGIS Solutions for Emergency Management
- Hospitalization and PPE Inventory ArcGIS Solution, a collection of maps and apps that can be used by emergency management staff to inventory hospital capacity and personal protective equipment (PPE) available at local hospitals and acute care centers.
Supplies
- Strategic National Stockpile from the US Department of Health & Human Services
Physicians and Available Hospital Personnel
- Emergency System for Advance Registration of Volunteer Health Professionals from the US Department of Health & Human Services
- COVID-19 Provider Practice Locations, an interactive map that includes data from the Centers for Medicare and Medicaid Services’ National Plan & Provider Enumeration System (NPPES) created by HealthLandscape
Funding Sources
- Public Health Emergency Preparedness (PHEP) Cooperative Agreement from the Centers for Disease Control and Prevention
Status and Resources Maps
- Coronavirus COVID-19 Global Cases from Johns Hopkins University, Center for Systems Science and Engineering
- Coronavirus Disease (COVID-19) Situation Dashboard from the World Health Organization
- Find a Facility, an interactive map from South Carolina Health Facilities and Services
- K12 School Status Updates, a national interactive dashboard detailing US school closures by district, including details about those that have shifted to online instruction as well as projected reopenings, provided by MCH Strategic Data
- Florida’s COVID-19 Data and Surveillance Dashboard from the Florida Department of Health, Division of Disease Control and Health Protection
- TX COVID-19—Impacted County Planning Reports from the Texas Division of Emergency Management
- Portland Restrooms and Hygiene Stations, part of the PortlandMaps open data and mapping site for Portland, Oregon
- San Bernardino County COVID-19 ArcGIS Dashboard, displays detailed county-level statistics on cases, deaths, hospital utilization and ventilators
Spatial Analytics
Tutorials
- Map COVID-19 Risk, a spatial analysis tutorial for using ArcGIS Pro to model COVID-19 transmission risk presented by Lauren S. Griffin, Esri
- Locating COVID-19 Testing, Treatment, and Resource Distribution Sites, an Esri white paper
- “New Site Suitability Analysis Workflow and Tools in Business Analyst for ArcGIS 2.2” by Tony Howser from ArcGIS Blog, June 28, 2018
Vulnerability
- Age and Social Vulnerability in the Context of Coronavirus by John Nelson, from ArcGIS Blog, March 12, 2020
- CDC Social Vulnerability Index 2018—USA, a feature layer that can be imported into ArcGIS to visualize the 2018 overall vulnerability of every US county and census tract from the Centers for Disease Control and Prevention
Supply Scarcity Modeling
- USA Hospital Beds, developed by Esri partner Definitive Healthcare, which also provided a Dashboard of normal hospital bed occupancy during the height of the pandemic
- COVID-19 Hospital Impact Model for Epidemics (CHIME), a tool to assist public health officials with hospital capacity planning (with a plug-in for ArcGIS), created by Penn Medicine
- FluSurge 2.0, a model to estimate the surge in demand for hospital-based services from the CDC
Behavior Modeling
- Esri Movement Data, anonymized data points to help organizations discover population patterns with human mobility data and traffic data
- Unacast Social Distancing, a by-county dataset derived from a comparison of current daily mobility to pre-COVID-19 outbreak mobility
HIPAA Privacy Compliance
- Navigating HIPAA in a Geospatial World, a video tutorial from Esri’s Health and Human Services Meetup series
- MapMasq, a statistical representation of the data that maintains the privacy of individuals, developed by Esri partner GISinc.
Hospital Asset Tracking
- Example of a real-time interactive map displaying the movement of critical assets, created with ArcGIS Indoors
- ArcGIS Indoors—Smart Hospital Operations, a recorded Esri webinar

Commenting is not enabled for this article.