Join Esri in celebrating Landsat’s 50 years of continuous Earth observation. Truly a gift to the world. This unbiased scientific data provides foundational information about our changing world, and it has provided scientists, analysts, and citizens around the globe with Earth imagery and data. Terrestrial imagery has been collected of every location on Earth, every 16 days, for five decades! The impact of the Landsat program has been transformative in so many ways. Esri has been along for the ride from the beginning, and what an a-mazing ride it has been.
Managed by the United States Geological Survey (USGS), in coordination with NOAA and NASA, Landsat’s goal is to, “collect valuable resource data and use it to improve the quality of the environment”. This purpose has exceeded expectations, and Earth Sciences depend on Landsat data across the board.
The Landsat program launched the era of Earth observation, and achieved many firsts that have affected us all in profound ways.
- First spaceborne digital multispectral sensor (MSS)–Developed by the pioneering physicist Virginia Norwood, the “Mother of Landsat”. Dr. Norwood conceived and developed the innovative “pushbroom” multispectral sensor, which included not one, but two (!) near infrared bands that are fundamental to vegetation identification and management. MSS, and the subsequent ETM sensor, blazed the trail for many Earth imaging satellite sensors used today.
- First systematic digital image processing of multispectral imagery–Valerie L. Thomas managed the development of early Landsat image processing software systems. Dr. Thomas was a lead image processing specialist on the ambitious Large Area Crop Inventory Experiment (LACIE), a project that showed for the first time that global crop monitoring could be done with Landsat satellite imagery.
- Beginning of digital multispectral image analysis–Computation image processing allowing quantifiable and repeatable results according to scientific principles.
- Birth of Remote Sensing–The scientific analysis of digital imagery based on information contained within and between multiple spectral bands. This allows the analysis of spectral curves related to vegetation growth cycles, minerals and materials, seasonality, and other quantifiable physical and environmental phenomena.
- Emergence of analytical image analysis–The integration of visual analysis based on human vision and cognition, remote sensing science, and digital image processing techniques.
- Digital image archiving–The systematic storage, management, searching and retrieval of an unprecedented volume of imagery data.
- First commercial multispectral satellite imagery–In 1985, the company EOSAT was established to sell Landsat data commercially.
- First free multispectral imagery–In 2008, the USGS announced the free-and-open data policy, which made Landsat data free to the public. It was also available over the Internet, which resulted in a “Big Bang” that unleashed the power of remote sensing. In a little over 12 years, more than 100 million free Landsat scenes have been downloaded!
- Longest Operating Earth Observation Satellite–Landsat 5 had a design life of 3 years, and was decommissioned 29 years later, after collecting 5 million scenes of Earth!
The breakthroughs above give scientists, land and resource managers, and everyone involved in global climate change the data, tools, and perspective to address the challenges of understanding and managing a sustainable Earth.
Landsat applications
The Landsat program launched the discipline of remote sensing, and most significantly, the myriad of Earth-centric applications that depend on the information derived from Landsat data. These applications are many, diverse and crucial to living sustainably on Earth, such as the following:
- Earth resource inventory and management–Including water, agriculture, forestry, ecosystems, wildlife, soil, minerals, and more.
- Environment monitoring and sustainability–Detecting and monitoring air, water and land pollution; assessing environmental effects of climate change.
- Risk assessment, planning, response, and mitigation–Wildfire, flood and wind events, earthquakes and landslides.
- Urban development–Mapping urban development, urban planning, and effects on the environment, ecology, flooding, weather, and other consequences.
- Cultural and social geography–Transmigration of people, water and food security
- Land cover/use dynamics – Change detection and analysis for all applications.
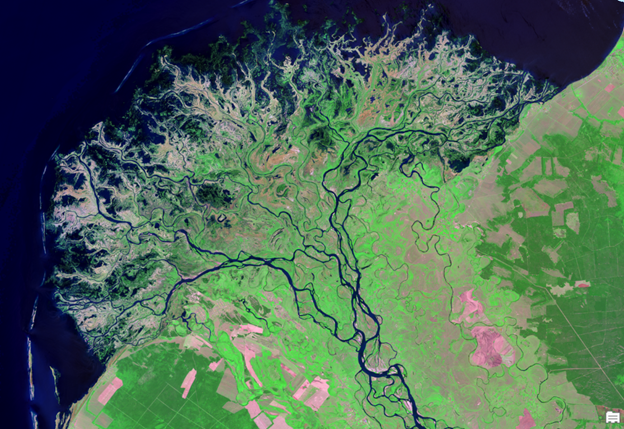
Having 50 years of continuous coverage of Earth’s landmass in an accessible archive presents a unique and extraordinary opportunity by adding another critical dimension to image analysis – Time. Virtually all applications are concerned with change over time. Analyzing features and phenomena over time can identify change cues, rates of change, and establish trends. So you can not only identify what has changed, but also how and why changes have occurred. This fosters a deeper understanding of phenomena, influences, and cause and effect. The cause-and-effect relationship is especially important for managing change at different scales and locations, from local scales such as increases of connected impervious surfaces leading to increased storm water runoff, to regional scales of managing reservoirs and dams, to managing flood events in a watershed basin and system, such as the Mississippi River.
Identifying and analyzing change requires a performant system designed for handling time, and assessing and visualizing change. ArcGIS is well suited for identifying change cues across the record of the Landsat archive–from Landsat 1 to Landsat 9–using a variety of analysis techniques, including guided workflows.
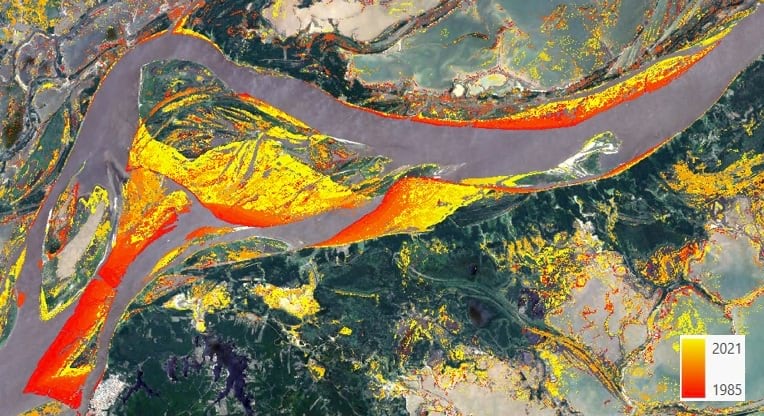
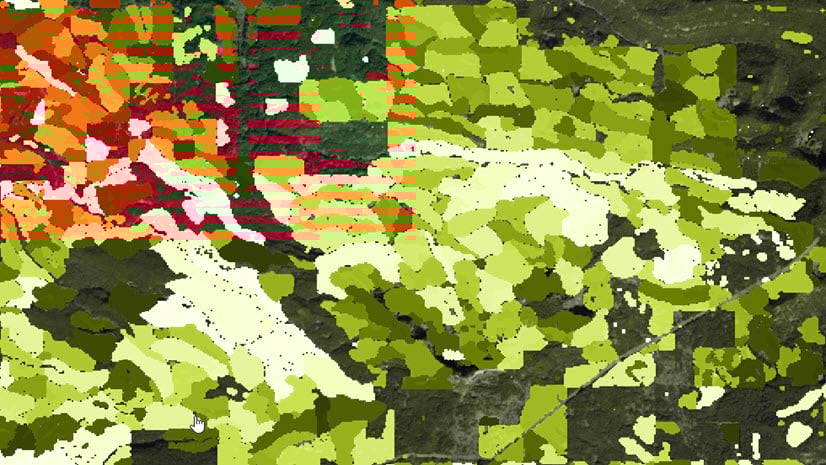
For example, the change raster below represents changing morphology in a section of the Amazon River from 1984 to 2021. It is rendered using a red-to-yellow color ramp overlaid on a 2021 Landsat 8 image. Red and orange indicate where land was submerged in earlier years, and yellow shows where land was submerged in recent years. You can see how the Amazon River has reshaped the landscape, where islands in the middle of the river shrank or were lost, forests along the river were gradually submerged, and the river boundaries evolved over the years.
Analyzing change across the Landsat record
Change on the Earth’s surface can occur because of human activity, abrupt natural disturbances, or long-term climatological or environmental trends. Detecting that change is one of the fundamental applications in imagery and remote sensing. Change detection is the comparison of multiple raster datasets, typically collected for one area at different times, to determine the type, magnitude, and location of change. This could take the form of image-to-image change detection, or change detected across a time series of images.
You can perform change detection and analysis in ArcGIS Pro, ArcGIS Enterprise and ArcGIS Image Online between multiple categorical raster datasets, such as land cover and use, or multiple continuous datasets, such as Landsat thermal and multiband imagery. You can use multiband imagery to compute the difference in a feature’s spectral reflectance between dates, or you can compute a band index to focus on specific types of change–such urban index, soil moisture, or a variety of vegetation and soil indexes–before comparing results.
Landsat Time Series datasets are increasingly common and with tools like Analyze Change with LandTrender and Detect Change with Change Analysis Raster at hand, ArcGIS Pro provides Landsat specific analytical change tools. LandTrendr (Landsat-based detection of Trends in Disturbance and Recovery) is a Landsat specific change detection algorithm. The algorithm is founded on the idea that a pixel’s history can be broken down into several linear segments over time. There may be long periods with very little change, represented by a straight line with little slope. When disturbance occurs, the pixel’s value will experience a change, represented by a short, possibly steeply sloped line segment. If recovery is allowed to occur, for example, after a forest fire, this will be represented by a long, gently sloping line, moving back toward the pixel’s original value.
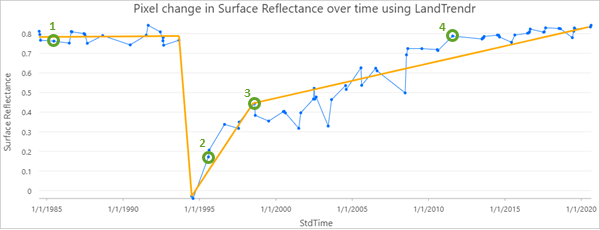

Exploratory tools also exist for Landsat Time Series datasets. The Pixel Time Series Change Explorer allows you to identify changes in a single pixel value over time using the LandTrendr method. This allows you to refine model parameters to focus on specific change events before processing the data using the Analyze Changes Using LandTrendr tool for an entire dataset.
In addition to change detection, the ArcGIS Image Analyst extension provides functions, tools, and capabilities for advanced analysis of Landsat imagery.
The Multidimensional Analysis toolset provides additional time-series change detection tools and trend analysis tools. Trend analysis tools include Generate Trend Raster and Predict Using Trend Raster, which enable the generation and prediction of trends, and can separate harmonic trends. such as seasonality, from anomalies and catastrophic events.
The Image classification and pattern recognition toolset contains tools that find, identify, and quantify patterns in imagery data. Perform object-based and traditional image analysis using image segmentation, classification, and regression analysis tools and capabilities.
The Deep Learning toolset performs image feature recognition using deep learning techniques.
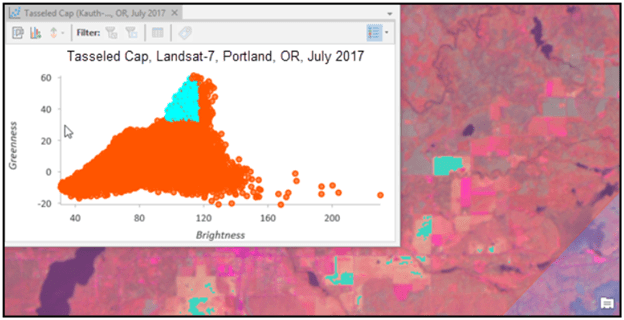
The Raster toolset and functions are used to correct and calibrate imagery, create time-enabled mosaic datasets and analytically transform imagery. For example, you can use the Tasseled Cap function to transform Landsat imagery into brightness, greenness and wetness components for vegetation and crop lifecycle analysis across multiple years and sensors.
Many of the tools above are also available as raster functions, allowing you to process Landsat imagery and mosaics on-the-fly as you roam and zoom in the map display.
To learn more about all these tools and change detection workflows, we suggest checking out the most recent Learn Lesson, Monitor forest change over time or the prior one, Get started with multidimensional multispectral imagery
Landsat services
ArcGIS Living Atlas of the World contains a plethora of useful Landsat services. A few of these services are listed below.
Multispectral Landsat – Premier, authoritative service that provides 30m resolution mosaicked imagery of Earth’s landmass, at different epochs for the entire Landsat record. Wow!
- Based on Landsat Global Land Survey (GLS) imagery of the globe for five epochs; 1975, 1990, 2000, 2005, and 2010, and updated with most images collected from January 2015 to present.
- Besides the mosaicked multispectral imagery calibrated for top-of-atmosphere (albedo), pre-defined renderings include Natural Color with dynamic range adjustment (DRA), Agriculture with DRA, Geology with DRA, Color Infrared with DRA, Bathymetric with DRA, Short-wave Infrared with DRA, Normalized Difference Moisture Index Colorized, NDVI Raw, NDVI Colorized, and NBR (Normalized Burn Ratio) Raw.
- Includes Landsat 8 and 9 Thermal Infrared Sensor bands 10 and 11, calibrated for pre-defined rendered temperature in Celsius and Fahrenheit.
- Includes 15m resolution panchromatic and pansharpened
Panchromatic Landsat–Mosaicked 15m resolution panchromatic imagery of Earth’s landmass. Includes most images collected from January 2015 to present.
Pansharpened Landsat–Mosaicked 15m resolution natural color Landsat 8 data of Earth’s landmass. Includes most images collected from January 2015 to present.
Landsat 8 Moisture Index–Derived from the most recent imagery from Landsat 8. The Normalized Difference Moisture Index estimates levels of moisture in vegetation. The map is updated on a daily basis, retaining the four most recent scenes for each path/row that have cloud coverage < 50 percent, plus the scene closest to the corresponding GLS 2000 scene.
Check out the treasure trove of Landsat data and information services provides by the Esri user community in ArcGIS Living Atlas of the World.
Ensuring our future
The Landsat program has blazed the trail for innovation and international cooperation. Free and accessible Earth imagery has fostered scientific advancements in technology, applications, and understanding of complex and inter-related earth processes. Collaboration with international partners ensures the continuation and compatibility of Earth imaging systems, and the advancement of remote sensing analysis and applications.
The Landsat archive, covering a span of half a century, allows users at all levels to explore change over time, for specific locations and regions, and to understand trends, and cause and effect to address profound challenges of managing land use, natural resources and the environment.
Continuation of the Landsat program, and other international Earth imaging programs such as the ESA Sentinel missions, provides us with the source data to develop an integrated understanding of our global life support system, and work toward a quantitative science of our biosphere. Ultimately, science based on the Landsat archive helps us to develop the knowledge, insight and wisdom to achieve a sustainable future of our home on planet Earth.


Article Discussion: