There are a lot of ways to analyze a time series of satellite imagery in ArcGIS, and in this blog we’ll introduce two new algorithms that perform time series change detection: Continuous Change Detection and Classification (CCDC), and Landsat-based detection of Trends in Disturbance and Recovery (LandTrendr). We know, it’s a mouthful, but hopefully this blog will help break it down.
Imagine a time series of imagery, where the history of a single pixel value over time can be graphed like the chart below. The CCDC and LandTrendr algorithms offer a way to analyze each pixel’s history to identify the times at which the pixel value’s behavior changed.

The CCDC and LandTrendr algorithms are relatively new in the image processing world, and highly relevant. They can help you answer the following questions using a stack of images collected over time:
- Has anything changed? When did the change start, and how long did it last?
- Was the change in the positive direction (e.g. forest recovery) or negative direction (e.g. forest disturbance)?
- Was it a slow change (e.g. plant regrowth) or an abrupt change (logging or fire)?
- How many changes occurred within a certain period?
Examples of CCDC and LandTrendr
The CCDC and LandTrendr algorithms are implemented in ArcGIS Image Analyst as geoprocessing tools, service tools, functions for Python programming, or in the Change Detection Wizard, and you can use these methods for all kinds of temporal analysis.
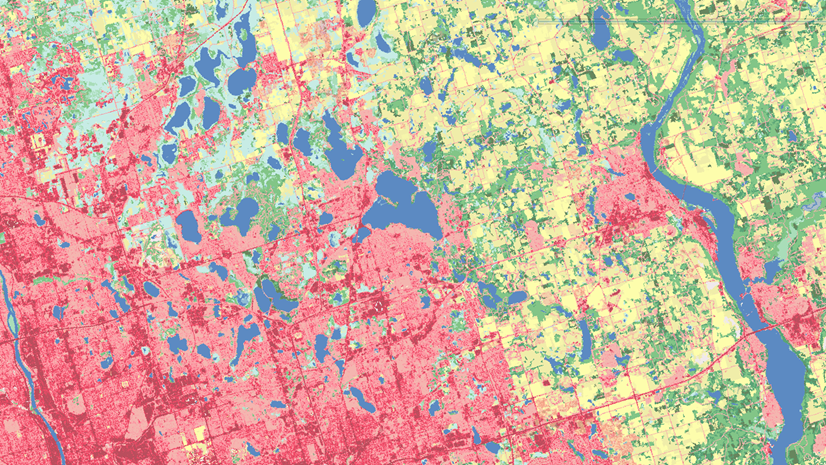
You might use CCDC to create land cover maps over time and find out when an area converted from forest to urban. The land cover map below was generated using the CCDC model results from 286 Landsat scenes from 2002 to 2020, and a land cover map was created for each scene. For more information, check out this video.

You might use LandTrendr to find out when illegal logging occurred in a protected forest area. The change map below is derived from running the LandTrendr tool on a stack of yearly Landsat scenes from 1984 to 2020. The results are overlaid on the imagery basemap for a large timber harvest region in the West Cascades Forest in Oregon. The pixel values show the date representing when logging occurred, and you can see both spatial and temporal harvest patterns. For more information, watch this video.

How does CCDC work?
The CCDC algorithm is based on a harmonic regression model that identifies abrupt changes (think forest fire, new construction, etc.) in pixel values over time, while accounting for long-term and seasonal change.
In the image below, a seasonal harmonic regression model is fitted to a single pixel’s values over time. when the pixel values cannot be modeled with one harmonic curve, a new curve will be established, and the break between the curves is a change.

The output from the CCDC tool is referred to as a change analysis raster, and it contains model information. With this, you can find out the number of changes, as well as the date of the largest, smallest, most recent, or oldest change, for every pixel in your stack of images.
You can also use the output to perform image classification, generating a time series of land cover maps.
For more information, see How CCDC Works.
How does LandTrendr work?
The LandTrendr algorithm is based on a segmentation of pixel value trajectories over time. Basically, each pixel value is graphed over time and fitted with a linear model, and different line segments indicate various parts of the pixel’s change story.
In the image below, a linear model is fitted to a single pixel’s values over time. At some point, there is a steep, negative change, then there is a longer, slower positive change.

The output from the LandTrendr tool is also referred to as a change analysis raster, and it contains model information like the start and end date of changes, and change duration and magnitude. With this, you can find out the number of changes experienced by each pixel over time, as well as the date of the fastest, slowest, largest, smallest, shortest, longest, most recent, or oldest change. You can even filter the results by the magnitude and duration of change.
For more information, see How LandTrendr Works.
What’s the difference between CCDC and LandTrendr?
Both CCDC and LandTrendr are used to detect changes and support time series image classification, but they are different. Make sure you’re aware of the differences before choosing a workflow:
- Data requirements: CCDC requires more data than LandTrendr to account for seasons. You’ll need imagery from all seasons, preferably at least one image per month per year. This CCDC can detect change in more fine temporal resolution because of the dense time series, however it also means more disk space and processing time. LandTrendr only processes one image per year, which means processing is faster and the size of output is smaller comparing to CCDC. However, the input imagery for LandTrendr should all be from the same season since the algorithm does not account for seasonality, and also the change detected is year, a coarse temporal resolution.
- Spectral information: LandTrendr models only a single band or an index when computing the change analysis raster, so it is only applicable when the change you are interested in can be modeled well using one band or one index. CCDC uses all spectral bands in the regression modeling, so it tends to detect more changes in more features.
- Filtering: You can filter the output from LandTrendr based on the magnitude of change, so you can perform thresholding right away to extract large or small changes. CCDC does not have this option.
For both CCDC and LandTrendr, data quality is important. Landsat Analysis Ready Data and Landsat Collection Level-2 data are the best options for these algorithms.
How do I use these algorithms?
You can run the CCDC and LandTrendr algorithms using geoprocessing tools, in the Change Detection Wizard, with raster functions, or using ArcGIS API for Python or ArcPy.
Using a multidimensional raster or image service, you’ll run the tools to create a change analysis raster, then create a change map or a time series of classified rasters.

The steps below outline the workflow using geoprocessing tools in ArcGIS Pro with the Image Analyst extension.
- Create a multidimensional raster out of your image stack, see this video for how (or read this blog).
- Run either the Analyze Changes Using LandTrendr tool or the Analyze Changes Using CCDC tool, depending on your desired outcome. The output is a change analysis raster.
- A: Run the Detect Changes Using Change Analysis Raster tool with the change analysis raster to generate a date-of-change map, or
B: Use the change analysis raster to perform image classification:- Define classes and collect training samples
- Train a classifier using Random Forest or Support Vector Machine methods
- Run the Classify tool on the change analysis raster to generate a classified multidimensional raster
- Optionally, use the Compute Change tool to see the differences between any two dates in the time series. You may also use the Summarize Categorical Raster tool to compute the summary statistics across time.


Article Discussion: