Gerardus Mercator was a 16th Century map genius. He did many things but arguably his biggest legacy is the invention of a map projection that bears his name, the Mercator projection. The projection has become widely used, not least as Web Mercator for web mapping. Yet it is also the bane of cartography because of the distortions it exhibits. In this blog I’ll review a little of why the Mercator projection can be useful, then explain how you can do away with it altogether when you need a far more suitable projection for your web map.
What is it good for…?
Mercator’s 1569 world map used his new cylindrical conformal projection, meaning it’s rectangular in shape and preserves angles across the map. That results in you being able to plot straight lines on the map and use them to give a bearing.
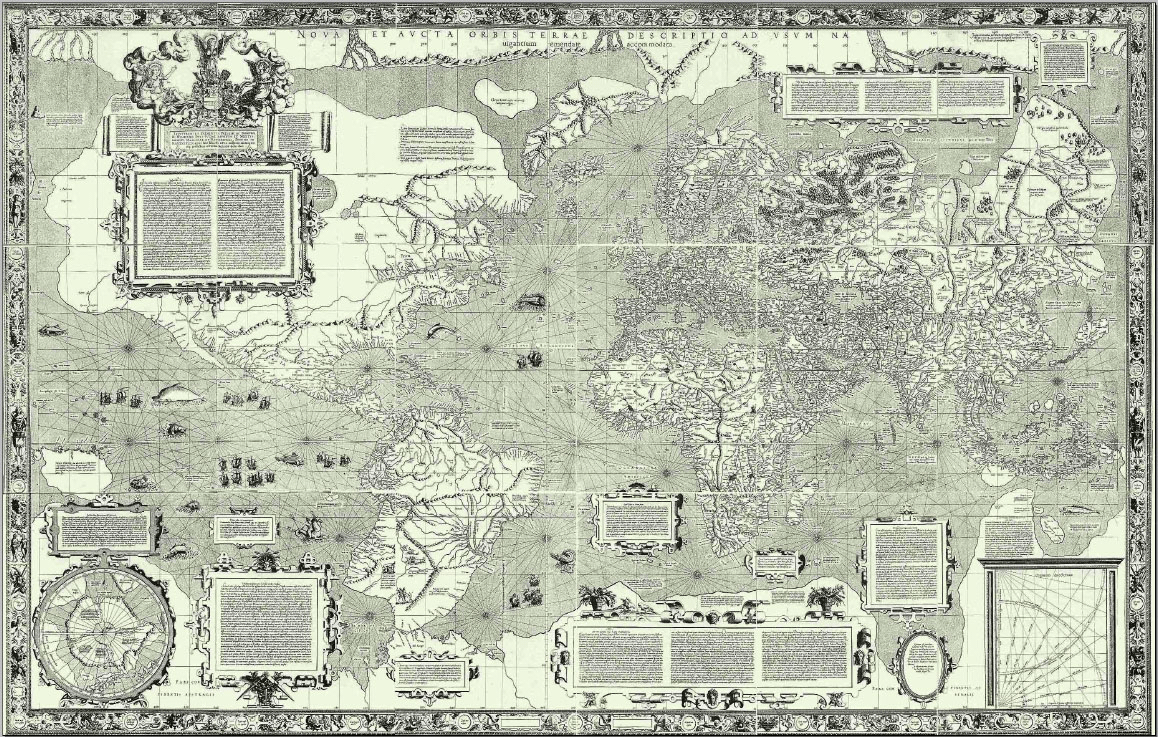
The map was titled “Nova et aucta orbis terrae description ad usum navigantium emendate et accomodata” which translates as “new and improved description of the world amended and intended for the use of navigators”. Mercator made the map for navigation, and the underlying projection supported that purpose perfectly. He didn’t make the map projection for any other purpose. It’s a great projection for navigating.
One consequence of the projection is that it grotesquely exaggerates northern and southern latitudes, warping the size of places relative to one another. Yet despite this weird view of the world, presented almost as a square, curiously it has become the view of the world we often see on school walls, in news media, and web maps.
Debate over its utility is nothing new. In 1943, the New York Times stated that, “We cannot forever mislead children and even college students with grossly inaccurate pictures of the world.” So why is it so often used? Well, if you use the projection often enough people will believe it to be the de facto view of the world. They become challenged by seeing the world presented using other projections. And, of course, the huge revolution in mapping that the internet has supported has done its fair share to further embed the Mercator projection into our daily psyche.
Web Mercator became the default web map tiling scheme for good reason – it was relatively simple to build a seamless, zoomable web map. Conformality meant that shapes were maintained and distortion was relatively low at large scales when zoomed in. The reason Web Mercator was suitable as the basis for early web mapping is that it creates a convenient square shape for the entire world if it is truncated at approximately 85° North and South of the Equator. Wherever you are on the map, up is due north, down is due south and west and east are always left and right. At large scales, conformality means square buildings remain square. This creates an attractive consistency from a software engineering perspective and avoids some of the confusion that sometimes comes with other projections.
Absolutely nothing…
So, Web Mercator is quite serviceable, particularly for large scale maps, or for regional mapping. But for small scale maps it is virtually useless. For instance, on a world map, Ellesmere Island in the Canadian arctic is shown approximately the same size as Australia. It isn’t. It’s 75,767 mi² in size and has a population of 146. Australia is 2.97 million mi² and has a population of 24.6 million.
It’s also pretty much useless if you want to compare things across a map, and the smaller the map’s scale the bigger the problem. If you want to compare the Norwegian capital city of Oslo, at 59.9139° N with Singapore, at 1.3521°N you’ll find that Oslo appears 75% larger than Singapore at the same map scale.
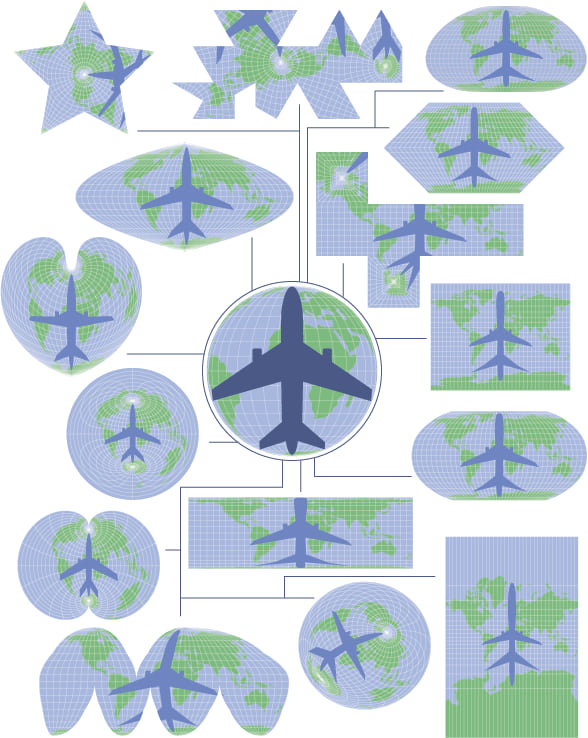
Here’s page 27 from my Cartography book (you’ve got a copy already right?) which shows how a common shape is modified through re-projection. And there’s Mercator in the bottom right. I wouldn’t get on a plane shaped like that.
Huh? Say it again? How can these distortions be allowed?
To be fair, there are distortions in every map projection because it’s impossible to convert a curved spherical (or ellipsoidal) surface to a flat plane without some squashing, stretching, or ripping. But the point here is to embrace the fact that distortions exist, and use a map projection that suits your map. If you’re printing a map it’s simple. Make the map using whatever projection you want, then send it off to the printer which, hopefully, won’t re-project it to Mercator. But it’s not quite as simple when publishing web maps.
Ordinarily, if you publish features or tiles to be displayed in a web map it’ll likely be using Web Mercator, with all the inherent distortions whether you like it or not, and 99% of the time you most likely absolutely should not like them. Yet there they are. But the problem is compounded because of the people reading your map. The vast majority of people looking at your map (let’s say 99%) will be unaware of the distortions in the map which translate into visual biases as they try and interpret what they’re seeing. They will not even know that they are seeing things out of scale, relative to one another. So they are being misled. Which places an important additional requirement on you as the map maker – do not use Mercator, or Web Mercator for small scale maps or for any map where you are overlaying thematic content where visual comparison is crucial to interpretation.
Instead, you need to use a projection with an altogether different property. Equal area projections are your best friend because they do not possess the same distortions and support visual comparison from place to place across the map. There is no exaggeration of sizes of one place to another. Perfect. So if I’m making a thematic web map, how do I do this? OK, I’m getting to that bit…hold on a moment longer. First we need a good case study to demonstrate the methods.
A cartographer’s nightmare
Fortunately there are a few of simple methods to banish Web Mercator from your maps forever and I’ll explain them using the recent 2019 Canadian general election data. Canada is a cartographer’s nightmare. It has a huge landmass that extends across a large north-south extent which sits squarely in the Web Mercator zone of highest distortion. It also has vastly differing population densities across its area from a more densely populated south to an increasingly sparse population in the north. Nearly 90% of the Canadian population live within 100 miles of the border with the United States.
Here’s the results of the general election, showing the 338 Electoral districts, using Web Mercator as the underlying projection.
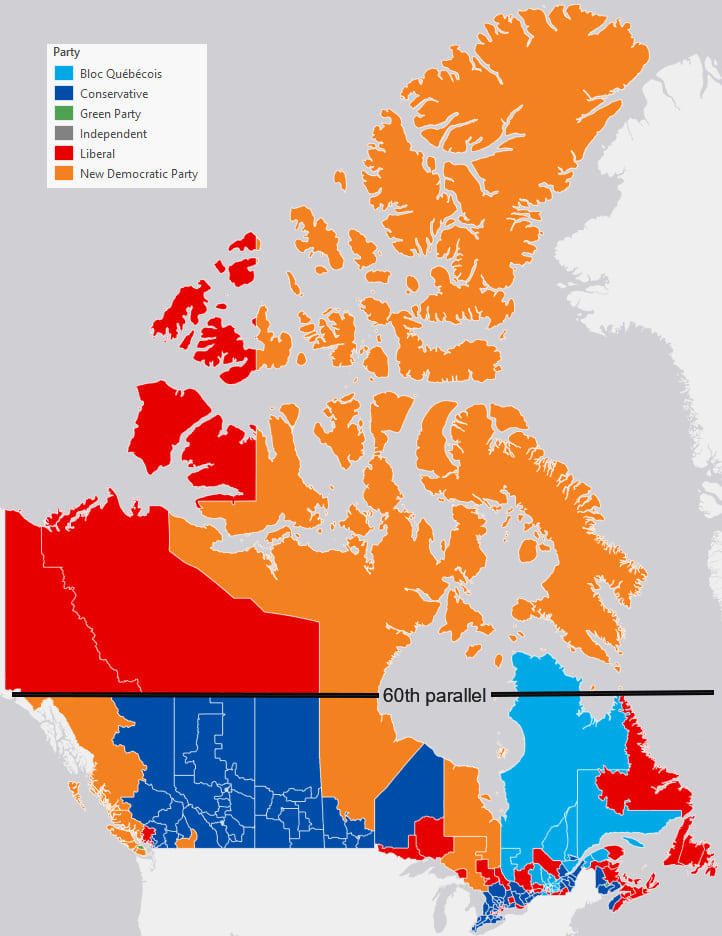
So how would someone likely read this map? I see a lot of orange. In fact, Orange is the predominant colour and covers 52% of the map. Red is second at 28% coverage. The darker blue covers 13% and the lighter blue covers 7%. The green and independent parties don’t even show up at this scale (hooray for multiscale web maps!).
Would it therefore surprise you to learn that out of the 338 Seats only 24 were won by New Democrats, the party shown in orange? They only had the fourth largest number of seats and took only 7% of the seats. The Liberals (red) won with 157 seats. The Conservatives (darker blue) came second with 121 seats. So the map is lying to you. The most prevalent colour on the map does not represent the winning party. And that’s a ridiculous message for the map of results to lead the reader towards.
What’s more, because of the huge population disparities only 3 seats are voted for in Yukon, NW Territories and Nunavut. Everything above the 60th parallel of latitude on this map (the top three-quarters of the map) is represented by 3 seats. The remaining 335 are voted on by people living below the 60th parallel. So let’s at least have the courtesy to display the map using an equal area projection. Here’s the map shown using the Canada Albers Equal Area Conic projection.
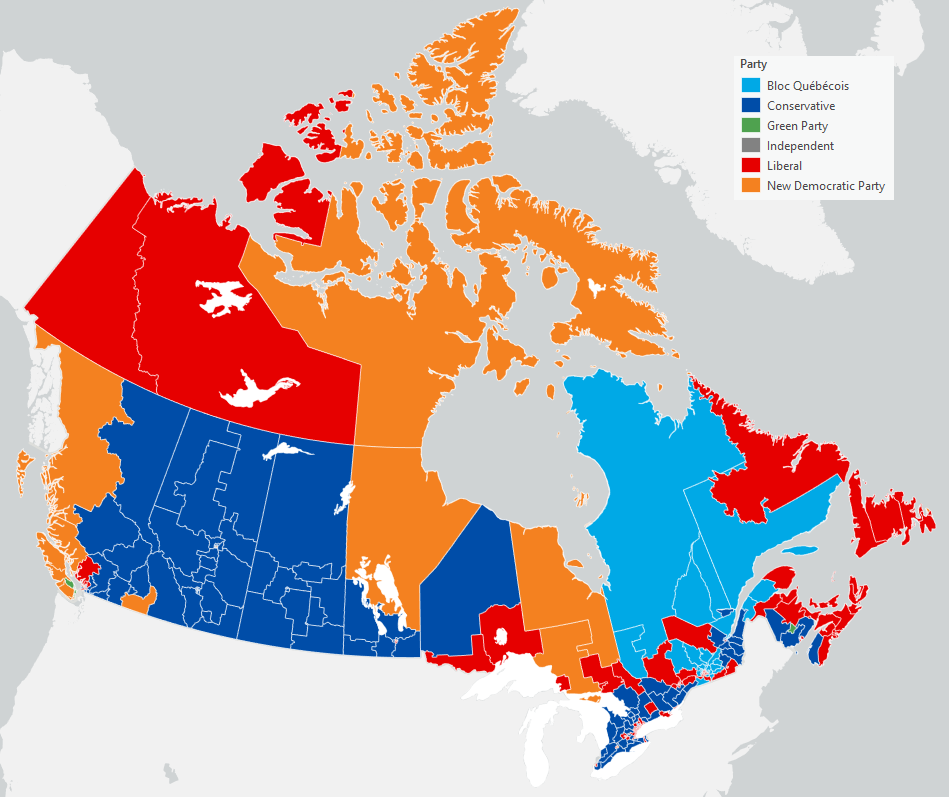
So much better already. Those horrible Web Mercator distortions are gone. That overbearing swathe of red and orange above the 60th parallel of latitude has disappeared. Areas are now correctly sized to one another. This is a more truthful map. But an even more truthful map would reveal something of the distribution of the population and how it maps onto the availability of seats because there’s still an awful lot of colour representing sparsely populated areas.
So let’s turn these static maps into web maps to demonstrate the alternative ways in which you can publish using anything other than Web Mercator, and at the same time illustrate a few alternative maps.
Escaping Web Mercator method 1: Vector Tiles
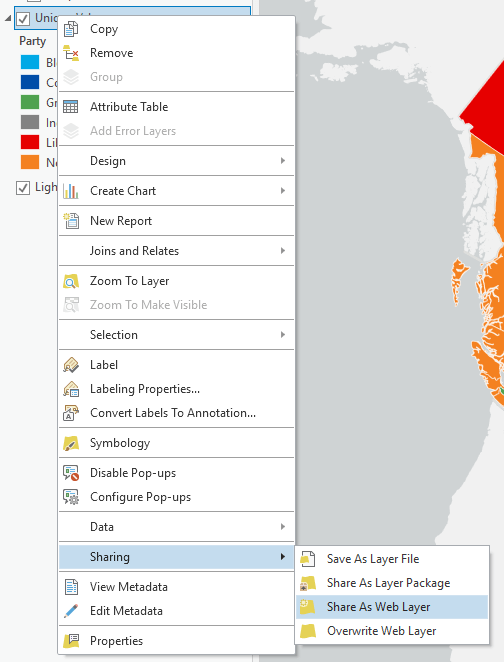
The first step is easy. You make the map in whatever projection you want in ArcGIS Pro. Then you publish your map using Vector Tiles. Simple. There’s really not much detail to the process but you can publish data to vector tiles in one of two ways, either right-click the layer you want to publish, go to Sharing and then Share As Web Layer.
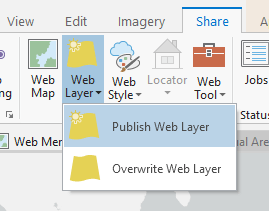
Alternatively, if your map contains multiple layers, select Web Layer > Publish Web Layer from the Share ribbon.
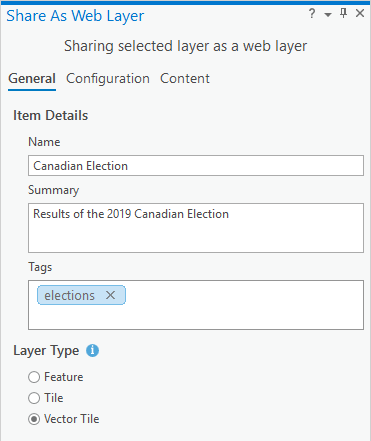
The Share as Web Layer pane will open, and it’s then just a few clicks to configure your map. Give it a name, add a short summary and tags and then select the Vector Tile radio button.
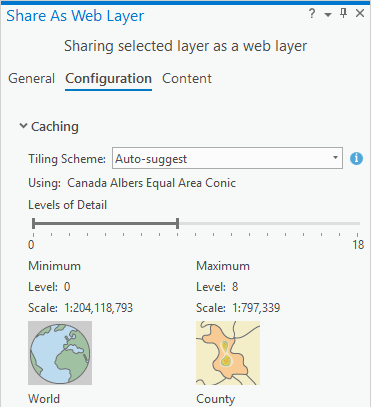
On the Configuration tab, you’ll see that the Tiling Scheme will be pre-populated to match your map’s projection. Just leave it pretty much as it is, and simply select the levels of detail you want. Remember, there’s no point publishing your map to a really large scale if neither the data or purpose support it.
Hit publish, go grab a coffee, then come back to ArcGIS Online, log into your account and open your Hosted Tile Layer service in the Map Viewer. Job done! And you can then configure the web map as you want.
So here’s a web map of the 2019 Canadian election results which uses the Canada Albers Equal Area Conic projection. You can get the full screen version here.
Of course, one of the things you may want to add to your web map is another layer to drive some popups. Design them in ArcGIS Pro, and then change the fill and outline of your features to have no colour. Publish this as a feature service, add to your web map and they will automatically re-project to your non-Web Mercator vector tiles. If you click on the web map above you’ll see the popups, which also use colour coding for each winning party. This is important because the use of colour, especially for political parties, differs across the globe and can mean quite different political leanings.
This map also modifies the view of the results by varying transparency based on population density. As population density becomes increasingly sparse, so the colour is increasingly transparent. It has the visual effect of receding (the technique is called value-by-alpha). Those areas with higher population densities come into focus and appear brighter. So this map more truthfully promotes the places where people live (and vote) rather than the unique values maps which treats geography as homogenous areas with a mutually exclusive block fill of colour according to who won that area.
Finally, notice I’m not using a basemap. That’s because thematic maps are their very own basemaps in many situations. I’ve published all I need directly from ArcGIS Pro so there’s no reliance on standard basemaps which will have been published in Web Mercator. Trying to warp them to your projection will work, but it will warp any burnt in labels as well.
And Vector Tiles aren’t a one-trick pony so here’s a completely different type of map, a waffle grid, along with labels for Territories, Provinces and Cities that was published as a single Web Layer from ArcGIS Pro. It’s based on this map made by Laris Karklis of The Washington Post. Full screen here.
Escaping Mercator Method 2: Raster Tiles
There’s going to be occasions where you create an interesting thematic map which the ArcGIS Online renderer will not support. You may also want to embed annotation into your map or add other graphical marks and effects that simply aren’t supported. For instance, on the map above the labels are all aligned horizontally but I might want them curved to the graticule to emphasise the projection being used. Design them as you wish in ArcGIS Pro then we’ll use a slightly different publishing approach.
For this circumstance we simply revert to a technique that’s been possible pretty much ever since ArcGIS Online was born, and which can be implemented from ArcMap should you still be using that (are you? can I suggest you make the move to ArcGIS Pro?). It simply bakes everything on your map into a set of raster tiles.
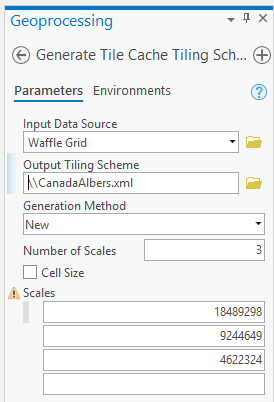
Once you’ve made your map using whatever projection you deem fit for your purpose, and whatever weird and wonderful mapping techniques, labeling and anything else you’re ready to publish. Use the Generate Tile Cache Tiling Scheme Geoprocessing tool to create a small xml file that captures your map’s projection and scales for publishing. Decide how many scales you’ll want the map to be viewed at. For this, just 1:18 million down to 1:4 million should suffice.
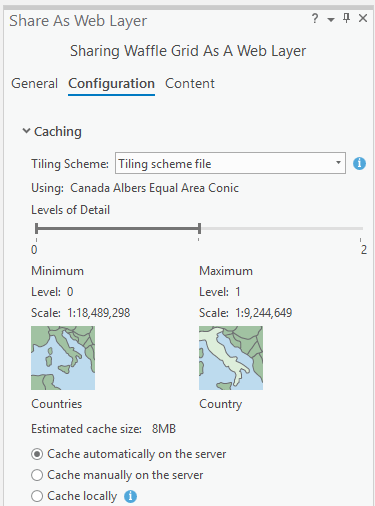
Then, as before Share as Web Layer but make a couple of adjustments. Select Tile (not Vector Tile) and on the Configuration tab, select Tiling Scheme File in the Tiling Scheme dropdown. Point to the xml file you created earlier and the projection information and scales are loaded. Then hit Publish.
Once your raster tiles have published, head on over to your ArcGIS Online account, open the Hosted Tile Layer in the Map Viewer and boom! There’s your map.
Here’s a dot density web map that includes not only the winners, but all the other votes for parties that had at least a 1% share. At this scale 1 dot = 100 votes and shows the mix of colours. The way I made the map is not currently supported in ArcGIS Online yet here’s the map, in ArcGIS Online. Adding a popup using the same approach as before (invisible symbology, published as a hosted feature layer) brings your slippy raster tiles to life.
The benefits of this approach are that it’s a terrific backup for anything that’s not supported in ArcGIS Online and you can still make your map look the way you want with ANY projection. The drawback is that everything is baked into the map so if you want components of your map to change at different scales (e.g. annotation sizes) then that has to be built into your map’s design in ArcGIS Pro. When each of the scales of raster tile are built, it uses the specifications you set for that scale in ArcGIS Pro (or ArcMap). Full screen here.
Escaping Mercator Method 3: Cheat
So the inevitable question remains – what if you neither have, nor want to use ArcGIS Pro (or ArcMap) to publish your maps into a non-Web Mercator projection? I’m led to believe there are some who prefer working in this way. Well, until* ArcGIS Online supports user-defined re-projection of your own data from within the web browser itself the only way you can go the non-Mercator route is by hunting for a hosted tile layer that someone else has published which you can then use to put your own content on top. This all depends on tags.
For instance, I’ve published a basic version of the Canada basemap I used for the above maps without any thematic content. I added the tag ‘Albers’ so if you search for ‘Albers’ in ArcGIS Online you’ll find the basemap. It’s just a blank map:
But you can then use your own data, or another dataset you found in ArcGIS Online and create a new map of that data in a more appropriate projection that Web Mercator. Here’s a set of soil types from the Living Atlas re-projected onto the basemap.
Ditch Web Mercator – your map readers will thank you
Well, they likely won’t thank you but unless they’re firing up ArcGIS Online to navigate the Atlantic Ocean on a small raft and they need a map projection that gives them bearings, they’ll be looking at a better map.
Put simply, Web Mercator kills thematic maps. Its gross distortions affect people’s ability to decipher what they are seeing. You cannot effectively display unique values, choropleth maps, or dot density using Web Mercator. Neither can you overlay regularly tessellated shapes (squares, hexagons, triangles) or non-tesselating symbols used for binning (e.g. circles) on top of Web Mercator because the actual land area underneath each shape of the same size will decrease massively the further you get away from the equator. Using an equal area projection will solve this problem in one simple step.
Remember, where projections are concerned there’s really no good default. Every map should be considered on a case by case basis depending on where in the world you’re mapping, the scale, purpose and content. It’s really not acceptable to think of Web Mercator as the web map default any more. Esri’s projection engine is integrated inside ArcGIS Online which supports the publishing of non-Web Mercator maps. If you’re unsure on which projection to choose then Projection Wizard will really help you. These two videos will also help get you up to speed with Coordinate Systems and Map Projections.
The ArcGIS Pro documentation ‘Author a map for vector tile creation‘ gives you further details on the additional possibilities that vector tiles afford.
It’s no longer hip to be square. Let’s raise the standards of our web maps, and particularly our thematic web maps because it is possible to re-shape your maps using any and all projections, and it isn’t difficult. Once you’ve made your web map in your new shiny non-Web Mercator projection it’s also supported in all your favourite apps like Web Appbuilder and Story Maps.
Happy non-Web Mercator mapping!
Thanks to Craig Williams and Bojan Šavrič for helping me with data and advice.
* – I’m not hinting at this support coming any time soon but the best way to request this (or any) feature is to add requests to our ArcGIS Ideas site here.

Commenting is not enabled for this article.