ArcGIS Velocity allows organizations to ingest, visualize, analyze, and act on observational data from sensors and devices, IoT platforms, and real-time APIs. It also enables analytics against high-volume data accumulated over time so that you can gain insights into patterns, trends, and anomalies. Remote monitoring of assets, predictive maintenance, and process optimization are a few of the benefits you can obtain from IoT data.
ArcGIS Velocity is updated regularly, below is a quick overview of some highlights in the April 2021 release:
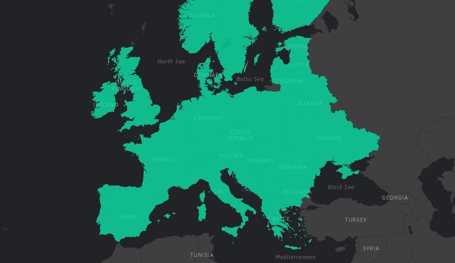
- European region hosting – ArcGIS Velocity subscriptions can now be hosted in Europe in addition to U.S. -based hosting. The deployment region can be selected as part of ordering a Velocity subscription.
- Feeds and data sources – Support has been added for Verizon Connect Reveal, and the HTTP Poller feed type has been enhanced to support OAuth 2.0 authentication mechanisms.
- Analytics – Two new real-time analysis tools, Detect Gaps and Control Event Volume have been added, and Generalized Linear Regression is now supported for big data analytics.
- Outputs and data management – Spatiotemporal feature layers hosted in ArcGIS Velocity now support the definition and creation of feature layer views. Additionally, real-time analytics can now store output data in feature layers hosted as part of the organization’s ArcGIS Online subscription.
Now, let’s take a deeper dive into each of these exciting new enhancements!
General
ArcGIS Velocity subscriptions can now be hosted in Europe in addition to the United States. When submitting an order for an ArcGIS Velocity subscription, you can now choose Europe as the deployment region. Velocity subscriptions hosted in Europe will perform all data ingestion and processing in Europe.

If you store output data to spatiotemporal feature layers (the default), the data will be stored in Europe. If you store output data to feature layers hosted by your overall Online subscription, data will be stored in the same region as your ArcGIS Online subscription. ArcGIS Online item metadata is still stored in the US region.
It’s important to note that your ArcGIS Velocity subscription does not have to be in the same region as your ArcGIS Online subscription.
Feeds and data sources
A feed is a real-time stream of data coming into ArcGIS while a data source loads stored data for use in a real-time or big data analytic. Integrating with popular data and messaging platforms is one of the key capabilities of Velocity.
In this release, Verizon Connect Reveal has been added as a supported feed type. Organizations with fleets equipped with Verizon Connect Reveal devices can configure Velocity to receive the GPS push messages from the Verizon API.
The HTTP Poller feed type has been enhanced with OAuth 2.0 authentication support. This includes separate and configurable access token and refresh token paradigms, and broadens support for bringing in data from many vendor and data provider APIs.
Additionally, the Azure Blob Store and Amazon S3 data sources now support the ability to ingest only files that are new since the last analytic run. This capability can be leveraged in scheduled big data analytics to retrieve new information being written to these cloud stores by external systems.
Analytics
With real-time and big data analytics, you can gain insights from IoT data – detect incidents and anomalies, find relationships between different data streams, and uncover patterns over time.
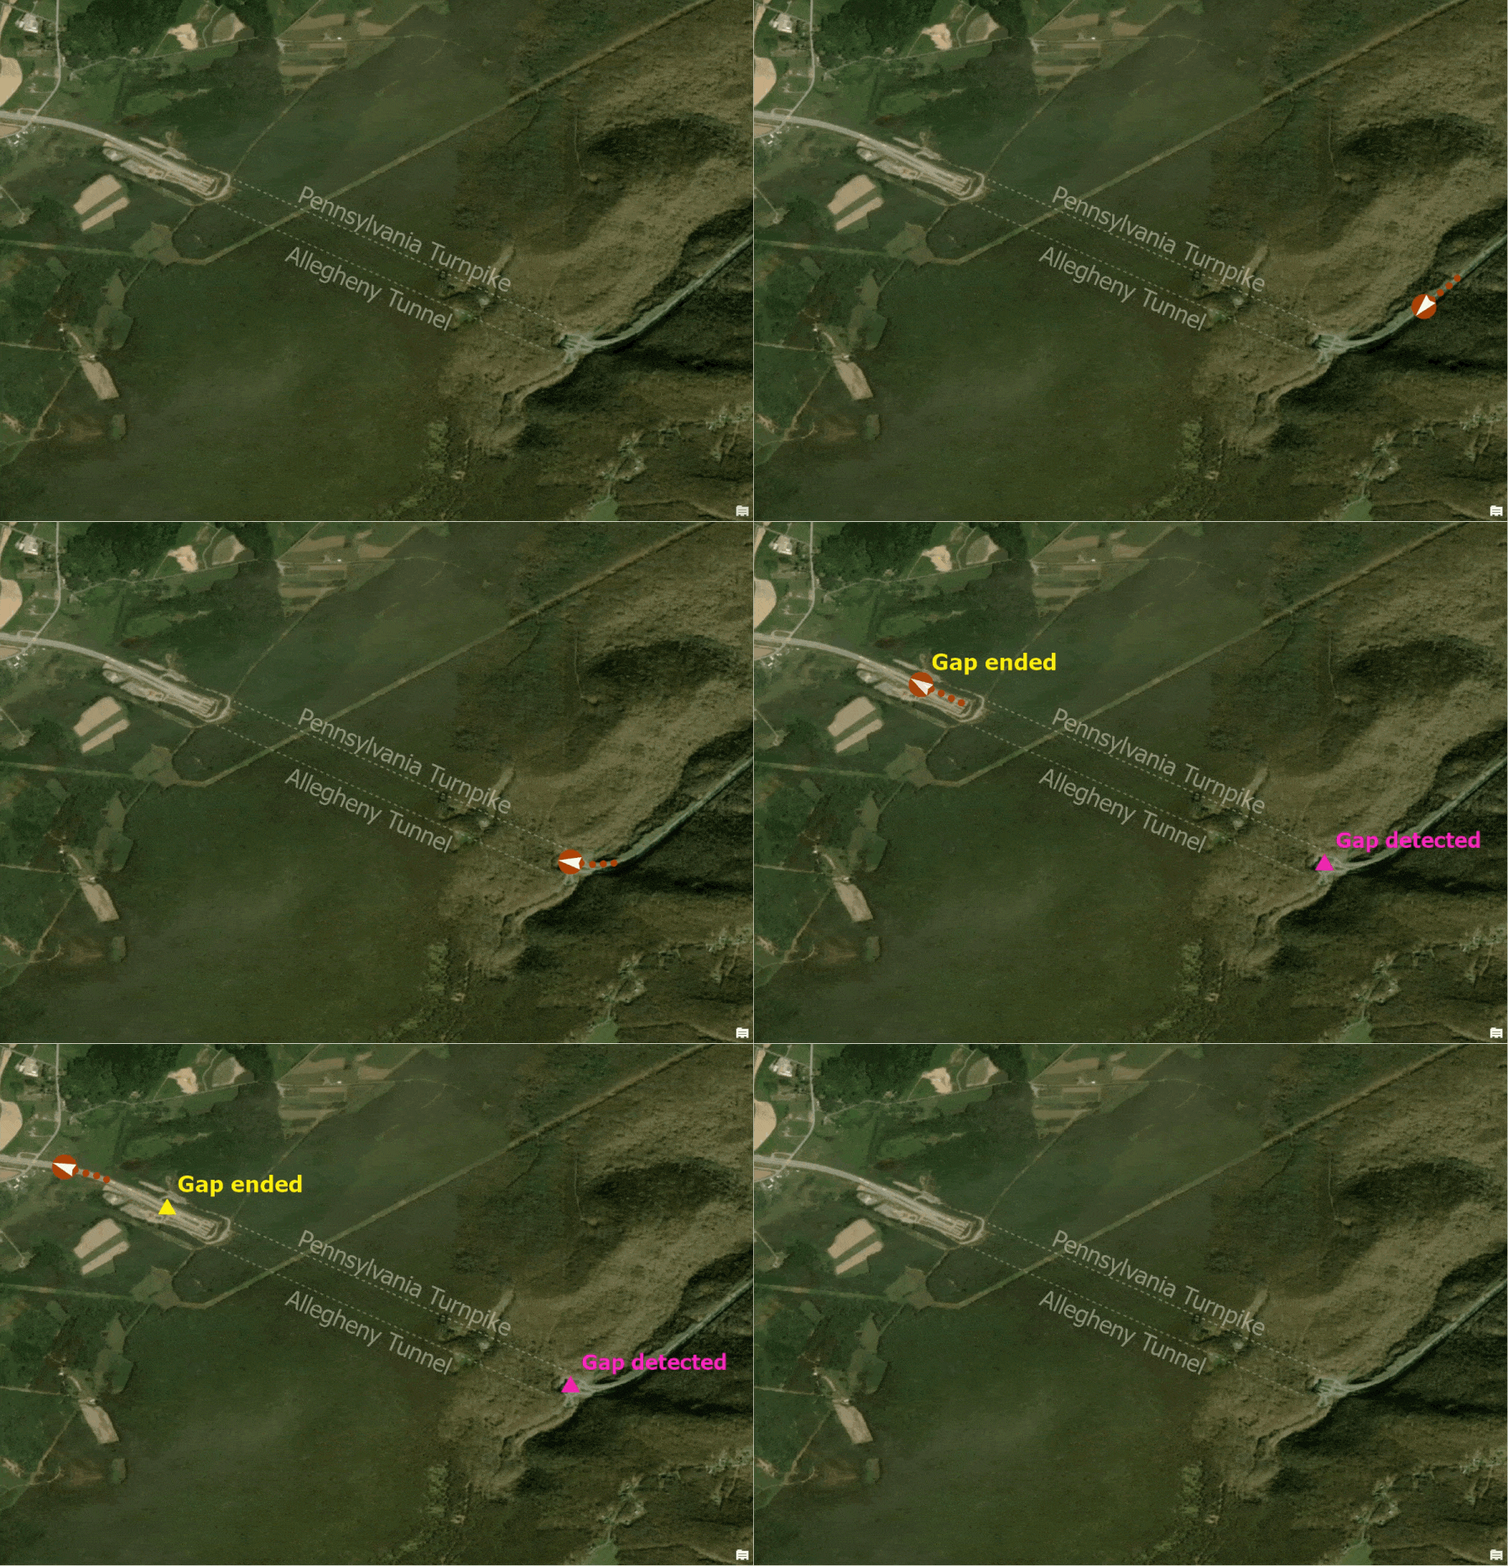
The April release includes two new real-time analytic tools: Detect Gaps and Control Event Volume. Detect Gaps performs stateful real-time analysis and can be used to detect when any unique asset, vehicle, or device has stopped reporting observations, given a specified gap duration. This can be useful in understanding when a fleet vehicle has lost service, or if there is another problem at hand.

Control Event Volume can be used to filter observations for the same Track ID such that only a given number of events will be emitted over a specified time interval. This tool can be paired with output email or text notifications to avoid over-reporting on an ongoing incident, such as when a driver is speeding or when a utility network device is reporting readings above or below a given threshold.
Support has also been added for Generalized Linear Regression in big data analytics. Generalized linear regression enables you to model a dependent variable in terms of its relationship to a set of explanatory variables. Once a satisfactory model has been created, the tool can be used to generate predictions on new information.
Outputs and data management
An output is a result or action to be taken as a final step in a real-time or big data analytic. In ArcGIS Velocity, analytics can emit data to a variety of different destinations, including storing data to a feature layer, sending an email or text alert, and pushing to a third-party system for device actuation.
In this release, a new output has been added to support pushing data to an Azure Event Hub. This enables you to leverage the power of ArcGIS for location-based incident detection and visualization, and to also route output events to other Azure services.
Additionally, real-time analytics now support writing output data to feature layers hosted by your ArcGIS Online subscription, if you need to leverage advanced data management capabilities supported by hosted layers. Writing data to hosted feature layers has outgoing data rate considerations, for more information see the Feature Layer output documentation.
And more…
For a complete list of enhancements with more details, check out the what’s new topic in the documentation.
To learn more about Velocity, check out the available resources for product videos, quick lessons, documentation, and more!


Article Discussion: