ArcGIS Velocity allows organizations to ingest, visualize, analyze, and act on data from sensors. It also enables processing of high-volume historical data to gain insights into patterns, trends, and anomalies. Remote monitoring of assets, predictive maintenance, and process optimization are a few of the benefits you can gain from your IoT data.
ArcGIS Velocity is updated regularly, below is a quick overview of some highlights in the December 2020 release:
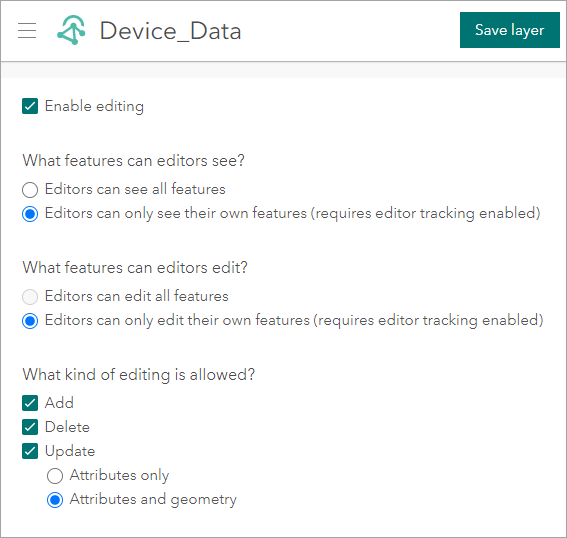
- General – Feature layers hosted in ArcGIS Velocity now support ownership-based data access and control including varying the types of allowed edits.
- Feeds, data sources, and outputs – SASL PLAIN is now supported as an authentication method for Kafka, and Feature JSON and GeoJSON have been added as supported formats for many output types.
- Analytics – Real-time analytics now support stateful processing for a variety of tools including enter/exit geofencing.
Now, let’s take a deeper dive into each of these exciting new enhancements!
General
In this release spatiotemporal feature layers have been enhanced to support more of the same capabilities as hosted feature layers, in this case ownership-based data access and control. Editor tracking was added in the August release, and now you can configure permissions for editors such as whether they can view and edit all features (or only their own) as well as editing actions (Add, Update, Delete). See Data access and editing for more details. These capabilities will be followed by support for feature layer views in the next release, so that you can create different views of your data and share to stakeholders as needed.

Additionally, visualization options for the map image layer continue to be expanded. There are additional rendering options for when the dynamic aggregation switches over to raw features. Class break rendering for raw features now supports natural breaks, equal interval, standard deviation, and quantile. For more information, see Visualize map image layers.
Feeds, data sources, and outputs
A feed is a real-time stream of data coming into ArcGIS while a data source loads stored data for use in a real-time or big data analytic. Integrating with popular data and messaging platforms is one of the key capabilities of Velocity.
With this release, the Kafka feed type has been enhanced with authentication support (SASL PLAIN). Kafka is an open-source distributed streaming platform that enables publishing and subscribing to a stream of messages, and can handle very high velocity data streams.
There’s also been a variety of logging improvements for feeds and data sources. For example, when polling a website or a RSS feed, logs are now captured with information about each request, how long the request took, and how many event messages were received.
An output is a result or action to be taken as the final step in a real-time or big data analytic. Analytics can emit data to a variety of different destinations, including storing data to a feature layer, sending an email, writing to a cloud store, and pushing to a third-party system for device actuation. For the December release, Feature JSON and GeoJSON can now be set as the format for the following output types: Azure IoT Hub, Azure Blob Store, Amazon S3, Kafka, and RabbitMQ.
Analytics
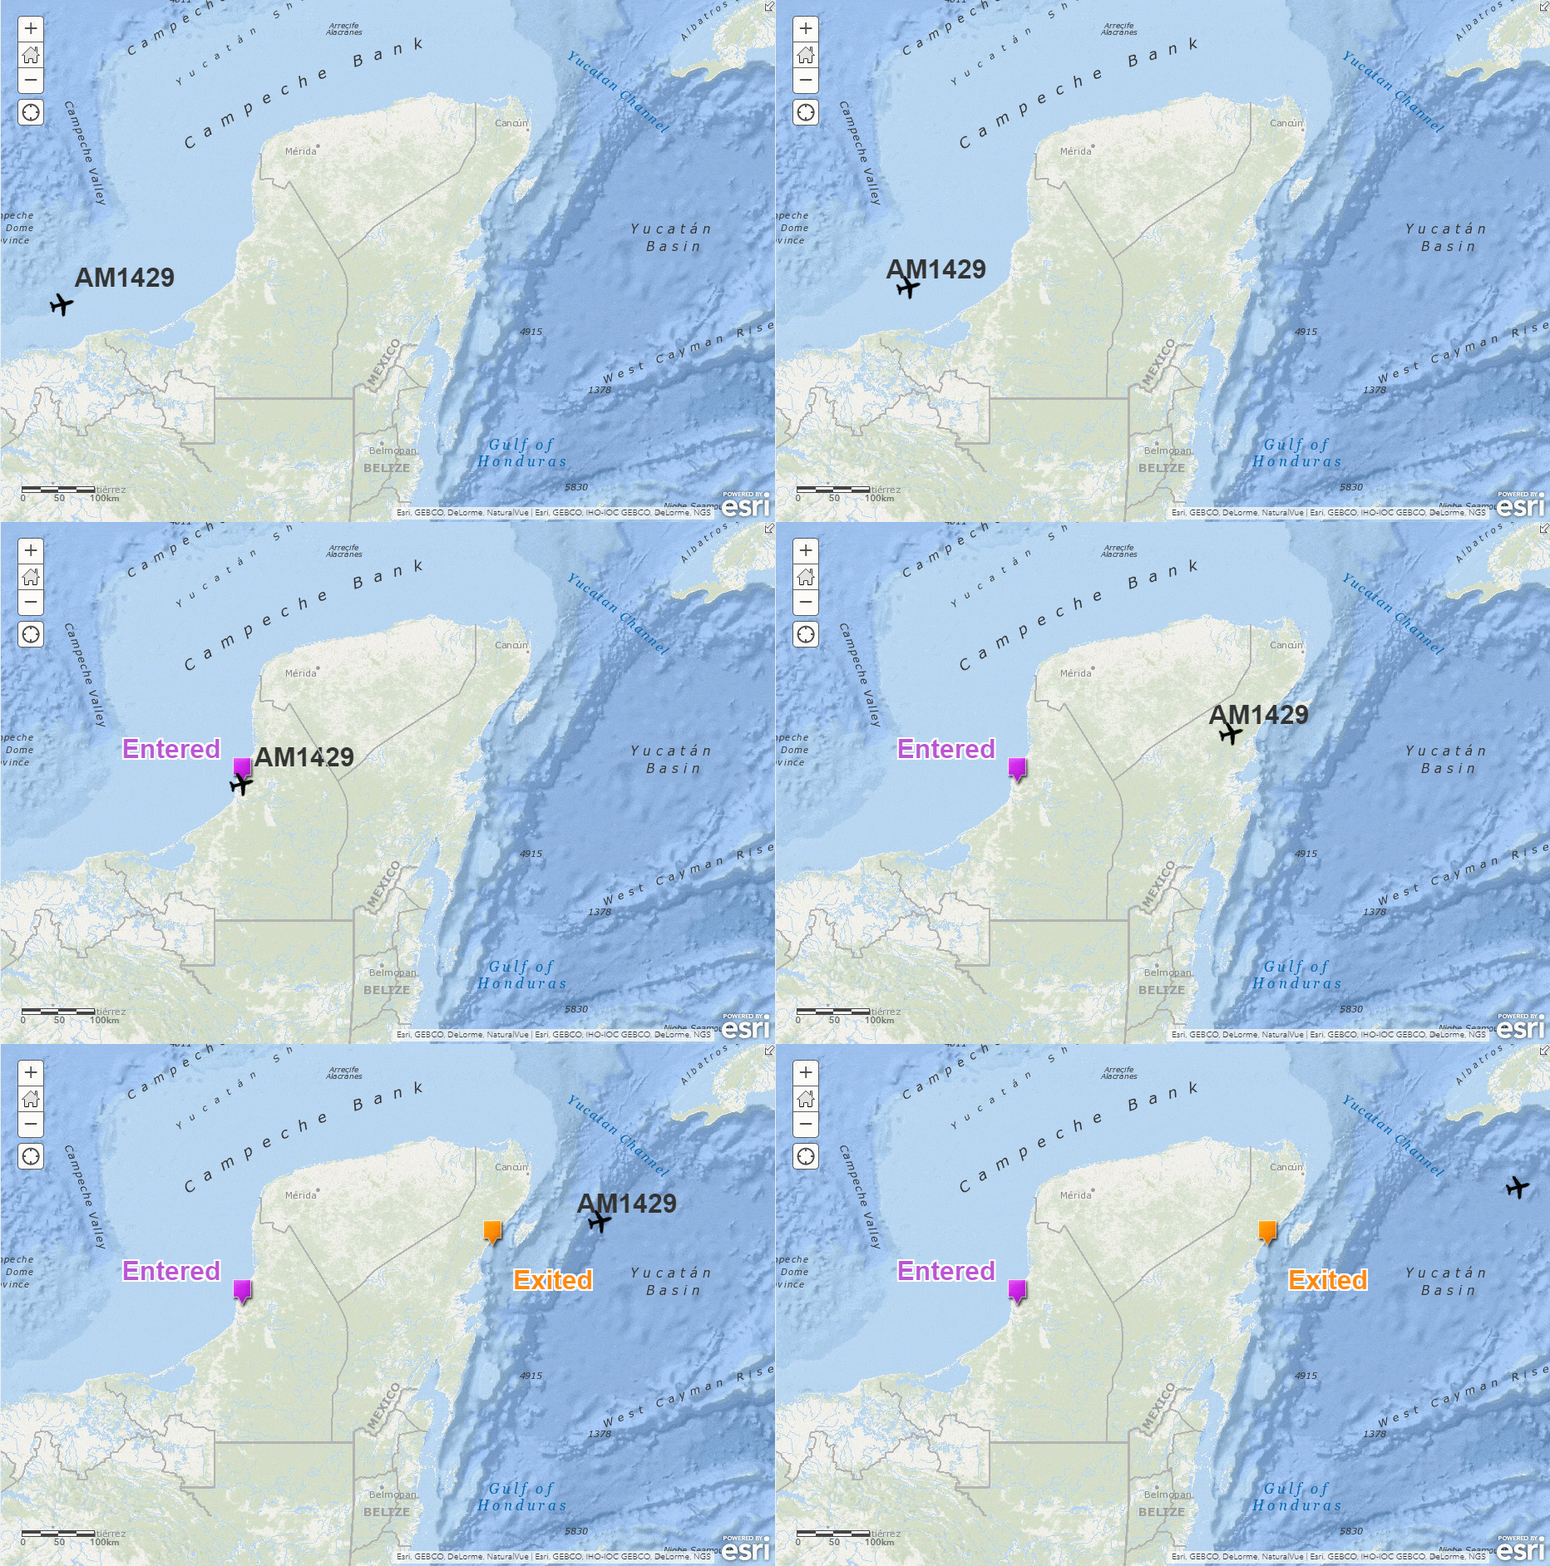
With real-time and big data analytics, you can gain insights from IoT data – detect incidents and anomalies, find relationships between different data streams, and uncover patterns over time. In this release, we’re excited to announce that real-time analytics have been enhanced to support stateful processing. Stateful real-time analysis allows detection of changes from prior observations of an individual track, while data is actively streaming. One of the most common applications of stateful real-time analysis is detecting an enter or exit to a geofence:

There are four new stateful tools/capabilities for real-time analytics:
- Enter/exit for Filter by Geometry – Spatial filtering (geofencing) can now be configured to set the spatial relationship to enter or exit, allowing you to isolate when an asset is arriving or leaving an area of interest.
- Enter/exit for Join Features – You can also set enter or exit as the spatial relationship for Join Features. Join Features can be used as an enrichment tool to tag an event with an area or feature of interest such as tagging a ship observation with the maritime area in which it’s located.
- Calculate Motion Statistics – Using this tool you can enrich asset data with information like speed, distance traveled, acceleration, and more.
- Detect Incidents – With stateful processing support, you can go beyond evaluating each message as it comes in and define overall incidents to identify, even with different opening and closing conditions. For example, opening an incident when a vehicle engine sensor reports a problematic value and closing the incident if the reading returns to normal or the vehicle returns to the home facility.
And more…
For a complete list of enhancements with more details, check out the what’s new topic in the documentation.
To learn more about Velocity, peruse the available resources to access product videos, quick lessons, documentation, and more!


Article Discussion: