ArcGIS Velocity allows organizations to ingest, visualize, analyze, and act on data from sensors and asset tracks. It also enables processing of high-volume historical data to gain insights into patterns, trends, and anomalies. Remote monitoring of assets, predictive maintenance, and process optimization are just a few of the benefits you can gain from your sensor and IoT (Internet of Things) data using Velocity.
ArcGIS Velocity is updated regularly, below are several highlights of the February 2023 release:
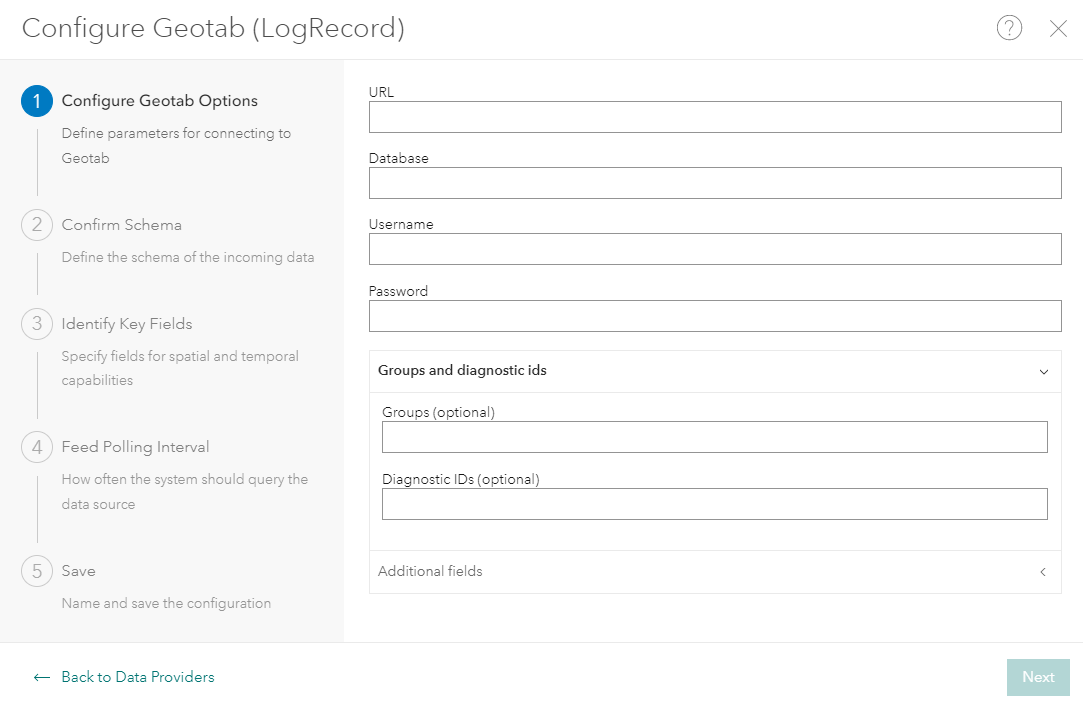
- Feeds, data sources, and outputs – A new Geotab (LogRecord) feed type is available, allowing you to periodically poll a Geotab LogRecord database table for real-time automatic vehicle location (AVL) data.
- Analytics – Easily sample and visualize your real-time data, per node, in your running real-time analytics.
- General – Access more information about your ArcGIS Velocity subscription.
Now, let’s take a deeper dive into each of these and other new capabilities and enhancements in this release!
Feeds, data sources, and outputs
There were several enhancements with feeds, data sources, and outputs for this release. The first being a new Geotab (LogRecord) feed type, allowing you to periodically poll a Geotab LogRecord database table for real-time automatic vehicle location (AVL) data by sending an HTTP request to a specified URL. This has been a frequent request from you, our users, since this particular database table provides an additional source of positional data that includes more thorough movement information of the vehicles you’re tracking.

With the release of this new feed type, the existing Geotab feed type available in Velocity has been renamed Geotab (DeviceStatusInfo). It periodically polls the Geotab DeviceStatusInfo database table for real-time automatic vehicle location (AVL) data by sending an HTTP request to a URL you specify.
Next, for data sources, the Amazon S3 and Azure Blob Storage sources can now load data from nested subdirectories, making it possible to ingest data from an increased variety of data organization strategies in cloud stores.
And lastly, basic authentication support was added to the HTTP output. This authentication type is already supported in the HTTP feeds and data sources.
Analytics
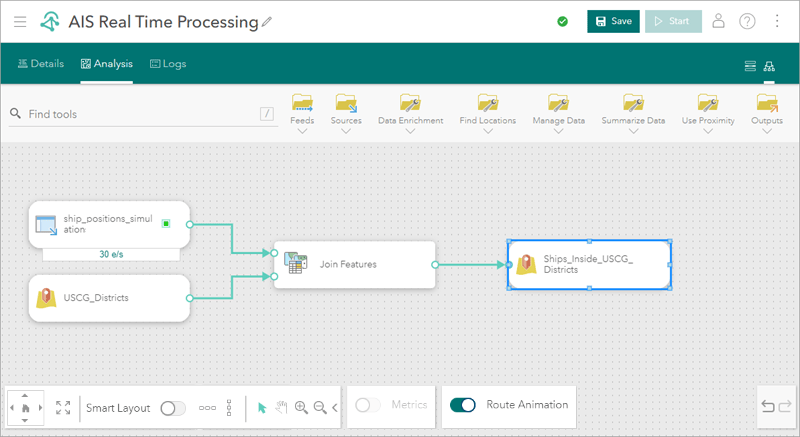
The first analytic enhancement to highlight with this release is a new way to sample and visualize your real-time time data in the Velocity app. Specifically, in your running real-time analytics, you can now choose to sample data on a per node basis, allowing you to gain insight and a better understanding of how your tools and analytic logic are working. The data sampling user experience includes viewing both data attributes as well as geospatial visualization.
Additionally, several enhancements were made to existing tools that assist with data transformations and analyzing change in data over time including the following:
- The Select Fields tool was updated to allow you the ability to remove geometry from your data’s schema.
- The Merge Layers tool was improved to accept different schemas, and will still successfully merge data from the same schema as long as the matching fields in the join schema are identical to fields in the target schema. For example, if one of the merged schemas has extra fields, the Merge Layers tool will add those fields, and populate them with null values, for any records from the other merged schema without those fields.
- Support for track functions was expanded, specifically in terms of Arcade expression evaluation in the Calculate Fields and Map Fields tools. You can now more easily test forward or backward time window expressions in your Arcade scripts. Overall, track functions provide powerful capabilities to create customized change detection logic to understand trends in your data, in real-time or over time.
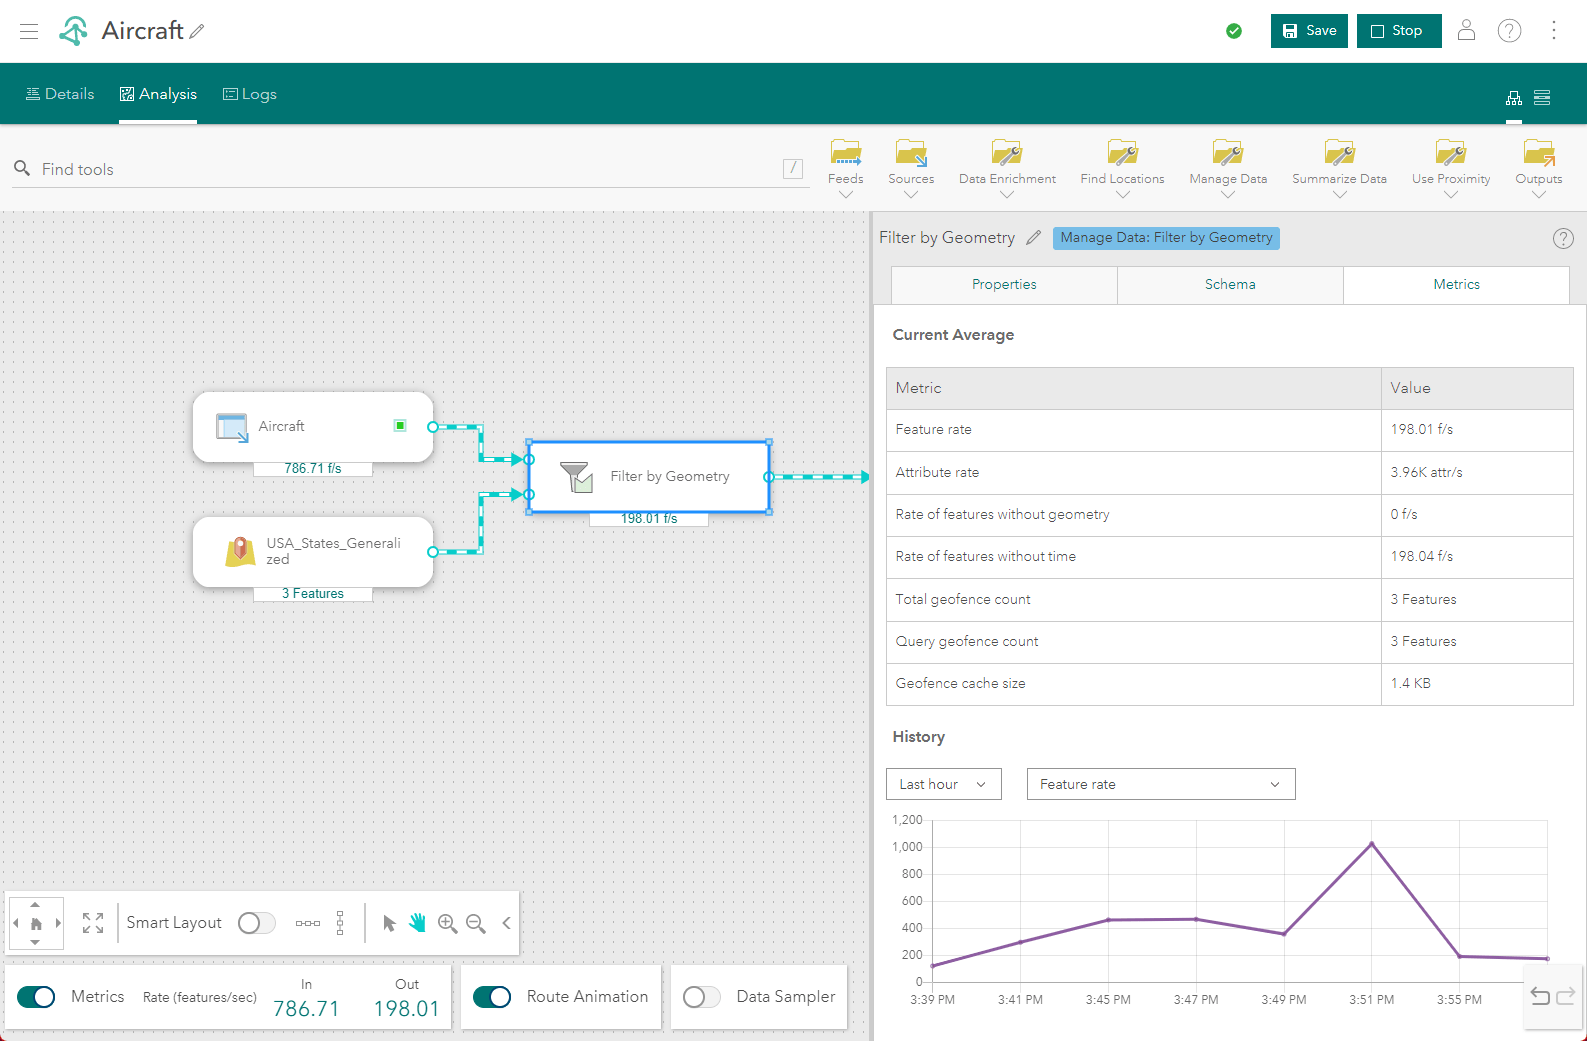
Also, a new user experience was introduced that provides analytic node-level metrics over time, in a graph component. The metrics displayed in the graph provides additional insight into how the flow through a particular part of an analytic process has changed over time (for real-time analytics), or across different runs of the same analytic (for big data analytics).

General
With regard to general product enhancements included in this release, you can now view additional details about your ArcGIS Velocity subscription, including which version of Velocity you are using, the license level, expiration date of your subscription, and more. If you ever need to log an Esri Support case for ArcGIS Velocity, this information will help the support analyst more quickly address your question or issue.

In addition, the analytic workflow view is now in a deprecated status with this release. Meaning, moving forward, the model view will be the view you use when creating all your real-time and big data analytics.

In the next release of ArcGIS Velocity (scheduled for June 2023), workflow view will no longer be available in Velocity.
And more…
For a complete list of enhancements, check out the what’s new topic in the documentation. If you have ideas/enhancements/feature requests for the product, be sure to post them on the ArcGIS Velocity Ideas board in the Esri Community.
To learn more about Velocity, peruse the available resources to access product videos, learn paths, documentation, and more!


Article Discussion: