Looking for the latest UC Event Map and conference information?
Esri User Conference Event Map
Esri User Conference Website

Every July, the Esri User Conference attracts thousands of GIS users from around the world to San Diego, California. Held at the San Diego Convention Center and nearby hotels, the week-long event occurs over half a mile of space. With hundreds of educational sessions and social activities to attend, getting from one place to the next requires a map, naturally.
Though mapping the UC sounds like a simple undertaking, much like the work you do for your organizations, it took careful planning, collaboration and collective feedback. We focused a lot of energy on improving the map experience for UC and utilizing indoor GIS capabilities to help you navigate the Esri UC with ease.
An Enhanced UC Digital Experience
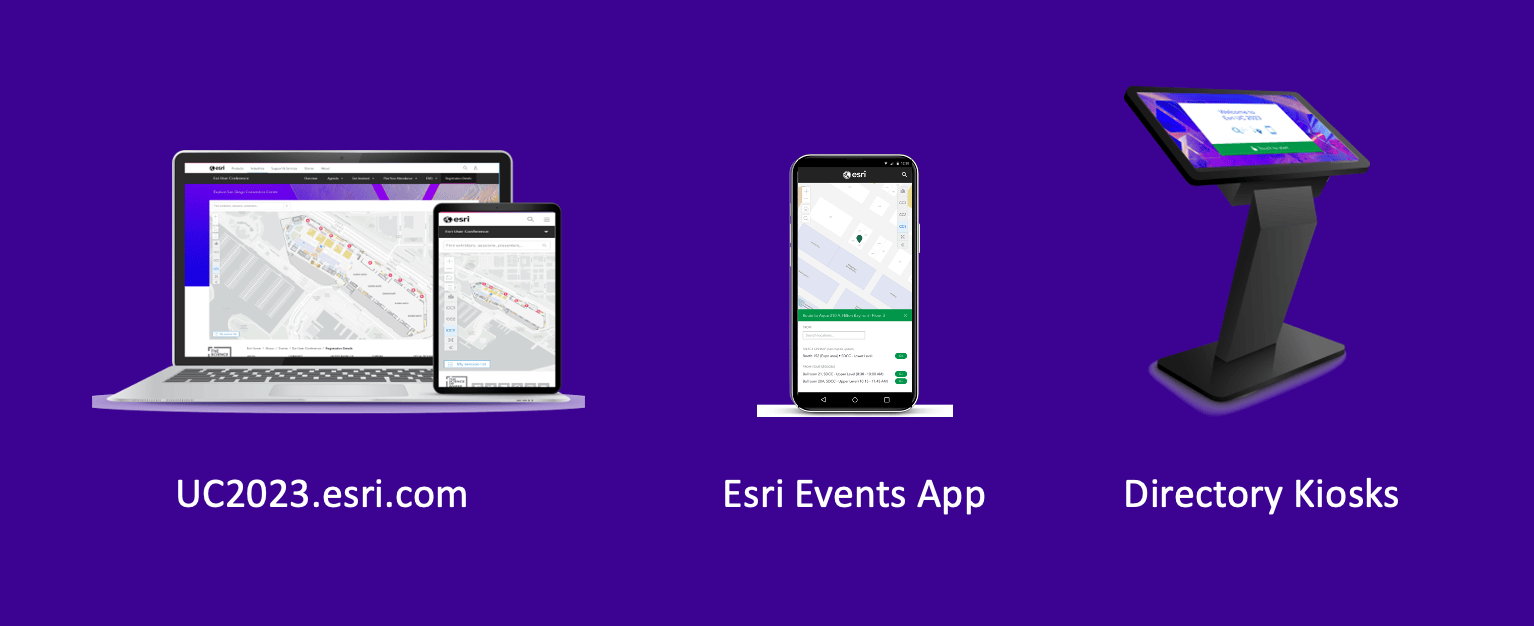
The UC Event Map is available now at uc2023.esri.com to allow you to get familiar with the venue and view locations of sessions and activities before you go. You can also generate a route and directions between two locations and view the estimated travel time. Use this map as a helpful tool, along with the Detailed Agenda and My Schedule, for planning your UC experience. The map will also be available in the Esri Events App and at directory kiosks on site in the convention center.
With the UC Event Map, you can:
- Search for sessions, presenters, exhibitors or Esri showcases
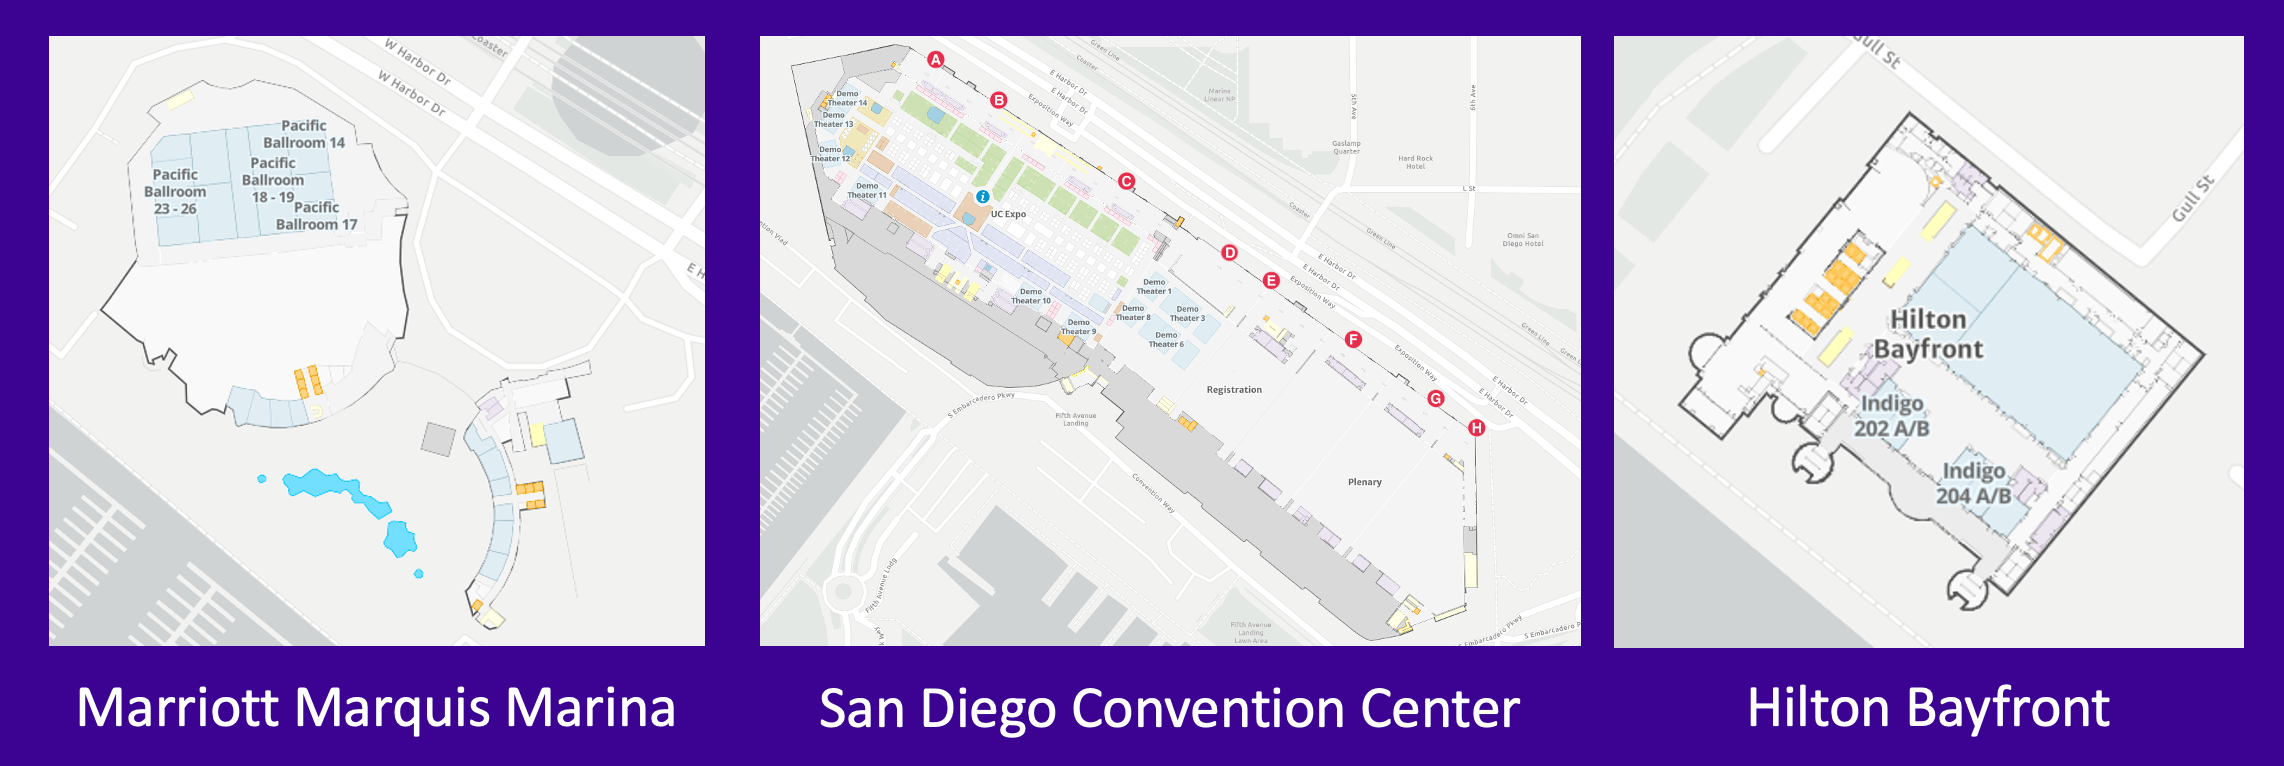
- Generate turn-by-turn directions to and from event locations in the San Diego Convention Center, Marriott Marquis, and Hilton Bayfront.
- View walkable and accessible routes
- Get an estimated travel time
- Transfer directions from the directory kiosks to the Esri Events App via QR Code
- View your scheduled sessions by day on the UC Event Map on uc2023.esri.com
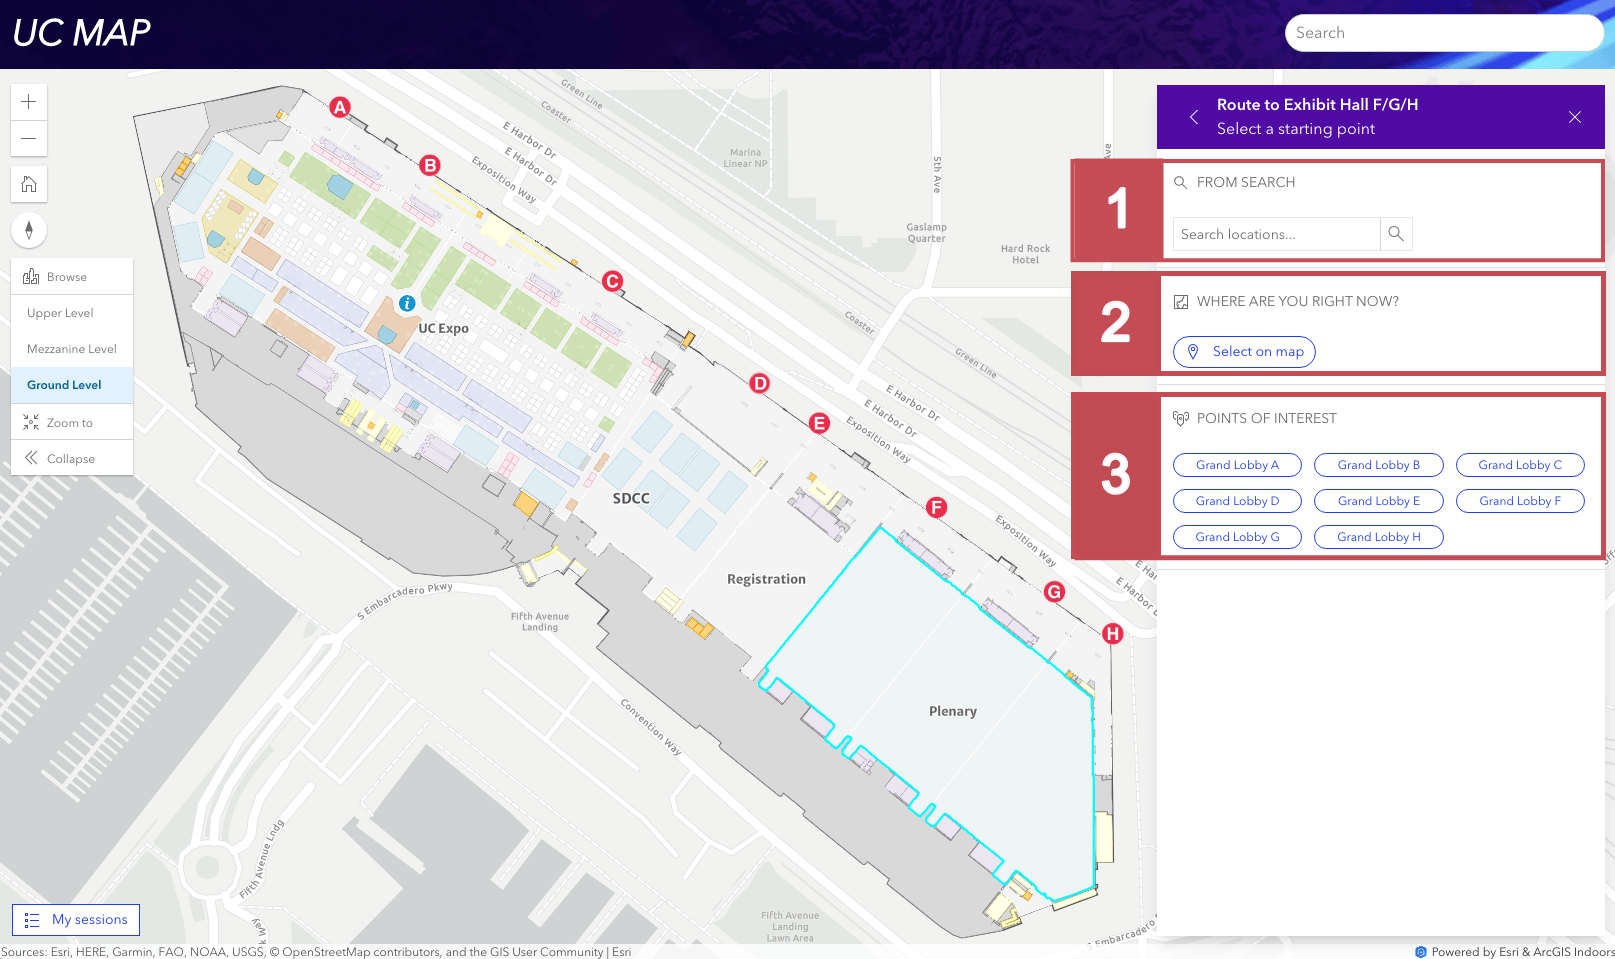
To get directions:
- Search for the session or location you’d like to attend.
- Click the directions icon
- Input your location (see input options below)*
- View route on the map and the directions in the pop-up
*There are three ways to input your starting location
- Search and Select – Use the smart search when you know the name of your location or session.
- Select on Map – Click a location on the map as a starting point. Use the venue and floor picker on the left to change venues or levels.
- Quick Pick Buttons – If you already know how to get to Grand Lobby A, use the Quick Pick button and start from there.
As you can see the UC Event Map is designed to help you navigate with ease. Continue reading to learn more about how we made it.
Making the UC Event Map
Soon after the 2022 Esri UC, Esri set a goal to improve the interactive map experience for the 2023 Esri User Conference to help attendees find the things they want to do. They brought together experts from across the company to work on this exciting project.
From there, the team worked with Esri Events to better understand what attendees may be interested in doing while at the UC. They spent time together imagining how people would experience the different spaces in real life when the displays and signage were in place with thousands of people gathering and moving throughout the buildings. As attendees themselves, it was quite easy to come up with requirements and work with the UX/UI team to determine the level of detail required to produce dynamic maps useful for all UC attendees.
Everything in the UC Event Map is built with Esri technology. They started with bringing in as much existing data as possible, including GIS data from previous years and CAD data provided by the venues, to establish what was physically on site. One of the key improvements was to provide routing, which meant they needed to map all pedestrian areas, such as the rooms, doorways, staircases, elevators and escalators, and other event areas accurately. Using ArcGIS Indoors and ArcGIS Pro, they built walking paths that were indoor and outdoor compatible and ADA accessible, including different floors within the venues. Because it was an event, as they developed the map, they were met with some interesting issues.

Cartographic Challenges
1. Conferences are temporary.
Unlike mapping permanent indoor facilities, conferences are temporary meaning daily floor configuration updates and last-minute room changes were expected and needed to be embraced. Keeping the map updated would mean collaborating closely with the events team to understand what locations are in use at different times throughout the week.
2. Esri rents the venues.
Creating an intelligent event map that could meet map enthusiasts’ expectations was seemingly impossible since Esri did not have complete control over the buildings where the conference takes place. Although we enjoy strong relationships with the venues, and continue to work with them on their footprint and GIS capabilities, we were not able to install beacons to support an ArcGIS IPS-powered indoor positioning system throughout the venues.
3. Technical boundaries limited capabilities.
They had to make important trade-offs to provide the best experience possible within the limitations of third-party software data workflows, and physical infrastructure and hardware, etc. They captured these concessions for consideration on future iterations of the map.
4. Event plans evolve.
Every year, Esri brings new ideas and experiences to the UC. These plans are finalized throughout the year and are updated and modified up until the event. Our teams had to ensure to build the necessary integrations to keep the event information up-to-date in real time.
Though this all added to the complexity of the project, the team was not discouraged. They were committed to creating a cartographic solution that was on-brand for the Esri UC and provided consistency across each map experience.
The team recognizes there will always be mapping work to do and built a strong foundation with the UC Event Map this year which allows updates. They will continue to work with teams internally and externally to enhance the maps and add more capabilities for years to come.
Frequently Asked Questions
What ArcGIS products did you use to make the Esri UC Map?
The UC Event Map uses the ArcGIS Indoors information model and was made using ArcGIS Pro, ArcGIS Online and ArcGIS Maps SDK for JavaScript.
Are all of the UC Event Maps the same?
The map you interact with on the website, in the app, and on the kiosks look nearly identical and use the same cartography, though each experience is specifically built for where and how the attendees will use them.
How will you keep the maps updated?
The maps are integrated with our event software for up-to-date data, and our teams keep open channels of communication to address any additional required changes.
What venues are mapped?
The key conference areas in the San Diego Convention Center, Hilton San Diego Bayfront and Marriott Marquis San Diego Marina are included in the map.
Why can’t I find a blue dot on the map?
Currently, Esri is not able to install the beacons which are required to enable a real-time indoor positioning system throughout the conference venues. However, the maps provide turn-by-turn directions between the two points you select along with estimated travel time.
Where can I submit ideas for future capabilities?
You can post ideas for future map capabilities in the User Conference Esri Community.
Commenting is not enabled for this article.