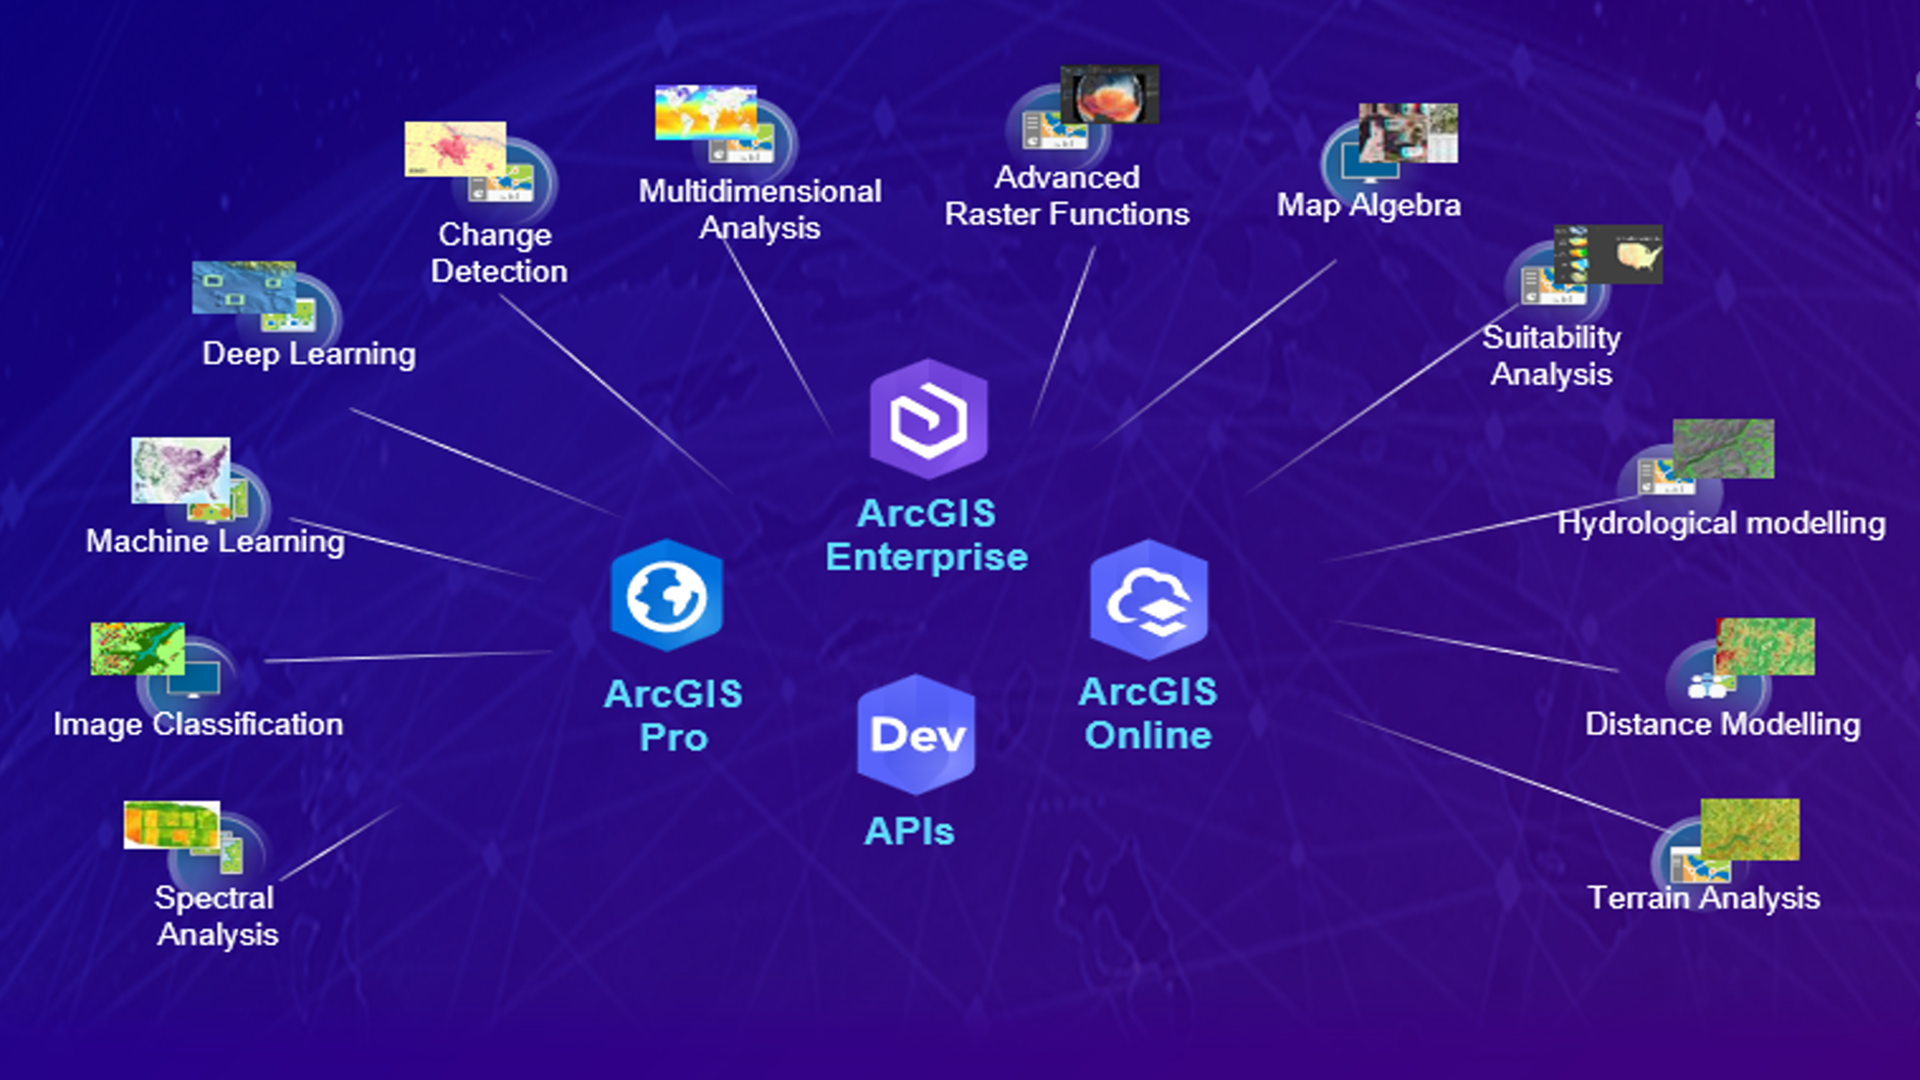
Imagery provides visual context for a map, but its pixel values also contain information you can measure and analyze. That information can help quantify vegetation change, map floodwater, characterize terrain, and extract GIS features. The imagery you work with may come from local files, cloud storage, imagery layers shared through ArcGIS, including content from your organization, ArcGIS Living Atlas, and other sources.
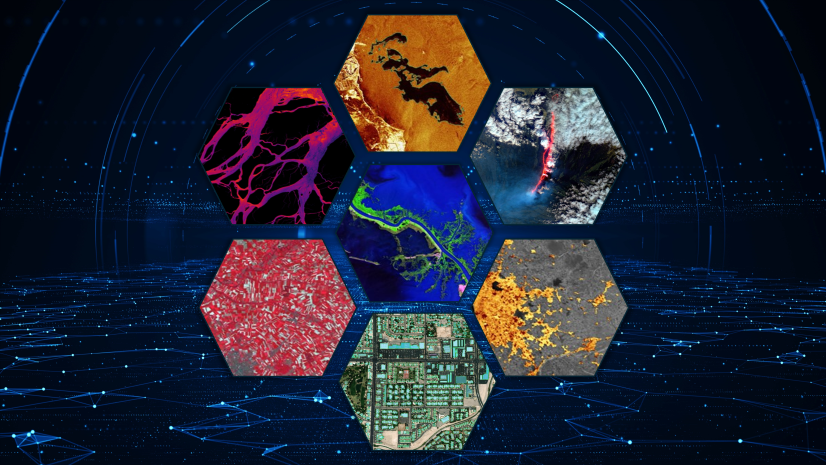
These workflows span satellite, aerial, and drone imagery and a range of data modalities, including multispectral, hyperspectral, radar, elevation, multidimensional rasters, and point clouds. Each dataset can be explored and analyzed independently or combined with other GIS data to answer questions about the world.
Begin by exploring the imagery to understand its content and identify patterns of interest. From there, raster functions and geoprocessing tools support more focused analysis, while GeoAI can automate feature extraction when the task calls for it. The type of data, where it is stored, and the size of the job help determine where and how to perform the analysis (more on that below).
Explore the imagery first
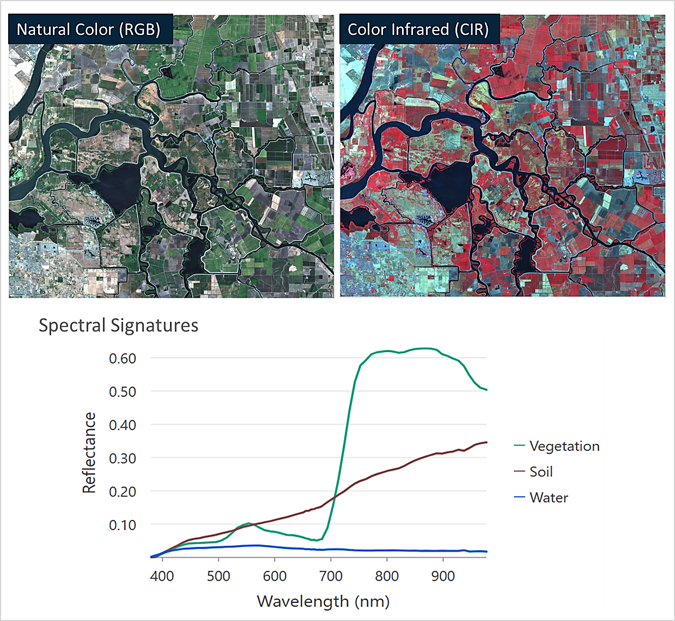
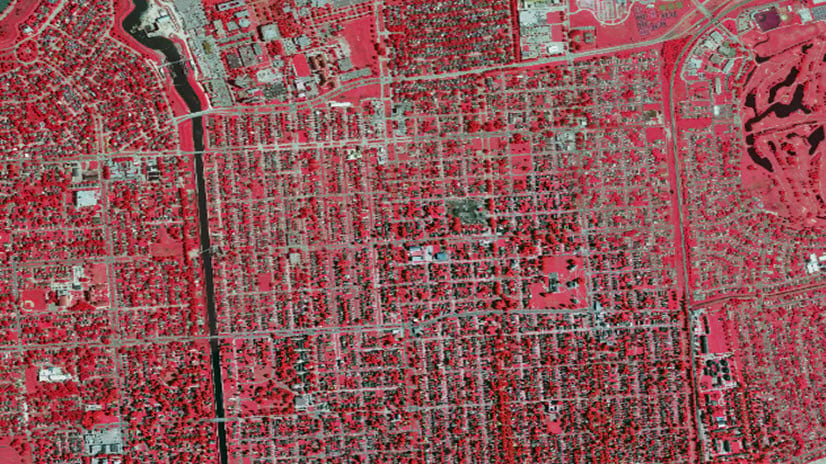
Examine the imagery to understand what it shows and identify patterns that may warrant further analysis. Select an area and date, adjust display stretch and band combination, and view the imagery alongside parcels, assets, or other GIS layers. A false-color composite (color infrared), for example, can make differences in vegetation or water more apparent than a natural color display.
Charts provide a way to examine the values behind what you see on the imagery. A spectral profile shows how a location responds across spectral bands; a temporal profile shows how pixel values change over time. Histograms show the distribution of pixel values within an area of interest, while scatter plots reveal relationships between image variables or spectral bands. These views can help you investigate unusual pixels, compare areas or dates, and determine which patterns are worth carrying into further analysis.
ArcGIS Pro supports spectral and temporal profiles, histograms, and scatter plots for imagery from a variety of sources. In ArcGIS Online Map Viewer, bar charts, histograms, and scatter plots are available for tiled and dynamic imagery layers.
From pixels to analysis
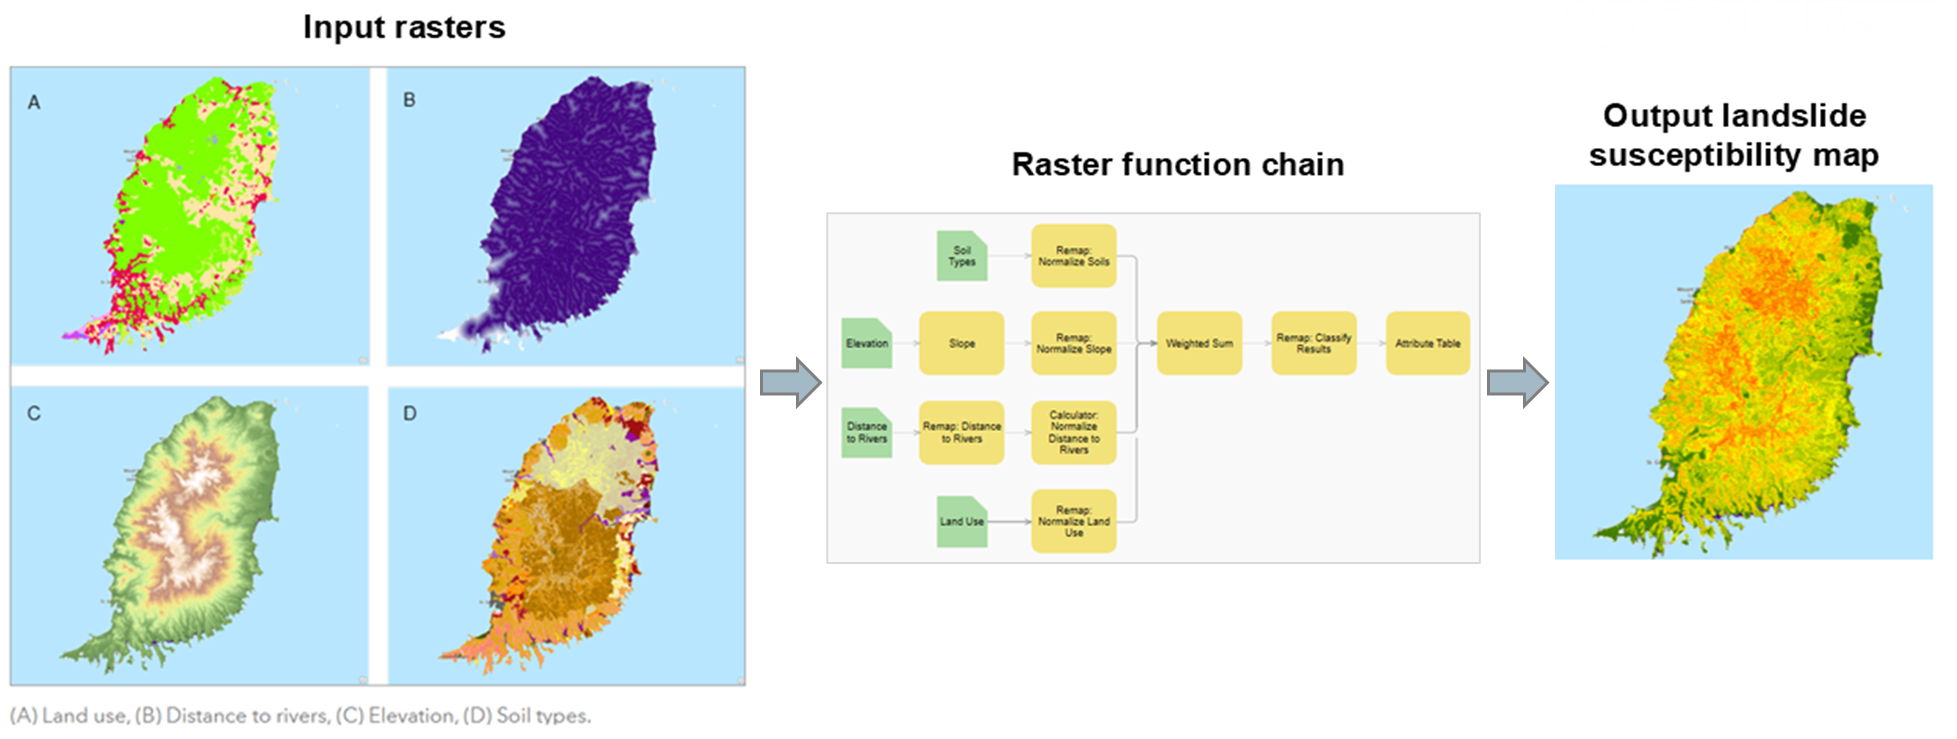
ArcGIS includes more than 150 built-in raster functions for radiometric correction, image enhancement, band arithmetic, terrain analysis, change detection, and many other types of raster processing. The functions described here represent just some of the ways raster functions can be used. Some prepare imagery for analysis by adjusting or correcting pixel values. Others perform pixel-based calculations to derive vegetation or water indices, compare imagery from different dates, or combine rasters into a suitability surface. Raster functions can process imagery without modifying the source data, and multiple functions can be chained into a reusable raster function template. For example, a workflow might calculate a vegetation index, mask out water, and identify areas for further analysis.
What can you analyze?
- Vegetation and environmental conditions: Band math and indices can highlight plant condition, surface water, burnt areas, and built-up surfaces when the imagery has the required bands. You can compare an index between dates, summarize it by management area, and identify locations that warrant field inspection.
- Change and time series: Comparing two images can show the location and magnitude of change. Longer time series can reveal a trend, a seasonal pattern, or the timing of a disturbance. You can use these methods to investigate questions such as where forest cover was lost, which fields recovered after a drought, or how a shoreline has moved. Depending on the question, the result may be a difference raster, a land-cover transition map, or a layer showing when change occurred.
- Distance and suitability: Imagery-derived land cover can be combined with slope, distance from roads, proximity to water, and other GIS layers. Raster math, reclassification, and weighted overlay can turn those inputs into a suitability surface. You can use the result to narrow a search for restoration sites, infrastructure corridors, or areas that need closer inspection. This is where the imagery becomes one input to a broader GIS analysis.
- Terrain and hydrology: Elevation data can be used to derive slope, aspect, flow direction, watersheds, and other characteristics that describe how water moves across the landscape. For example, you can use slope and land cover data to identify areas that may be vulnerable to erosion, or use flow direction and watershed boundaries to map drainage areas and understand how water moves through a landscape. These analyses can support erosion studies, flood assessment, habitat analysis, and site planning.
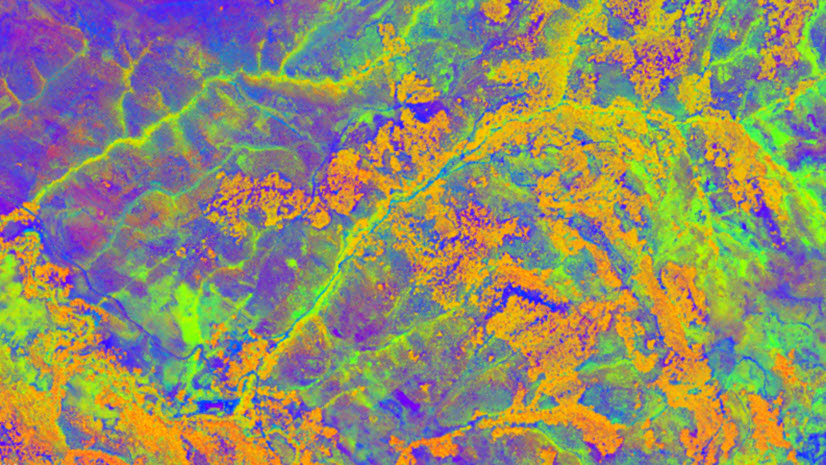
- Synthetic aperture radar (SAR): It can provide information day or night and through cloud cover, making it useful for monitoring places and events that are difficult to observe with optical imagery. You can use SAR to map flooding, monitor changes in wetlands and agricultural areas, detect ground movement, and track changes along coastlines. You can also compare SAR images from different dates to identify changes that may not be obvious in optical imagery. In ArcGIS Pro, you can prepare SAR data for analysis by calibrating and terrain-correcting the imagery, reducing speckle, and calculating measures such as radar indices and coherence. Because SAR responds to the structure and moisture of surfaces rather than reflected sunlight, the patterns you see and the methods you use to interpret them differ from those used with optical imagery.
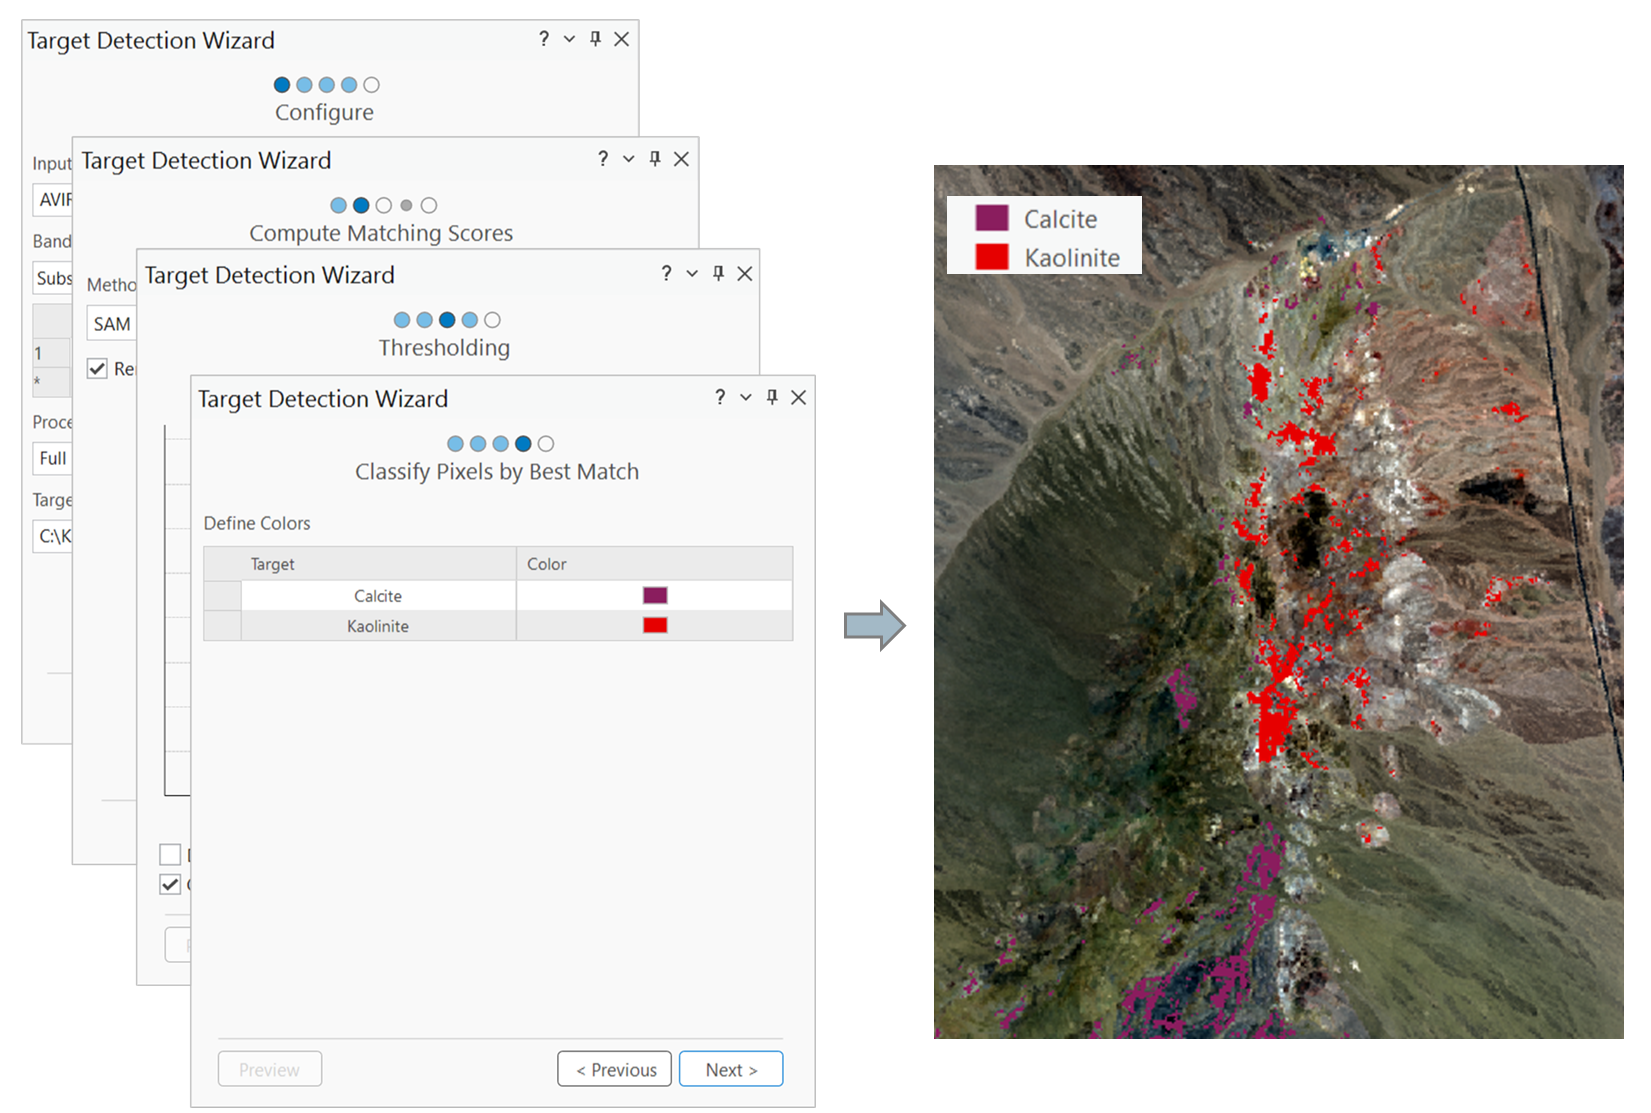
- Hyperspectral imagery: With many narrow spectral bands, hyperspectral imagery can help distinguish materials that look similar in natural color or multispectral imagery. You can use it to identify minerals, vegetation types, man-made materials, or other targets with distinctive spectral characteristics. For example, you can compare the spectral signature of a known material with image pixels to locate areas with similar signatures. You can use target detection tools in ArcGIS to support this type of analysis.
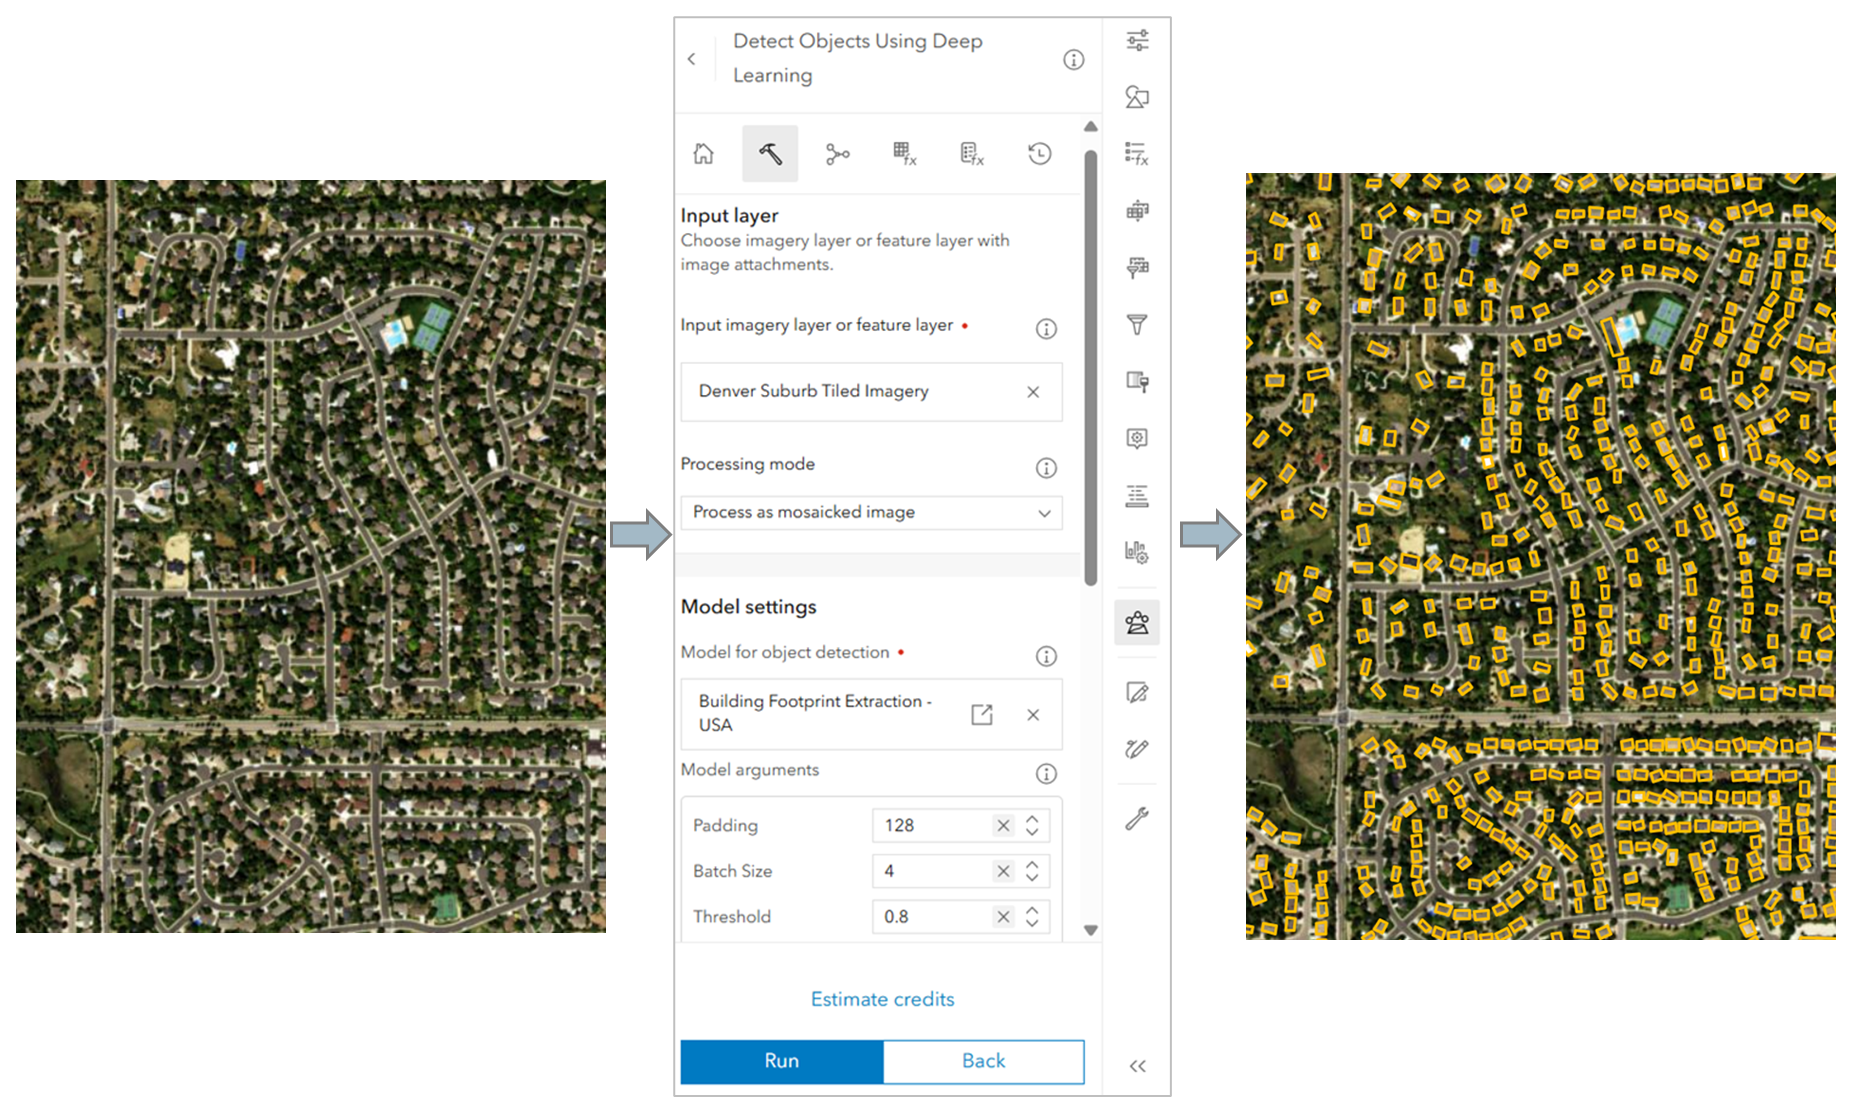
- Classification and GeoAI feature extraction: Pixel-based classification and deep learning models transform imagery into actionable GIS data. Pretrained and custom models can identify land cover classes, detect objects, and extract features such as buildings, roads, and trees. Additional models support damage assessment and change detection. The resulting outputs become GIS layers that support querying, measurement, reporting, and spatial overlay with assets, infrastructure, or administrative boundaries. You can review samples and assess accuracy before using the results as authoritative data.
Choose where the analysis runs
- ArcGIS Pro (desktop) is a useful starting point when you have local files, need to examine source data closely, or want to refine a method interactively. It can also connect to image services. ArcGIS Pro’s geoprocessing framework includes more than 2,000 tools across GIS workflows, with additional imagery capabilities available through ArcGIS Image Analyst and ArcGIS Spatial Analyst. Guided experiences such as the Image Classification, Change Detection, Anomaly Detection, and Target Detection wizards help you work through multistep analyses, preview results, and adjust settings before saving them.
- ArcGIS Enterprise with ArcGIS Image Server provides a way to serve and analyze imagery across an organization. Its distributed raster analytics capability is suited to large collections, wide areas, and workflows that need to run repeatedly. A team can develop and test an approach on a small area, then apply raster functions or deep learning across larger collections and publish the results as services. Imagery and processing can remain within an organization’s enterprise environment, whether deployed on premises or in the cloud.
- ArcGIS Online (SaaS) provides hosted imagery and raster analysis without requiring an organization to manage the underlying infrastructure. Organizations can publish their own imagery or analyze supported ArcGIS Living Atlas layers in Map Viewer. Tiled imagery layers provide fast access to raster pixels for visualization and analysis, while dynamic imagery layers support dynamic mosaicking , selection of individual images, and server-side processing. Map Viewer provides raster analysis tools, raster functions, and deep learning workflows, with results that can be saved as layers and shared across your organization.
Extend the analysis beyond the interface
The same work can be scripted or built into an application. ArcPy exposes ArcGIS Pro geoprocessing tools for automating desktop workflows. The ArcGIS API for Python and ArcGIS REST APIs expose imagery layers, raster functions, and raster analysis services, so a team can repeat an analysis as new imagery arrives. The ArcGIS Maps SDK for JavaScript can bring imagery display and processing into a web application designed around a particular task.
Organizations can also bring in their own methods. Raster function templates combine built-in processing steps into workflows that can be reused. Custom Python raster functions allow third-party algorithms and Python libraries to run as part of imagery processing in ArcGIS Pro and supported ArcGIS Enterprise deployments. Deep learning models can likewise be trained or adapted for the imagery and features an organization works with.
Consider a county monitoring development near a river. It might compare images from several dates, classify land cover, use a model to update building footprints, and overlay the results with flood zones and parcels. An analyst can examine the change map, check the extracted features, and publish the layers for planners to query. What began as imagery is now information connected to the rest of the GIS.
The starting point might be one local image or a large collection served across an organization. The value grows when the measurements and extracted features become GIS layers that others can query, combine with their own data, and use in their work. AI adds another way to scale the work, especially when classifying imagery, extracting features, or detecting change across large collections. Analysts can validate those outputs, combine them with raster measurements and other GIS layers, and share the results for others to use.


Article Discussion: