ArcGIS Pro users may be familiar with running infographics to learn about features they’ve mapped for an analysis. Many users first encounter infographics through the Infographics button found on the Map tab, in the Inquiry group.

However, to take full advantage of infographic and report capabilities in Pro, users should try running infographics and reports in Business Analyst Pro. In addition to the ability to batch-run hundreds of infographics and reports at once, Business Analyst Pro offers infographic editing and report editing capabilities that are only available through Business Analyst when connected to a local dataset.

This article answers some of the most frequently asked questions about infographics and reports in Business Analyst Pro, including how they’re stored and how they relate to online data, local data, and Enterprise organizations.
Which infographic capability should I use?
Infographic capabilities in ArcGIS Pro vary depending on the type of data source you’re using, and your needs may also inform whether you use the lightweight Infographics button or the raw power of Business Analyst Pro infographics.

| Use ArcGIS Pro infographics capability if… | Use Business Analyst Pro infographics capabilities if… |
|---|---|
|
|
Where are Esri infographics and reports stored?
Infographics and reports exist first as templates—meaning they’re prebuilt information products but contain no data until you run them. We’ll walk through where the templates are stored, and where the infographics and reports are stored after you run them.
Infographic and report templates
Templates for online data
When using an online data source, infographic and report templates are stored online by GeoEnrichment and accessed on the fly when you run them. You can only run one template at a time, and the item created is an HTML file that can be exported to your computer as a PDF, HTML, or Dynamic HTML file.
Templates for local data
When using local data, infographic and report templates are stored in the local dataset. For Business Analyst Pro local datasets, this means they’re in the data download folder. For Enterprise local data packs, they’re stored in the data pack folder.
Reports specific to Business Analyst Pro workflows
There are a number of reports that you can create using specific Business Analyst tools and workflows, such as the Wind Rose Report and the Measure Cannibalization Report. These workflow-related templates are stored on your computer along with ArcGIS Pro, at the following folder path: Program Files > ArcGIS > Pro > Resources > Business Analyst > Report Templates.

Infographics and reports you created
Infographics created from online data
If you run an infographic using the on-the-fly Infographics button approach, the infographic is not automatically saved anywhere. You can, however, export the infographic as a PDF, HTML, or dynamic HTML and save it to your machine.
Infographics created from local data
If you run one or more infographics using the Summary Reports tool in Business Analyst Pro, on the other hand, all infographics are saved in the project folder, in a subfolder called SummaryReports. A typical folder path is: Documents > ArcGIS > Projects > [project name] > SummaryReports.

Reports created through Business Analyst workflows
Looking for workflow-specific reports you created? These are also in the project folder, in a subfolder named after the workflow. A typical folder path is: Documents > ArcGIS > Projects > [project name] > TerritoryReport.

Where are my custom infographic and report templates stored?
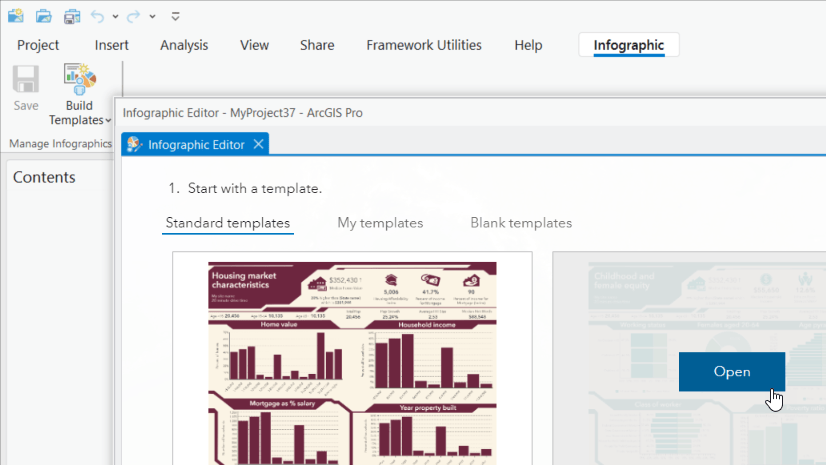
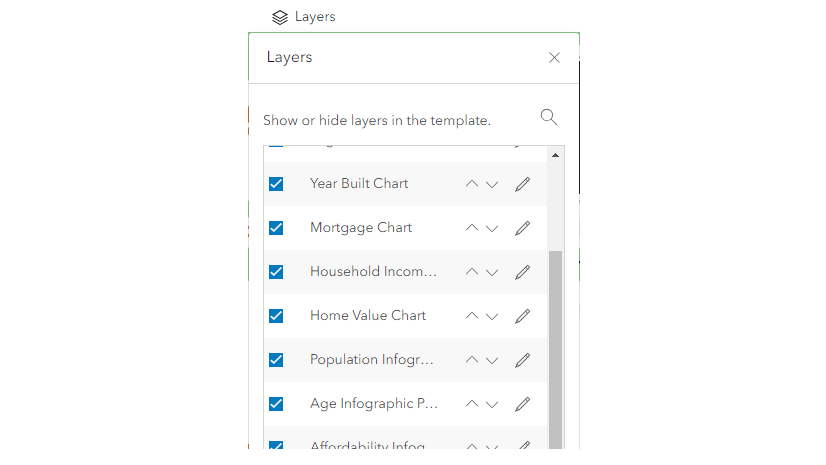
Editing infographic and report templates, a capability introduced to Business Analyst Pro at the 3.2 release, is a popular activity for Business Analyst users. But where are those custom templates you created?
Custom templates are also stored as zipped folders, in the project folder (or another folder of your choosing). You can set this folder destination in the Options window, in the Business Analyst section, under Set options for report templates. By default, custom infographic and report templates are stored at the following path: Documents > ArcGIS > Projects > [project name] > Business Analyst Templates > [template name].

Alternatively, you can set your own storage destination in this window. To learn about best practices for storing infographics in a location you choose, rather than the default, visit How to work with infographics like a pro in ArcGIS Business Analyst Pro.

How do I import an infographic into a local dataset?
You can create infographic templates using Business Analyst Web App through either an ArcGIS Online or Enterprise organization, and import the templates into Business Analyst Pro as .brpt files. For instructions on importing templates and the data they contain, see Import report templates.
Keep in mind that you can import templates through your organization, from an online data source into your local dataset. This means you can grab any template and run it without using credits.
How do I share a custom infographic within my organization?
You can share custom infographic templates with your colleagues using the following process:
- Copy the data and template folder to a new folder.
- Zip the folder.
- Send to your colleague.
- Have your colleague drag the data and template folder to the location where they store custom templates.
Can I work with the same templates when switching between data sources?
No. Templates are dataset-specific, meaning if you created a template using the U.S. 2025 dataset, you must have that dataset selected as your data source to work with the template. You cannot combine local and online data sources, even if the data is for the same year and country (such as the U.S. 2025 local data and the Esri 2025 online data source).
How do I share custom infographic templates from Business Analyst Pro to Business Analyst Web App?
To share your custom Pro templates, you’ll need to do a little editing and rearranging on the backend of Pro. Currently, this workaround is for templates that contain only standard variables, not custom data. The instructions below walk you through the process:
-
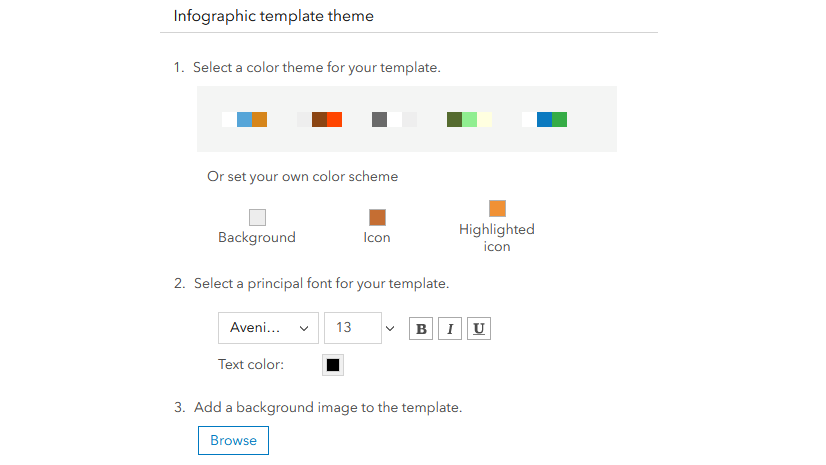
Create and save a custom template using standard variables in the Business Analyst Pro infographic editor. In this example, I’ve modified the Health Care and Insurance Statistics template to include an ArcGIS Tapestry infographic panel in the bottom left of the template.

-
Open a text editor app, such as Notepad, and paste the following into it, modifying “My title!!” to a title that suits your needs, just be sure not to delete the quotation marks:
- Save this file with the name
itemInfo.txtin the infographic template folder. For a reminder of your custom template folder location, see Where are my custom infographic and report templates stored?

- Select all the items in the template folder, including the new itemInfo.text file, and compress them in a ZIP folder. Then click the file and change the file type from .zip to .brpt.

- Open Business Analyst Web App and click Reports, then click Add template from file.

- Browse to and select the .brpt file, then click Open and save the template. Now your custom template is in Business Analyst Web App!

-
Finally, return to your original Pro template folder and delete the .brpt file. This ensures that the template will still be editable within ArcGIS Pro.
This article uses ArcGIS Business Analyst Pro 3.7 and ArcGIS Business Analyst Web App Advanced.
Note: This article was updated on 5/15/26 to reflect updated functionality. The last previous update was on 2/5/26.
Resources
To continue your Business Analyst journey, visit the following resources:
- Business Analyst product overview page
- Review pricing and purchase Business Analyst
- Business Analyst resources page
- LinkedIn user group
- Business Analyst Web App video channel
- Business Analyst Pro video channel
- Business Analyst on Esri Community
- Business Analyst Web App login page
- Email the team: businessanalyst@esri.com

Article Discussion: