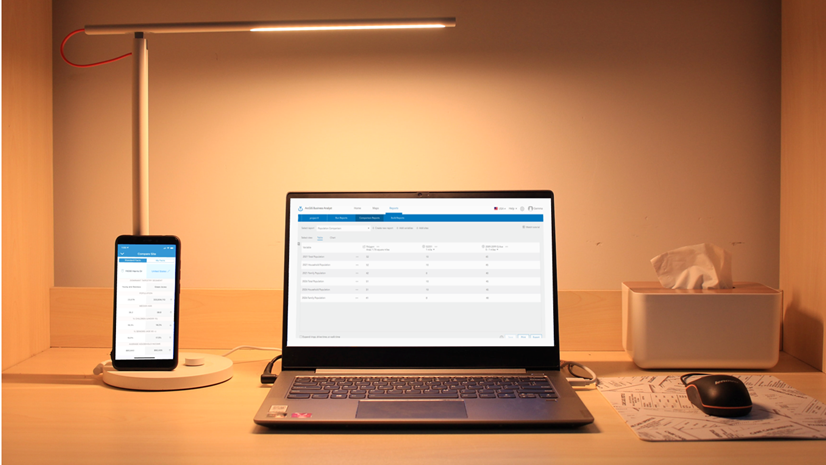
ArcGIS Business Analyst Web App and the ArcGIS Business Analyst extension in ArcGIS Pro have long been companion applications for spatial analysis. Business Analyst Web App is a go-to product for web-based GIS for users who want to understand communities, support business expansion, and identify market opportunities. It is updated three times a year, in line with ArcGIS Online product releases.
Business Analyst Pro, on the other hand, is part of Esri’s powerhouse ArcGIS Pro desktop software and is released for download twice a year. It extends the web capabilities with more advanced workflows, territory design, customer analysis, and more.
Because Business Analyst products are developed in tandem, workflows in one application often serve as inspiration for the other application. This is the case with benchmark comparisons, which allows Business Analyst Web App users to compare sites using criteria and benchmark values. For example, you might compare SAT scores across school districts in Texas.

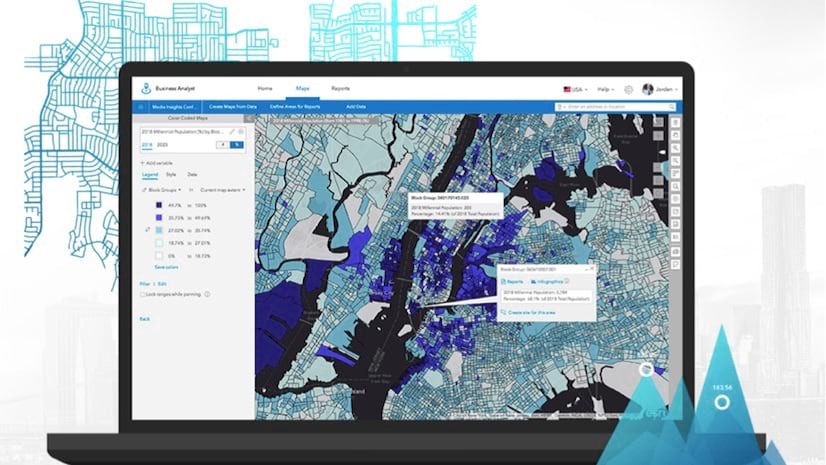
In Business Analyst Web App, the benchmark comparisons workflow compares sites using criteria and benchmark values that you set. Results are displayed on a map and in the Results pane. On the map, the styling can be changed using different comparison methods. The Results pane includes a summary, histogram, bubble chart, and table. In the table, you can compare with geographies to expand the analysis. On the Summary tab, you can use in-app documentation to learn about the underlying statistics.

In Business Analyst Pro, the benchmark comparisons workflow compares locations using variables and site attributes. Results are displayed on the map and in the Results pane. Significantly, benchmark comparisons are the final capability from the previous ArcGIS Desktop software to be incorporated into ArcGIS Pro—bringing Business Analyst into full equivalency with the well-loved (but retired) software product.

This article walks through the basic similarities and differences between these two sister workflows in Business Analyst.
What is the same between the two workflows?
There are many similarities between the two workflows. Fundamentally, both workflows compare sites using variables, allow you to set a benchmark, and visualize the comparison on the map and in the Results pane.
Choosing variables for comparison
Geographic data is the lifeblood of Business Analyst. The benchmark comparisons workflow allows you to explore the data to your heart’s content by choosing as many variables as you want. In Business Analyst Web App, you can compare up to 10,000 sites.
The experience of selecting variables is nearly identical between Business Analyst Web App and Business Analyst Pro. Both applications use the data browser (Web App / Pro) for adding variables to the comparison, the only difference being how you get there.
In Business Analyst Web App, click Browse all variables to access the data browser. You can also select from curated variable lists by topic, such as variables reflecting income or spending habits in an area.

In Business Analyst Pro, you can add variables from the data browser (by clicking the Add button) as well as site attributes from the input features you added. Site attributes could be things like the area of the polygon (as in the example below, with Kentucky counties) or your own data such as sales volume for a trade area.

Setting a benchmark
As the name implies, one of the central functionalities of the benchmark comparisons workflow is setting a benchmark against which to compare the data across sites or features. In both Business Analyst Web App and Business Analyst Pro, you can identify the benchmark as a value—such as the median or average of all sites—or as the values for a specific site or feature.
In Business Analyst Web App, you can set the benchmark in two different ways:
- In the Comparison method section, use the Method drop-down menu and click Above and below benchmark. Use the Benchmark drop-down menu to select a site to set as the benchmark.
- In the Table on the Results pane, click the Options button for a location and click Make benchmark. The Above and below benchmark comparison method is automatically implemented.
If you add average or median in the Statistics section, it can be used as the benchmark. You can use either percentage or raw values for the difference type.

In Business Analyst Pro, you can set a benchmark and define the comparison within the workflow pane by clicking the Comparison Methods tab and specifying the parameters. These parameters include choosing comparison statistics (such as the mean or median), the comparison method (such as Above and below benchmark), the map styling, and neighboring geographies to include. Note that the benchmark parameters can be adjusted continuously as you work, and updated by clicking Apply.

In the Results pane, the benchmark is placed as the first row or column of the table. You can also alter the benchmark using the Benchmark drop-down menu in the Benchmark Comparisons Properties pane.

Using the Results pane
In Business Analyst, the Results pane (Web App / Pro) is an interactive data exploration tool that allows you to learn more about your analysis. Though the functionality of these panes differs slightly between the applications, the fundamental importance of tabular data exploration unites them.
In Business Analyst Web App, you can explore the benchmark comparisons as a summary, histogram, bubble chart, and table in the Results pane.
- The Table appears first by default. Depending on the comparison method, items in the table include color-coded labels that match the map styling. If you click the Options button for a location in the table, you can set a benchmark or compare the location with other geographies. For table-focused goals, click Expand to expand the table and cover the map.
- On the Summary tab, you can select a variable to use in the box plot and see a summary of key statistics. To learn more about these key statistics, click IQR, Skewness, or Kurtosis and read the definitions in the Overview of statistics
- On the Histogram tab, you can view the results as a histogram.
- On the Bubble chart tab, you can view the results as a bubble chart or scatterplot.

In Business Analyst Pro, you can explore the benchmark comparison as a summary, histogram, scatterplot, and table in the Results pane.
- On the Table view, which opens first, you can select features to view them on the map, view the variable and measurement values for each feature, view each feature’s comparison indicators, transpose the table, and export it to Excel.
- On the Summary view, you can view descriptive statistics about the data distribution, select a subset of features to see statistics about them, and change the variable summarized.
- On the Histogram view, you can view information about the data distribution by selecting a variable to examine and then selecting or zooming in on a subset of features, such as features that fall at the high or low end of the distribution.
- On the Scatterplot view, you can explore the data distribution using different variables as the x- and y-axes.

What is different between the two workflows?
There are a few differences between the two workflows that we would like to highlight, including comparison methods, Results pane functionality, and compare geographies capabilities.
Comparison method differences
The benchmark comparison methods are the options available to set a benchmark value for the analysis.
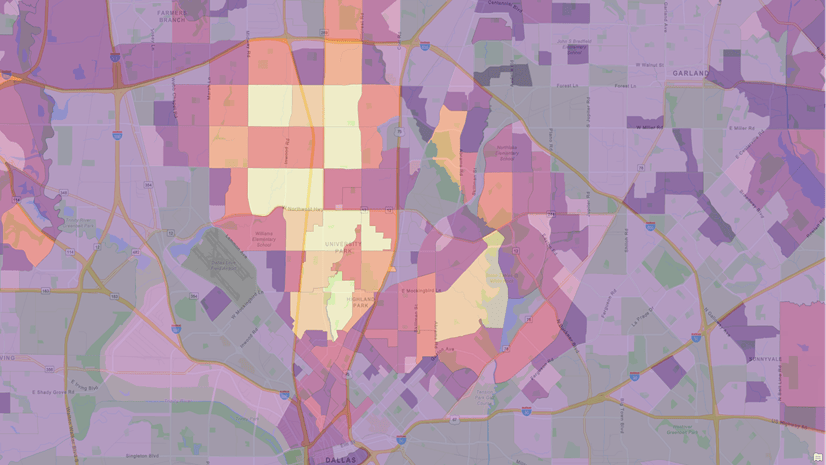
In Business Analyst Web App, there are several comparison methods: None, High to low, Top and bottom, Above and below benchmark, Quantiles, Highlight extremes. The comparison methods apply map stylization to visualize how values compare to one another. For instance, the High to low comparison method uses color-coding to visualize the range of values. The Highlight extremes comparison method highlights extreme values based on IQR or standard deviation.

In Business Analyst Pro, there are three comparison methods: High to low, Top and bottom, and Above and below benchmark.
The High to low comparison method displays the range of values for a selected variable or attribute. The Top and bottom method highlights the top and bottom ranked values, which you define. The Above and below benchmark method allows you to set a feature or measurement as the benchmark value, and then displays how the variable value for each features compares to the benchmark.

Compare geographies
The compare geography capabilities use additional geographic levels for a broader analysis.
In Business Analyst Web App, you can compare a location with other geographies. Open the Geography comparison window by doing either of the following:
- In the Table on the Results pane, click the Options button for a location and click Compare with geographies to open the Geography comparison In the Geography comparison window, you can change the geography levels displayed, change variables used in the analysis, and export the data to an Excel spreadsheet.
- Click a location on the map to use the site’s pop-up menu. Click Comparisons and click Compare with geographies to open the Geography comparison window.

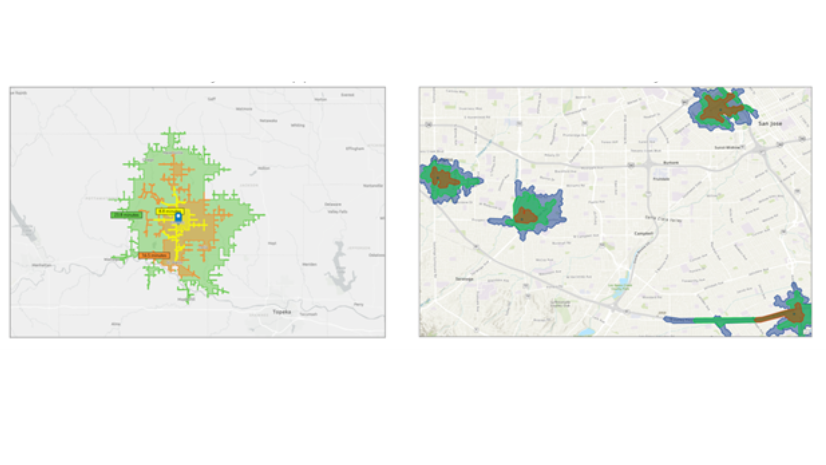
In Business Analyst Pro, you can click the Comparison Methods tab and select neighboring geographies, such as the states containing the locations, to include along with the locations in the layer. Standard geography polygons that intersect centroids of the input features are included in the Results pane and enriched with the variables you selected.

Summing it all up
The benchmark comparisons workflow is a powerful tool for analysis in both products. It reimagines the previous comparison reports with more benchmark comparison methods, mapping capabilities, and interactive analysis.
This blog article was originally published on November 19, 2024, and has been updated.


Article Discussion: