Finding accessible, licensed childcare is one of the most significant barriers facing working families today. The national shortage of early-learning centers isn’t just a family burden—it is a macroeconomic bottleneck that directly impacts workforce participation and local economic growth. While civic leaders and economic developers know that “childcare deserts” exist, answering where exactly to intervene requires highly precise spatial data.
We can map the physical locations of these vital resources using ArcGIS Business Analyst’s comprehensive points of interest (POI) data, but plotting points on a map is only the first step. To truly understand community access, we need the right geographic lens.
Historically, planners have had to rely on standard boundaries that are either too small (like Census block groups, which can trigger false positives) or too large (like ZIP codes, which often mask local socioeconomic inequalities). This is where the new Neighborhoods geographic boundary layer—introduced in the June 2026 release of ArcGIS Business Analyst—becomes an incredibly powerful tool. Because they reflect actual cultural, historical, and social borders rather than arbitrary mail routes, they allow us to pinpoint structural gaps within communities exactly as they exist in the real world. In this sense, they provide the perfect ‘Goldilocks’ scale for solving complex urban planning issues like childcare deserts.
A Chicago case study
To prove the power of this new geographic lens, we put it to the test. We chose Cook County, Illinois (home to Chicago) because it packs stark socioeconomic contrasts into tight geographic areas, making it an ideal testbed for mapping childcare gaps with the new Neighborhoods boundaries.
To replicate this workflow for your own city, you will need access to ArcGIS Business Analyst Web App and the following data layers:
- Esri Updated Demographics (2026 Population Age 0-4): We will use this variable to represent the “demand” for childcare.
- ArcGIS Business Analyst Points of Interest (NAICS 6244 – Child Day Care Services): We will use this business data to represent the “supply” of childcare.
- The Boundary: The new Neighborhoods (AN) boundary layer introduced in the June 2026 release.
The Workflow: Step-by-Step
Step 1: Finding the Desert (Suitability Analysis)
We launched directly into the Suitability Analysis workflow to scan the entire county and objectively discover which neighborhoods lack childcare services.
First, we set our geographic boundary to Cook County, IL, and selected the Neighborhoods (AN) layer as our level of detail. Instead of dealing with thousands of tiny Census blocks, this single selection instantly divided the massive county into distinct, culturally recognizable urban communities.
Next, we added our criteria directly from the Business Analyst data browser:
- We added the 2026 Population Age 0-4 variable and set it as a positive influence.
- We added the 2026 Child Care Services Bus (NAICS 6244) variable and set it as an inverse influence (the fewer the daycares, the higher the score).
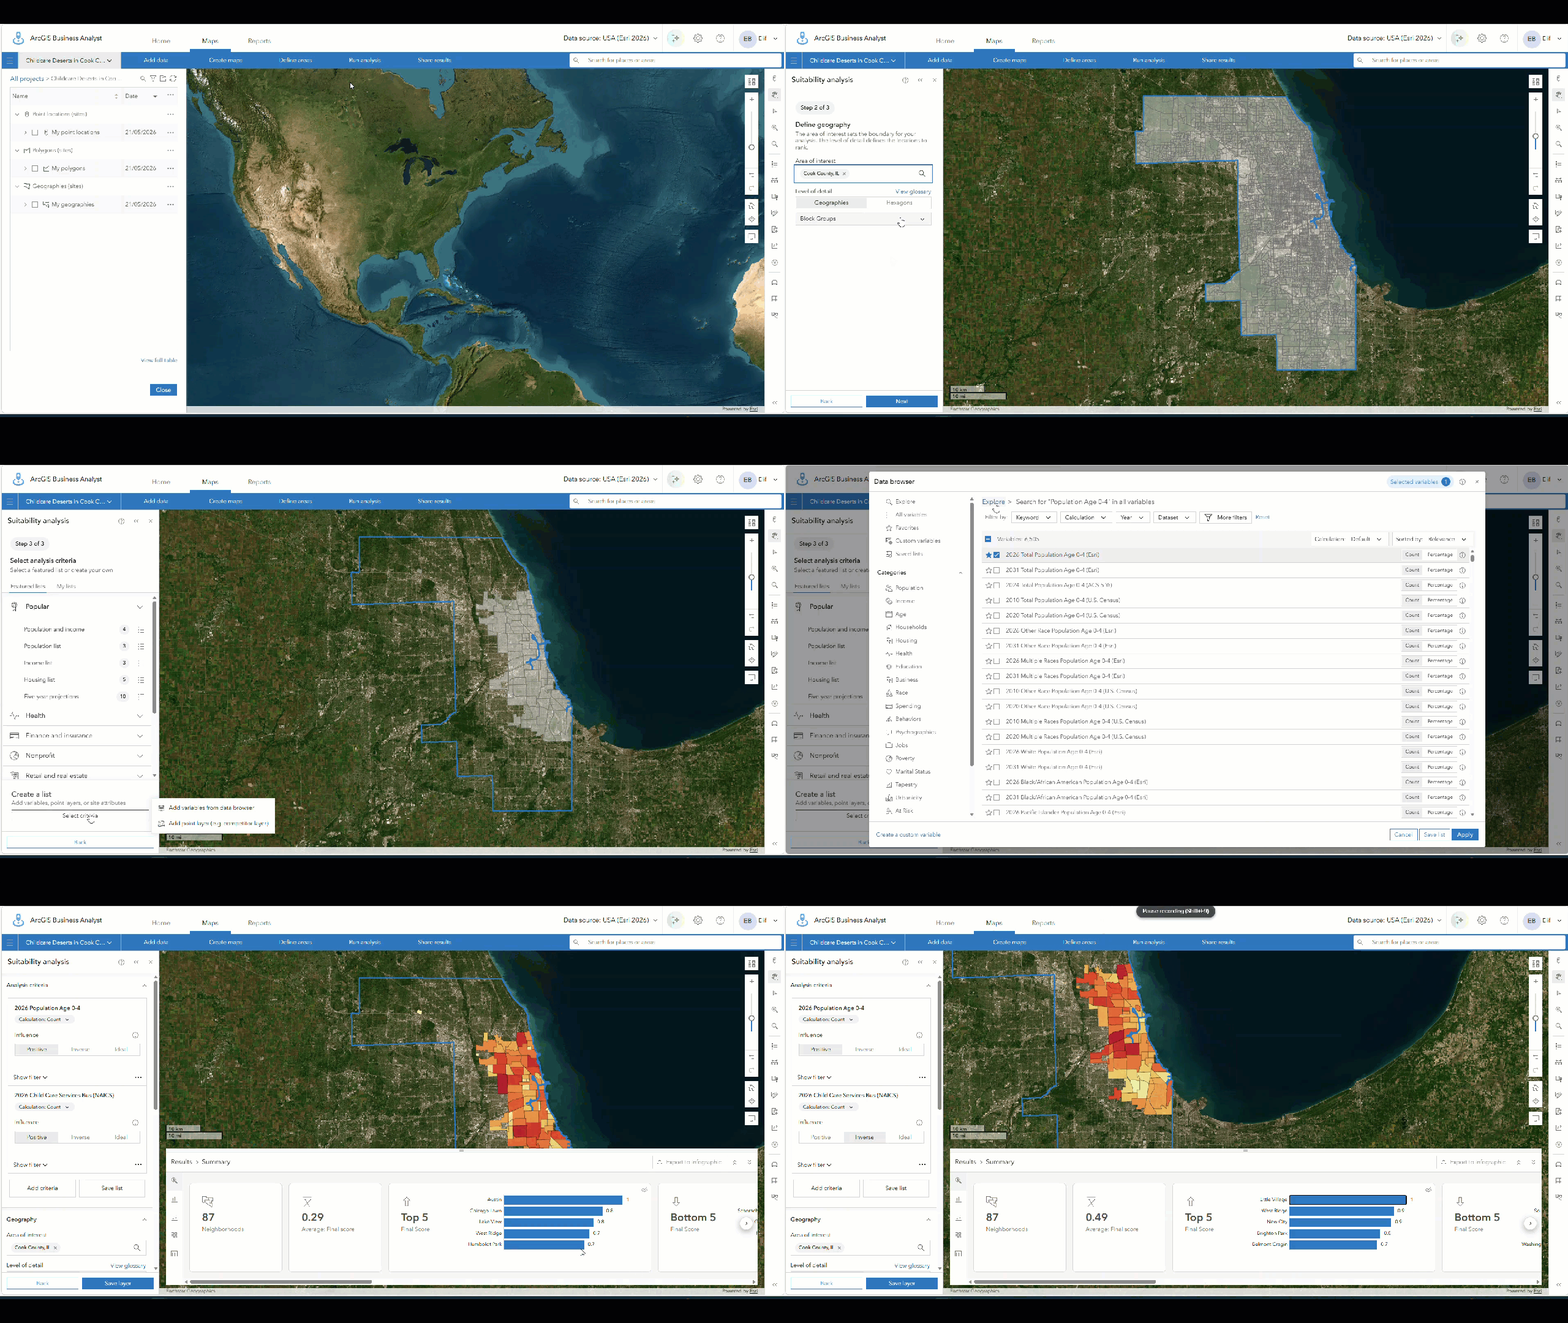
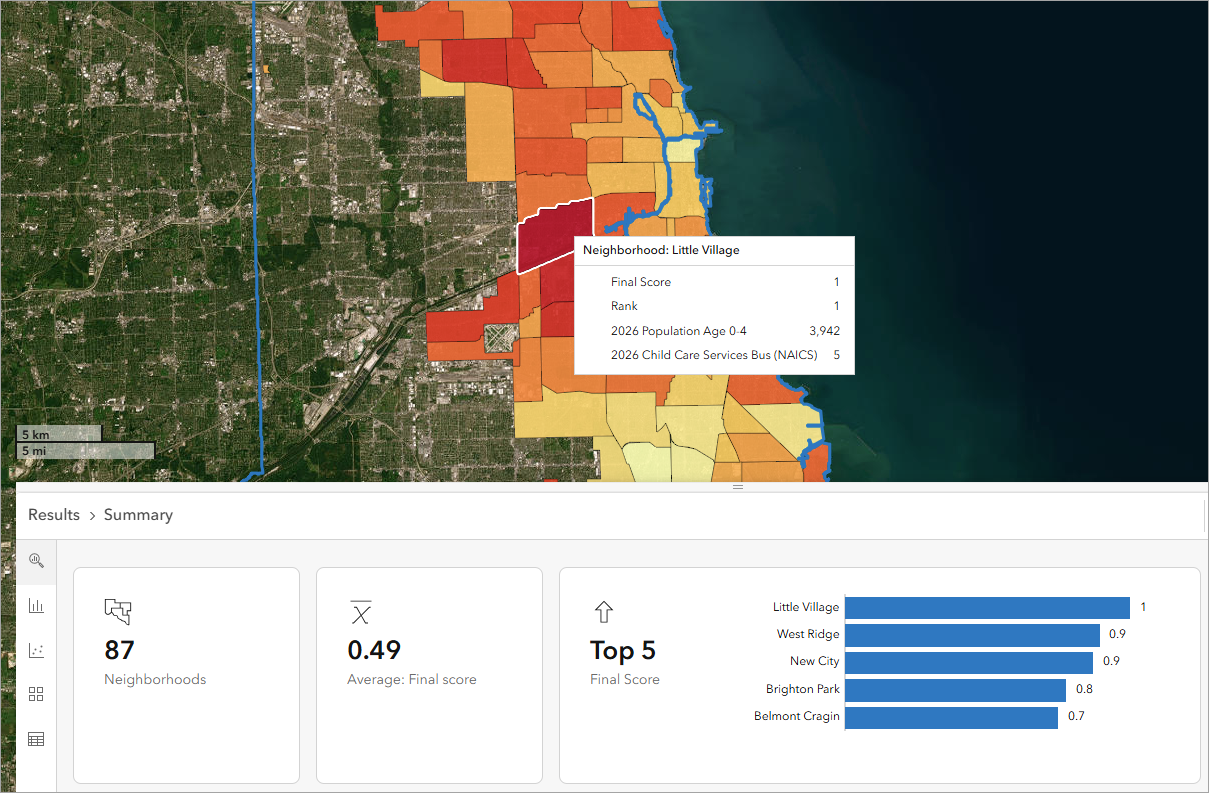
As the map reveals, out of all 87 neighborhoods in Cook County, Little Village ranks as the most severe childcare desert—with nearly 4,000 toddlers sharing just five daycares. The lived reality behind that number is documented in Finding Child Care in Two Chicago Communities, a University of Chicago study by Chapin Hall examining how families in Little Village (and Belmont Cragin) navigate a thin supply of local childcare.
Tip: Once your analysis runs, you can click Save layer to permanently save this suitability map to your project for future use.
But raw rankings only tell half the story. To see the disparity clearly, we need to benchmark Little Village against a well-served neighborhood.
Step 2: Setting the Baseline (Geography Comparison)
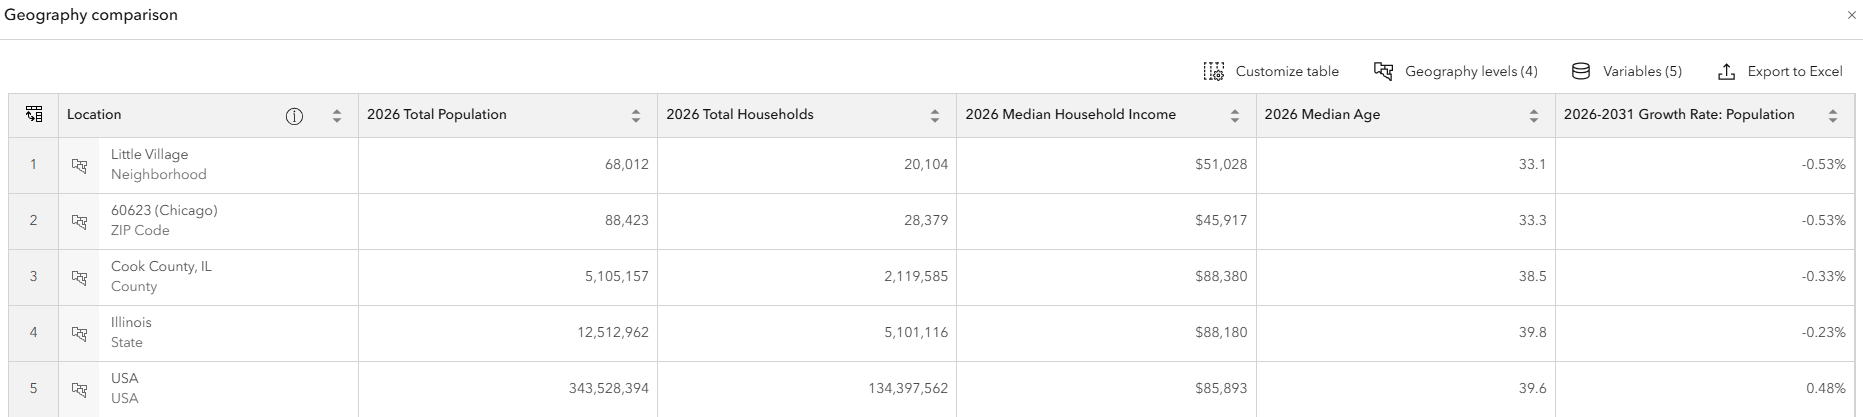
Before comparing specific communities against each other, it is helpful to understand how our identified desert sits within the broader macro-economy. Directly from the map pop-up, we clicked Compare with geographies.
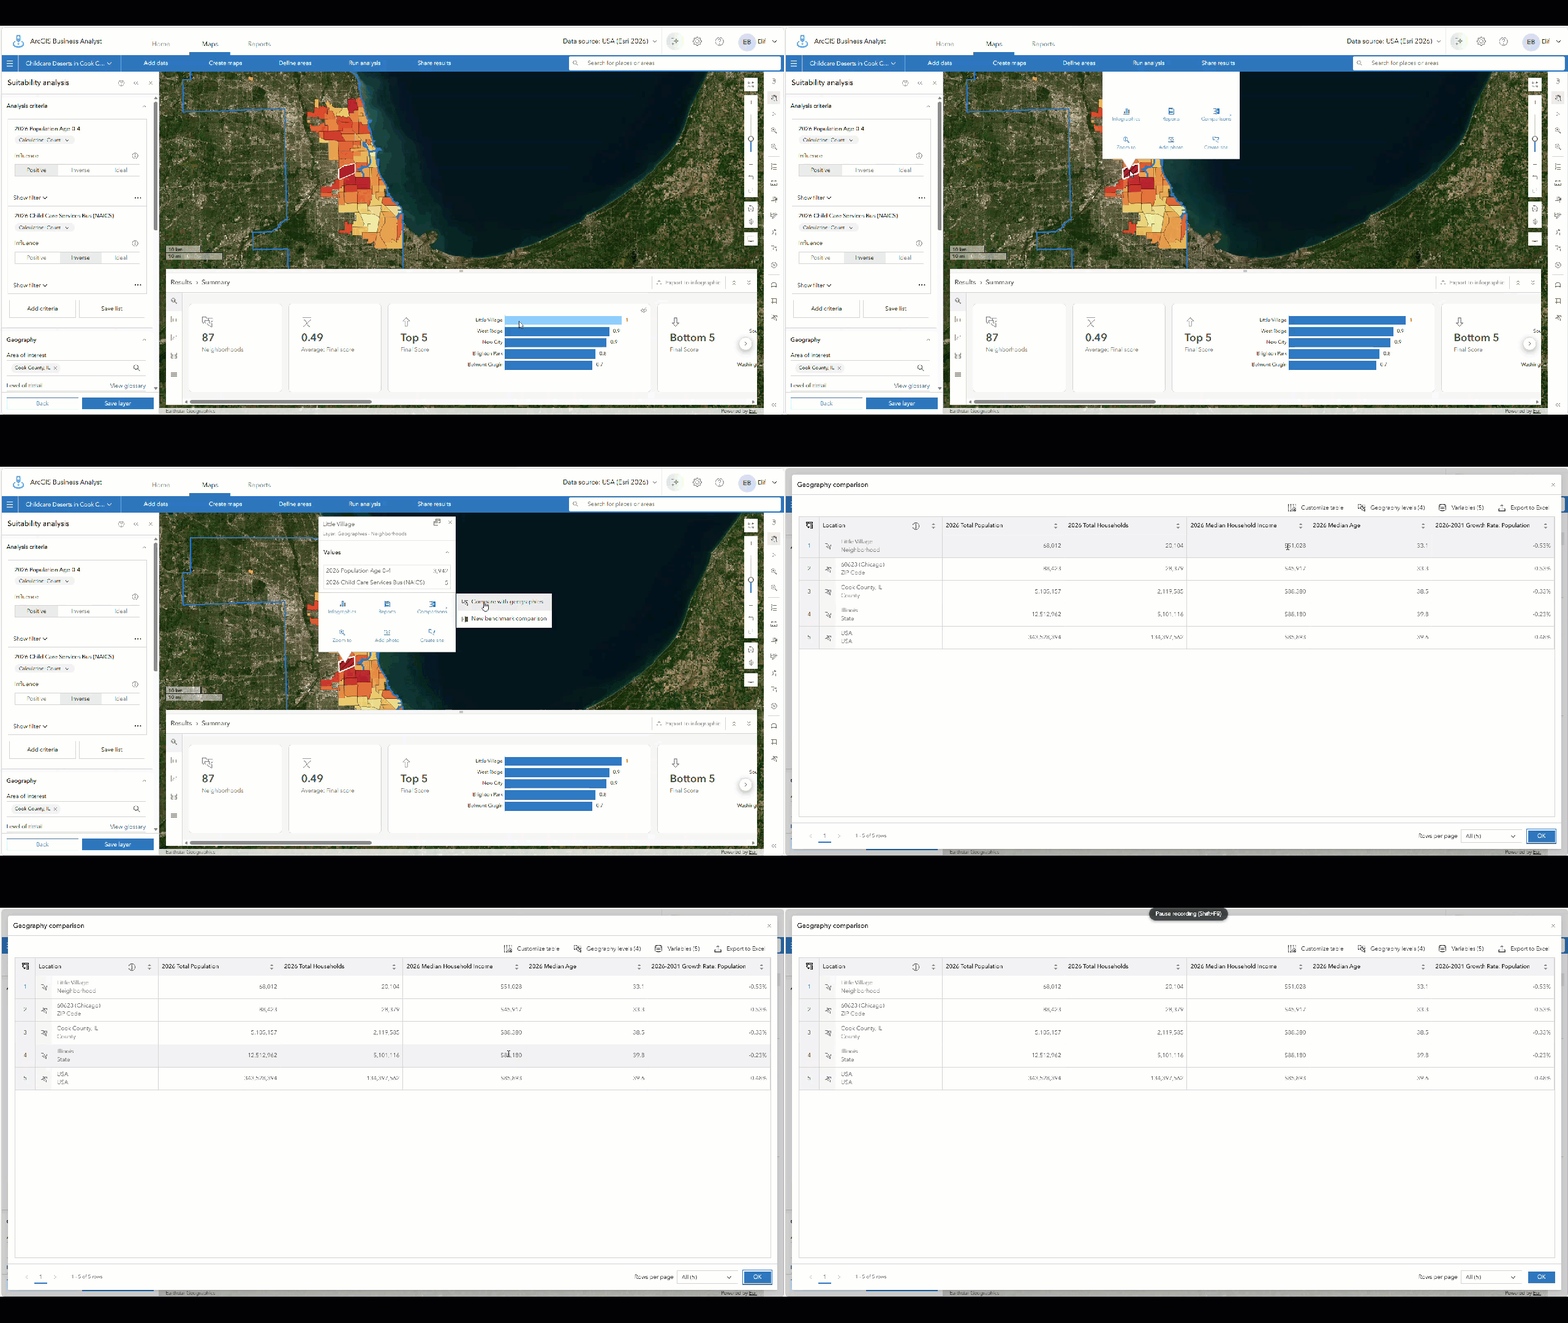
With a single click, the software generated a table comparing Little Village to its nested geographic boundaries: its local ZIP code, Cook County, the state of Illinois, and the national average. Two striking data points instantly emerge: Little Village is significantly younger than the county average (median age 33.1 vs. 38.5), indicating a high concentration of young families—yet, it faces a massive economic divide, with a median household income $37,000 lower than the Cook County baseline. This is the profile of a community with high early childhood needs but strained economic resources.
Step 3: Quantifying the Disparity (Benchmark Comparison)
While the Geography Comparison offers a helpful macroeconomic perspective, we also wanted to examine the local childcare disparity in exact numbers. We ran a New Benchmark Comparison to analyze Little Village directly against Lincoln Park—a well-served neighborhood with fewer children, but far more childcare centers.
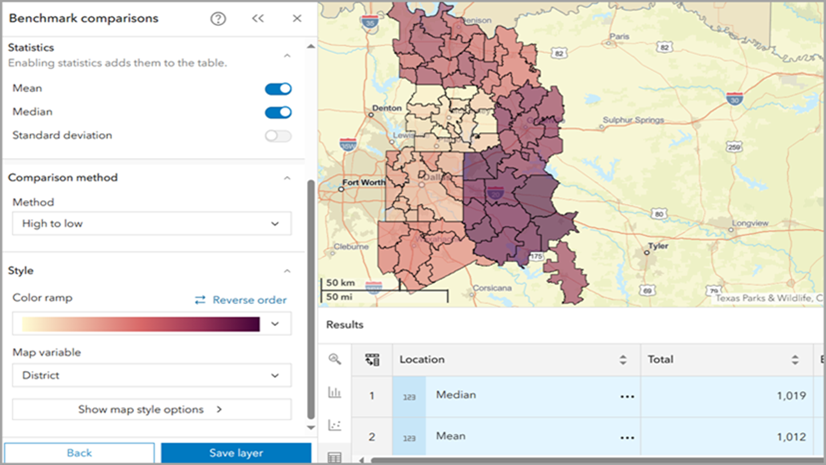
From the same map pop-up, we clicked New benchmark comparison, set Little Village as our base area, used the search bar to add Lincoln Park as our comparison site, and selected our three key variables. The results were stark:
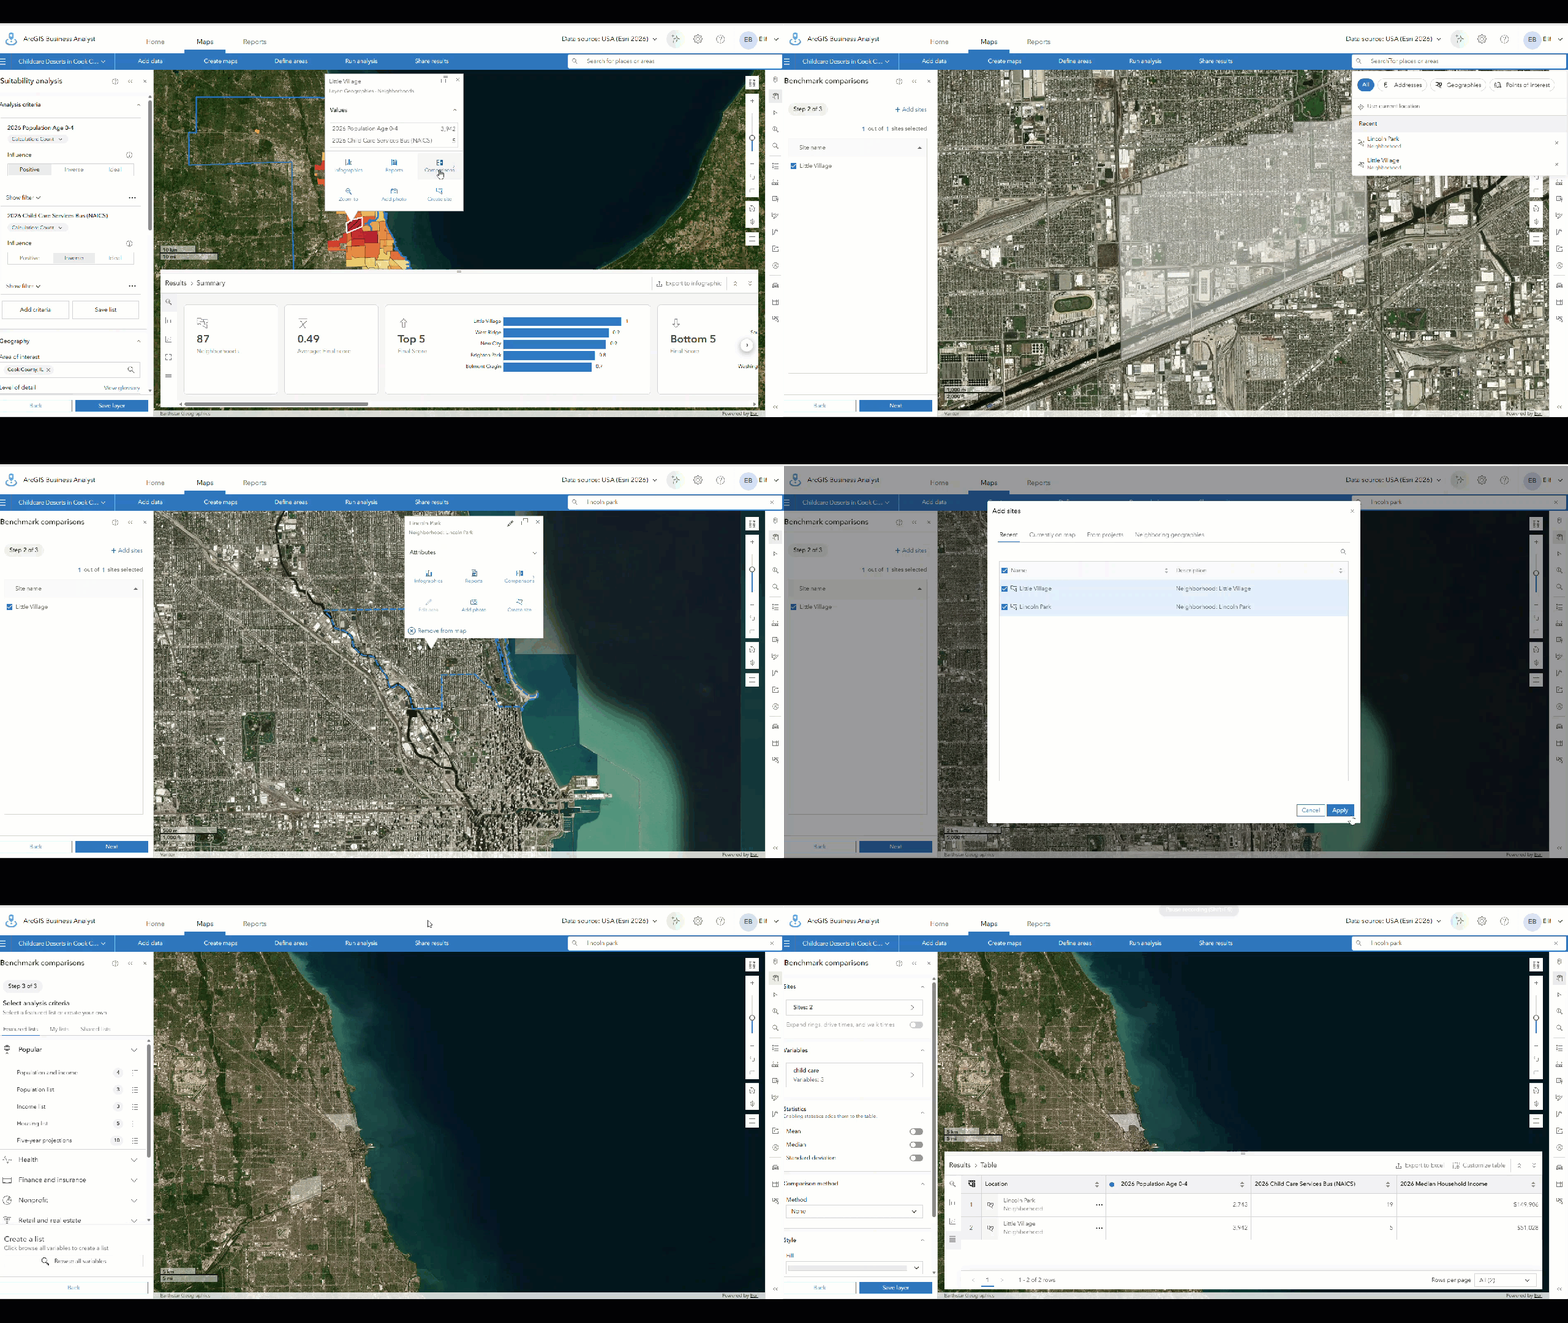

Little Village has nearly 1,200 more toddlers than Lincoln Park, yet roughly 75% fewer daycares. This side-by-side comparison clearly shows how childcare supply often correlates with wealth rather than demographic demand, leaving working-class neighborhoods structurally underserved.
Step 4: Measuring the Physical Impact (Drive-Time Analysis & POI Search)
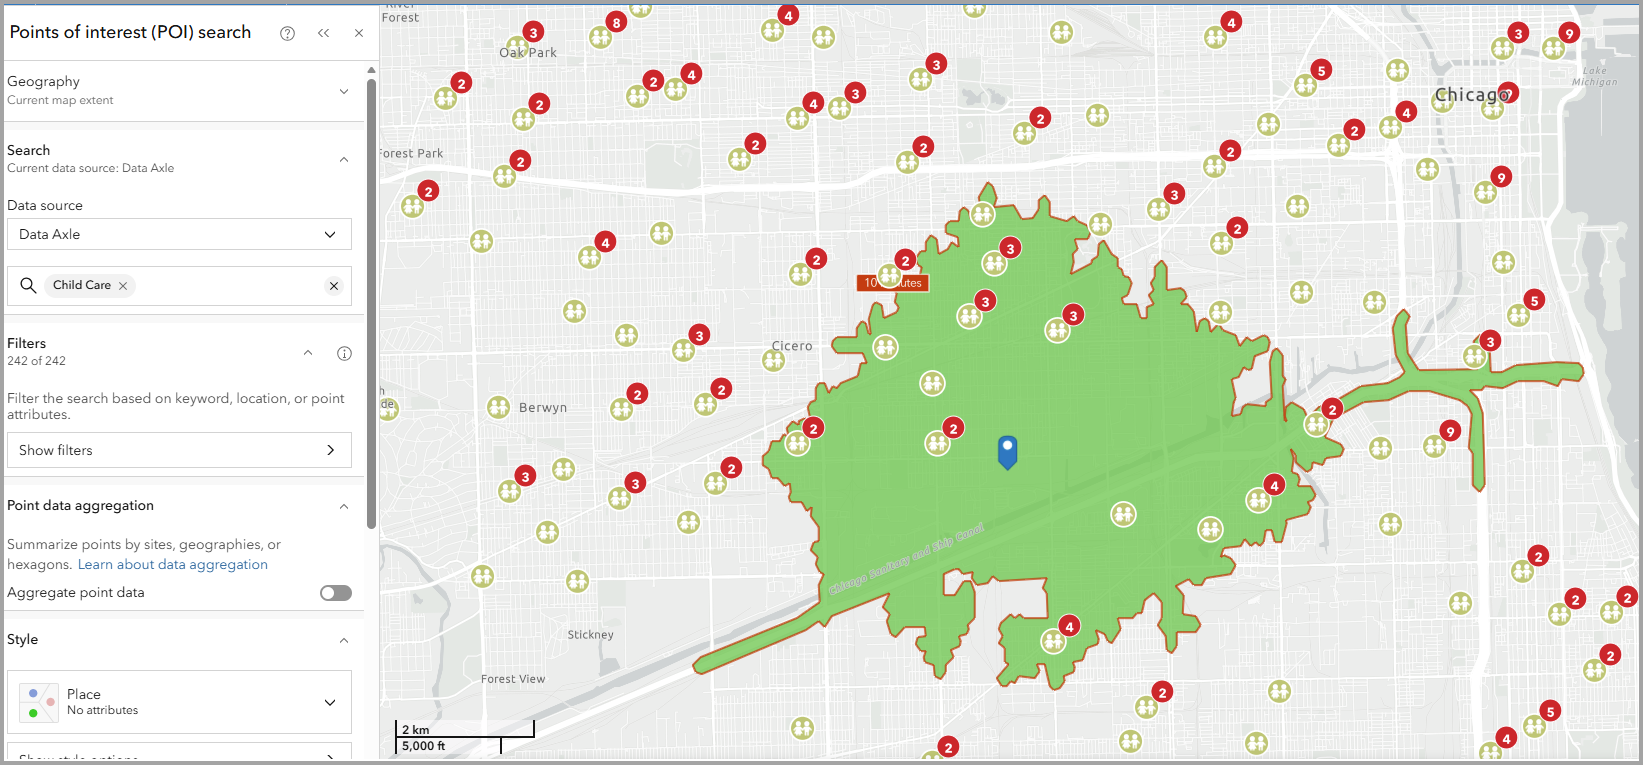
Now that we have quantified the gap with demographic data, we need to understand the physical impact on the ground. We zoomed into Little Village, dropped a pin in the center, and ran a 10-minute drive-time polygon—moving the analysis from abstract data tables to actual commuting reality.
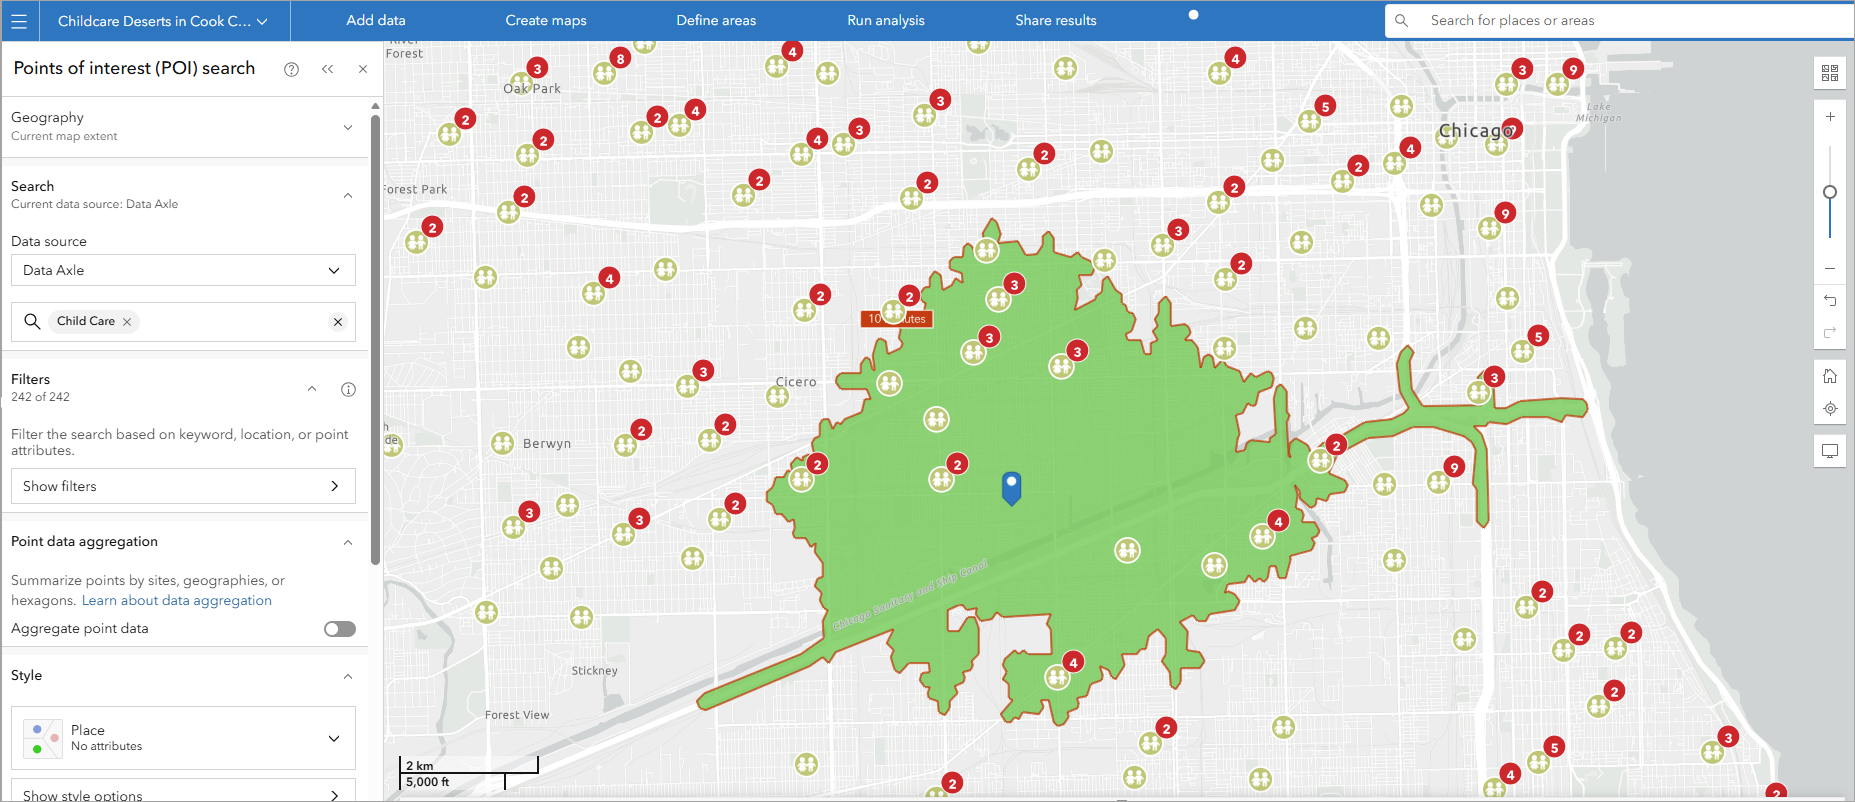
To highlight the physical scarcity, we ran a quick POI search for “Child Care” and layered the live business points onto the map. The result shows a clear shortage in the core of the neighborhood: while a handful of daycares sit near the center, the density is drastically lower than in the wealthier areas to the north and east.
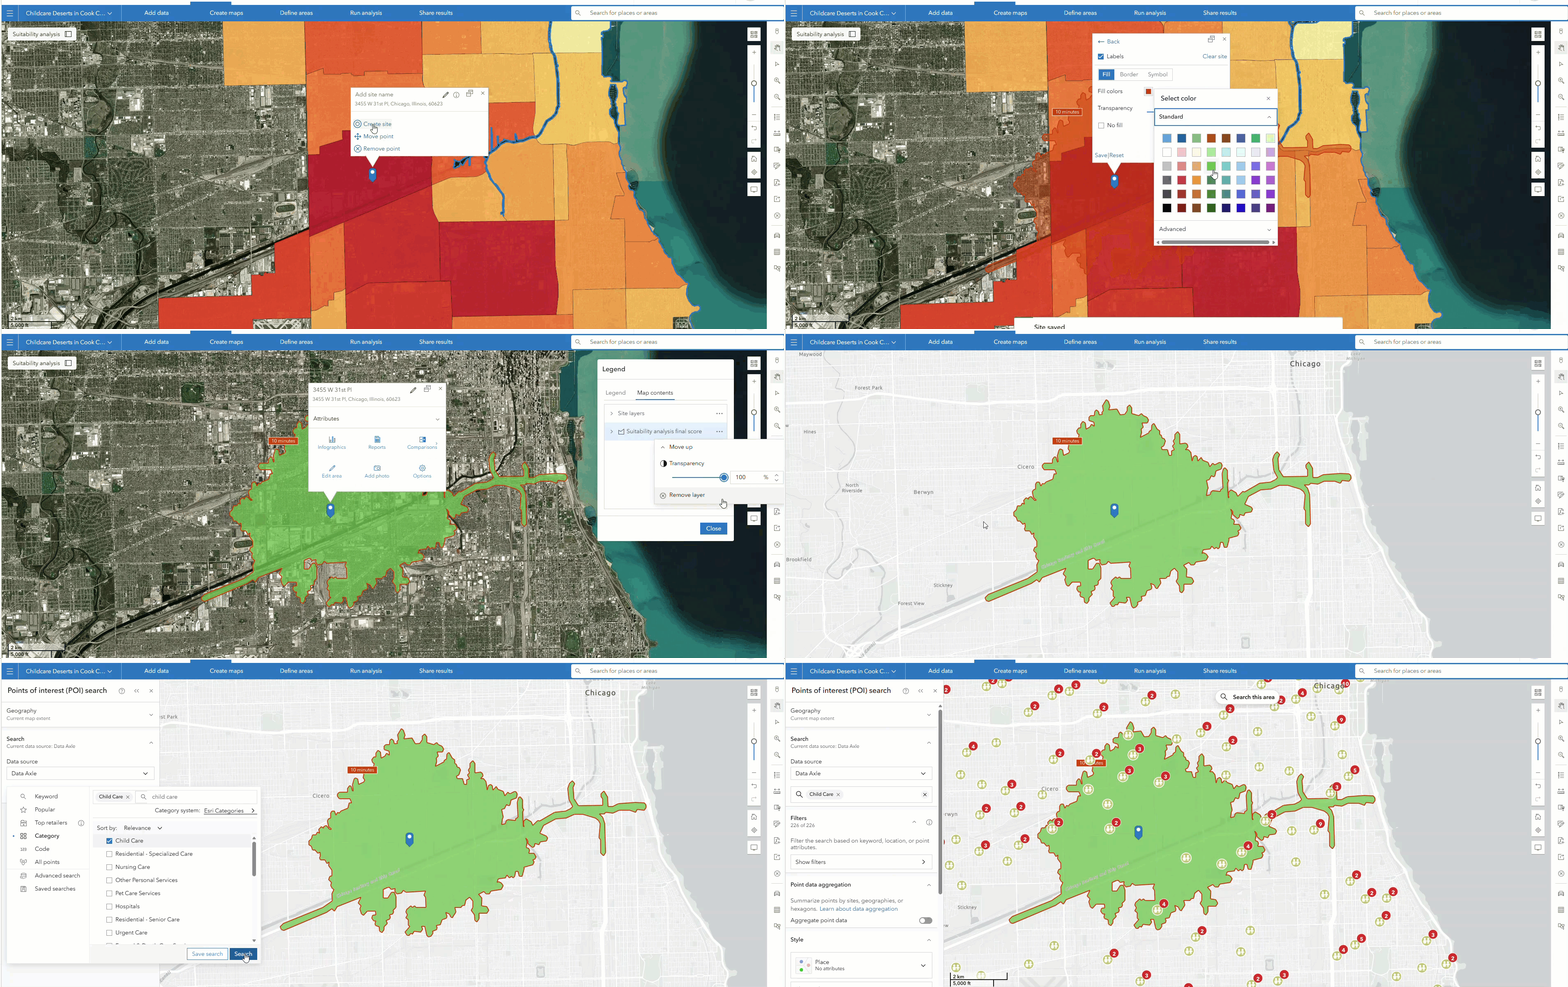
When you remember that there are nearly 4,000 toddlers living within this boundary, it becomes clear that these few scattered centers cannot possibly meet the local demand. For a parent in the core of Little Village without a reliable car, accessing early-childhood care is a significant daily challenge.
The “So What?” for Local Government
Identifying the problem is only half the battle. Here is how local governments and city planners can put this workflow to work—and how some already have.
- Targeted Grant Allocation: To maximize the impact of municipal funding, planners can use these suitability maps to direct block grants to the areas with the highest demonstrated need. (e.g., “Open a licensed daycare inside the Little Village boundary and receive a $50k startup grant.”) This isn’t hypothetical: the City of Sacramento partnered with the nonprofit Child Action, Inc. to distribute stipends—$5,000 for family childcare homes and $7,500 for center-based programs—specifically to providers in underserved areas with a below-average number of childcare facilities. A suitability map like this one is exactly the tool for pinpointing where those stipends should go.
- Informing Local Planning Councils: In many regions, dedicated bodies already exist to plan childcare investment. Sacramento County’s Local Child Care and Development Planning Council, for example, plans childcare services around local family need and advises the county Board of Supervisors and Board of Education on where care is lacking. A neighborhood-level suitability map gives a council defensible, spatially precise evidence to bring to those boards.
- Securing State and Federal Funding: City council members can export these results into highly visual ArcGIS StoryMaps stories or Business Analyst infographics to use as supporting evidence when applying for state or federal childcare expansion grants, ensuring their specific neighborhood is not overlooked.
- Public-Private Partnerships: Planners and economic developers can take the benchmark comparison and drive-time map directly to major childcare providers to demonstrate massive, untapped demand and little competition, then offer property subsidies to incentivize building.
- Transit and Mobility Planning: Because the drive-time analysis shows that parents without cars are effectively stranded, planners can use this data to adjust public bus routes or expand transit options, giving residents a direct, reliable commute to childcare centers in neighboring districts.
This article uses the ArcGIS Business Analyst Web App (Advanced) to identify childcare deserts and map points of interest (POI).
This article uses the Esri Updated Demographics dataset from Esri.
Points of interest data is from the ArcGIS Places dataset provided by Esri.
References cited in this article
- Finding Child Care in Two Chicago Communities: The Voices of Latina Mothers — Chapin Hall at the University of Chicago (2020)
- City of Sacramento childcare provider stipend program (City of Sacramento / Child Action, Inc.)
- Sacramento County Local Child Care and Development Planning Council (LPC) (SCOE Early Learning)
Acknowledgment
The author thanks Stacy Schaetzl and Stephanie Baker, whose idea and conversations around mapping childcare deserts at the neighborhood level shaped this piece, and Gemma Goodale-Sussen for her thoughtful review and feedback.
Resources
To continue your Business Analyst journey, visit the following resources:
- Business Analyst product overview page
- Review pricing and purchase Business Analyst
- Business Analyst resources page
- LinkedIn user group
- Business Analyst Web App video channel
- Business Analyst Pro video channel
- Business Analyst on Esri Community
- Business Analyst Web App login page
- Email the team: businessanalyst@esri.com

Article Discussion: