The next release of ArcGIS Business Analyst is planned for prior to early July Esri’s Users Conference. Here are the key highlights of what’s planned:
Business Analyst Web App
Access Updated 2019/2024 U.S. Demographics Online Data
- 2019/2024 estimates and projections for U.S. demographics
- Consumer Spending data will now include 2024 projections in addition to the latest 2019 estimates
- 2019 Tapestry segmentation, daytime population, market potential, business locations, traffic counts, and crime indexes
- 2013-2017 American Community Survey (ACS) Demographics
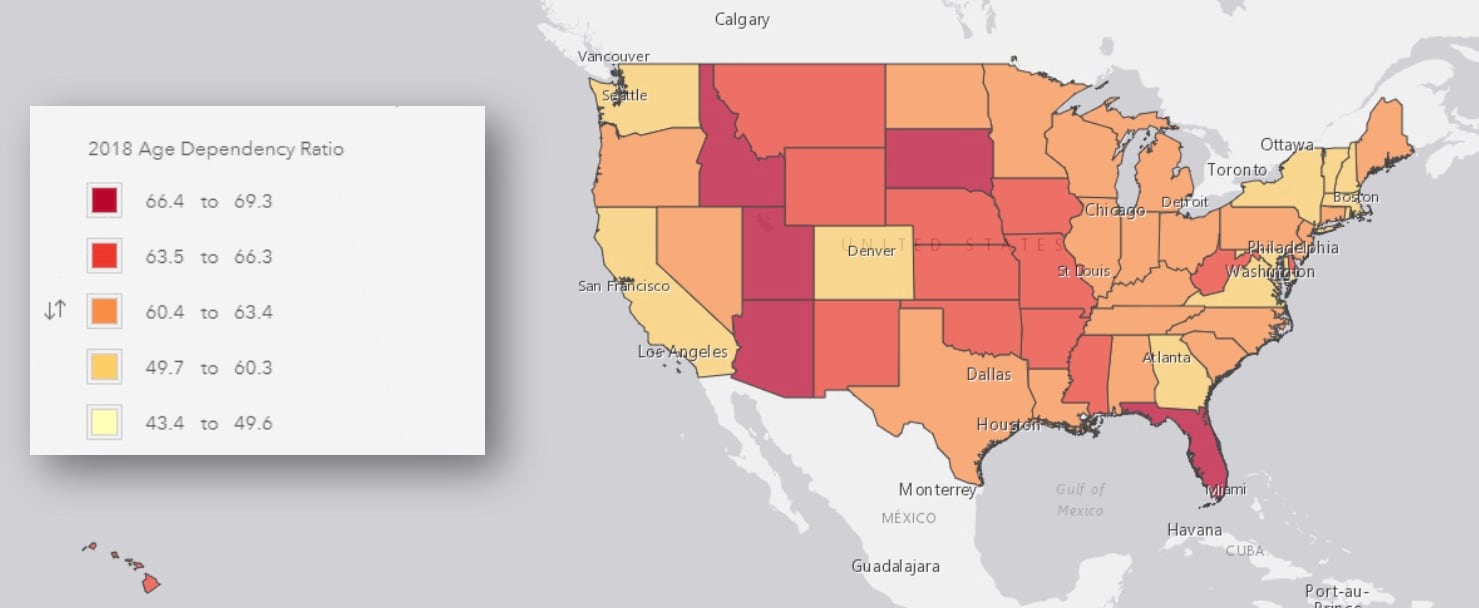
- New variables on Life-stage and Dependency that represent ratios of children and seniors to working population. These ratios help describe the pressure an economy faces in supporting non-working population
- New variables on socioeconomic indicators to help explore the relationship between home value, income, wealth, and home ownership:
-
-
-
- Wealth Index: Measure of the assets of worth owned by a household
- Housing Affordability Index: Ability of a typical resident to purchase an existing home in an area
- Percentage of Income for Mortgage: Part of median household income dedicated to monthly payments on a home priced at the median value
-
-
-
- Michael-Bauer Research data updates for 15+ countries including Puerto Rico, Dominican Republic, Jamaica, Guatemala
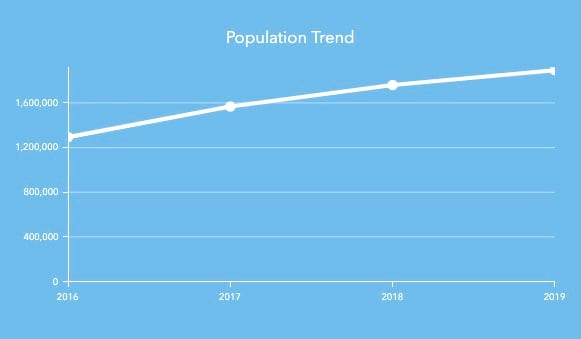
Use Historical Data
Access Historical data for the U.S. Population, Households, and Housing Units. Easily create infographics, charts or maps to understand demographic trends in an area. For example, find out if the population is growing or declining around an existing store or in a community. You will be able to use data for previous years back to the last decennial census. For example, with the 2019 update you can use data for 2019, 2018, 2017, and so on – going back to the last decennial census in 2010.
Easily Add Business Analyst Content to Esri Story Maps
Use a new workflow to add sites, maps, infographics, and reports in interactive story maps in just a few clicks. Select one of the four starter story map templates, choose sites, configure items for the sites such as attributes and notes, infographics, and reports, and add all the selected content in story maps.

You can further customize the story map using the Story Maps building experience. This new workflow will also enable you to create multiple infographics for a single location in one go and embed them in story maps.
Import and Map Geographic Boundaries
Let’s say you have a spreadsheet of Zip Codes or other standard geographies (e.g. counties, states) that you need to map showing the Zip Code boundaries. With the enhancement to the Import File workflow, you will be able to do this.

Simply select the Geographic Boundaries option when importing a spreadsheet, choose which column has the geographic boundary information, and generate the map with geographic boundaries. You can save the geocoded result as a polygon layer or convert those to sites.
Improved Menu Structure
You will notice a new menu structure and renaming, along with two brand-new menus: Add Data, Create Maps, Define Areas, Run Analysis, Share Results. Common workflows are organized so you can navigate to them quicker. The new structure aligns the menu items in the order they are used in your work and organizes common workflows so you can navigate to them quicker. For example, you can add your own data for the project, create maps using your or Esri Demographic data, define analysis areas, run analysis, and share results with others.
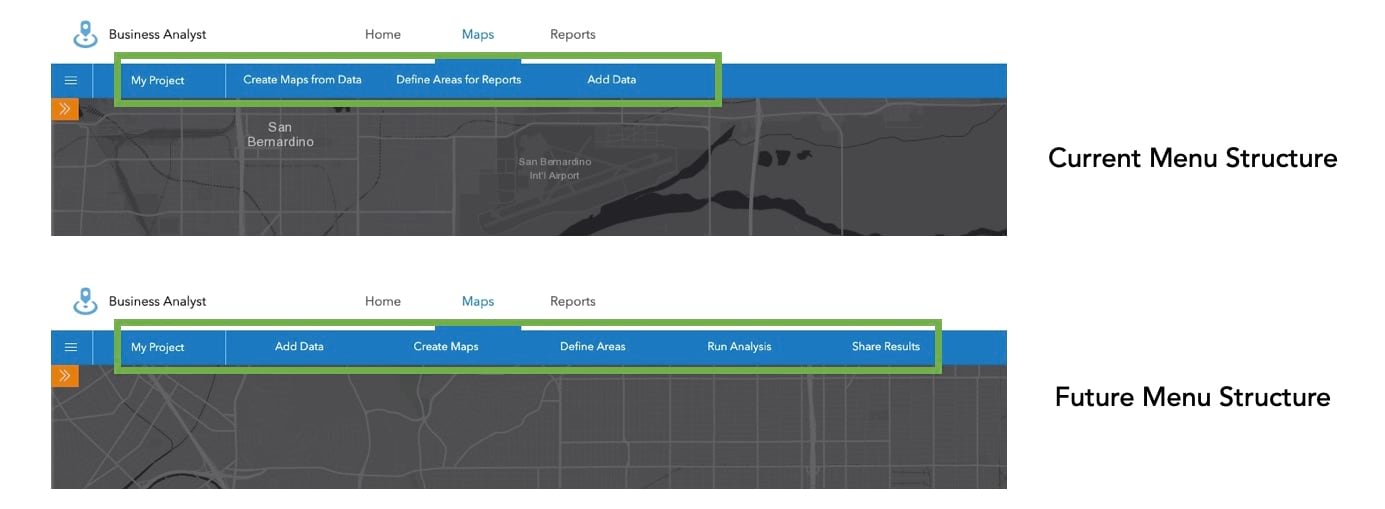
Please note that none of the existing menus and their workflows will be removed. Suitability Analysis workflow will be moved under the new Run Analysis menu. Share Results will be another new menu consisting of the new StoryMaps workflow. Share Results will also include sharing via PDF or Image and ArcGIS Web Maps – helping surface both these capabilities that already exist in the tool palette on the right side.
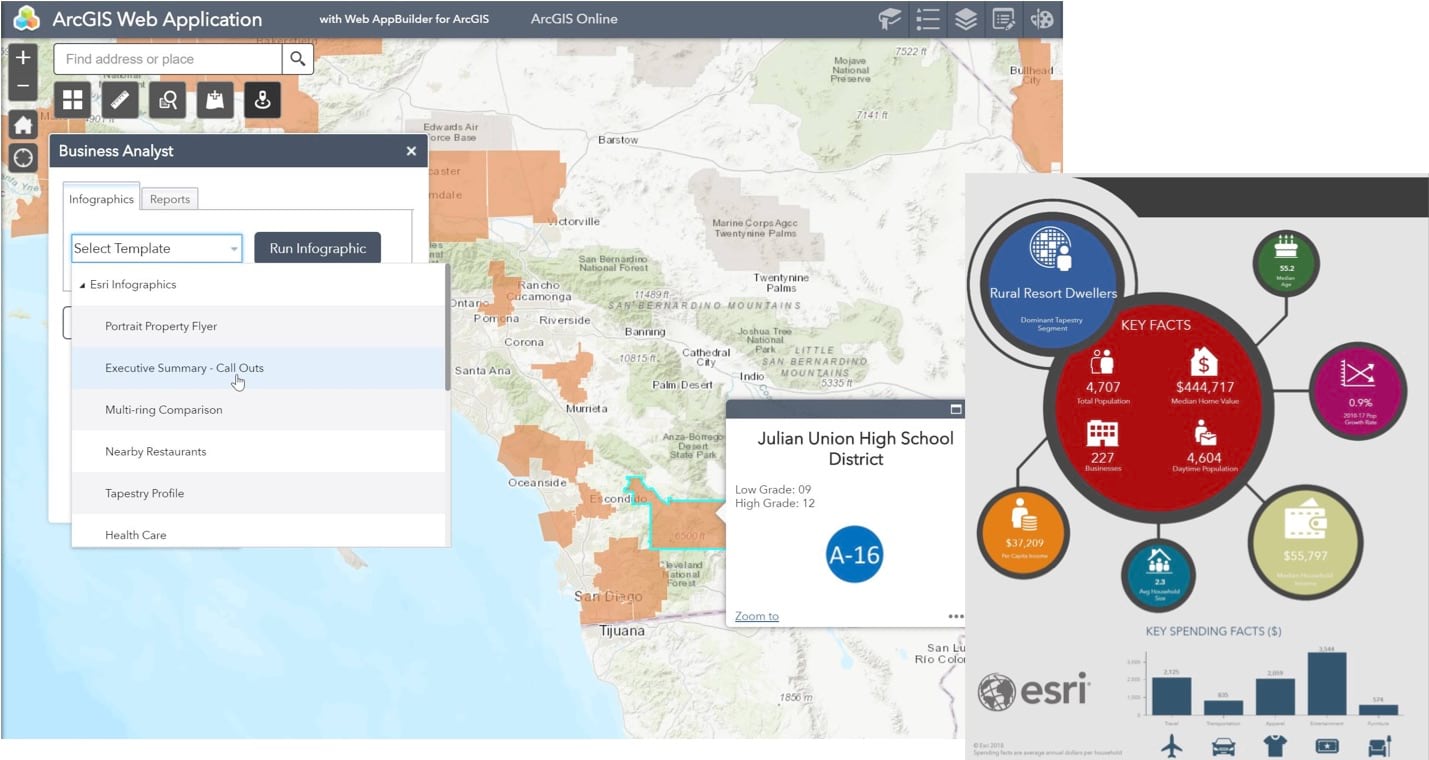
Business Analyst Widget for Web AppBuilder
This new widget enables you to use Infographics and Classic Reports in Web AppBuilder applications. You can use dozens of starter infographic and classic report templates created by Esri as well as any custom template created by you or others in your organization.
Business Analyst for ArcGIS Pro
Search for Businesses and Facilities
Use an interactive workflow to search and filter businesses or facilities in your area of interest. For example, find competitors or analyze a particular industry type. A companion geoprocessing tool will also be added to automate this work through models and scripting.

New Sharing Options for Infographics
Print and Export Infographics to PDF, HTML, and Dynamic HTML formats and share with others.

Share Custom Data
The 2.3 release of Business Analyst for ArcGIS Pro added support for Custom Data – allowing you to set how fields can be aggregated and apportioned (i.e. by population or area) , so you can, for example, enrich your trade areas with your own quarterly sales data and combine that with any Esri Demographic data.
With the upcoming 2.4 release you can publish this Custom Data to your ArcGIS organization and share it with others in your organization so your colleagues can map and analyze them in BA Pro without having to do the setup again and also use them in other applications such as Business Analyst Web App.
In addition to this, you will be able to create new fields with your Custom Data variables using a simple Arcade expression or with Python scripting.

Analyze Locations using Huff Model
Use a new geoprocessing tool to analyze market potential of a new facility based on the impact of competitors, distance, and attractiveness values.

Generate Drive Time Trade Areas
Easily create drive time trade areas using a new geoprocessing tool in the Business Analyst toolbox. While behind-the-scenes, Network Analyst is used to generate the areas, this new tool conveniently adds the attributes used in reports and analysis. Another convenience is that setting your Business Analyst data source (either local or online) is the only setup configuration needed. You can also apply several advanced settings, such as time of day, travel direction, and overlapping options.

Optimize Territories Using Street Network
Use street network distance to control the size of your territories. For example, you will be able to create territories that consider actual roads by using a 10-minute walk time or a 50-mile drive distance. Also, take into account user defined network barriers and restricted areas to limit where a territory can grow. Line barriers could be a river or interstate that can’t be crossed. Polygon barriers could be an existing franchise area or adjacent city boundary that needs to be avoided.

Business Analyst Mobile App
Evaluate Locations using Suitability Analysis
Run suitability analysis on the go. Gather or update location information using the BA Mobile App, use suitability models created in the BA Web App, and get the suitability score for the location.

Please note that all planned updates are subject to change without notice. A comprehensive list of implemented updates will be provided in a post-release What’s New blog.


Commenting is not enabled for this article.