This article includes schedule information such as dates, release numbers, or scope that could change without notice. Customers and partners are advised not to make business or purchasing decisions based on such forward-looking statements.
For the upcoming November 2022 release of the ArcGIS Business Analyst Web App and ArcGIS Community Analyst, our team focused on updating the demographic data and improving the infographics and reports in the app.
The following are some of the features in the upcoming November 2022 release:
- What’s in My Community infographic
- Infographic enhancements
- New Canadian infographic templates
- New Demographic and Income Profile report
- 2022 Canadian demographic data
- Other data updates
What’s in My Community infographic
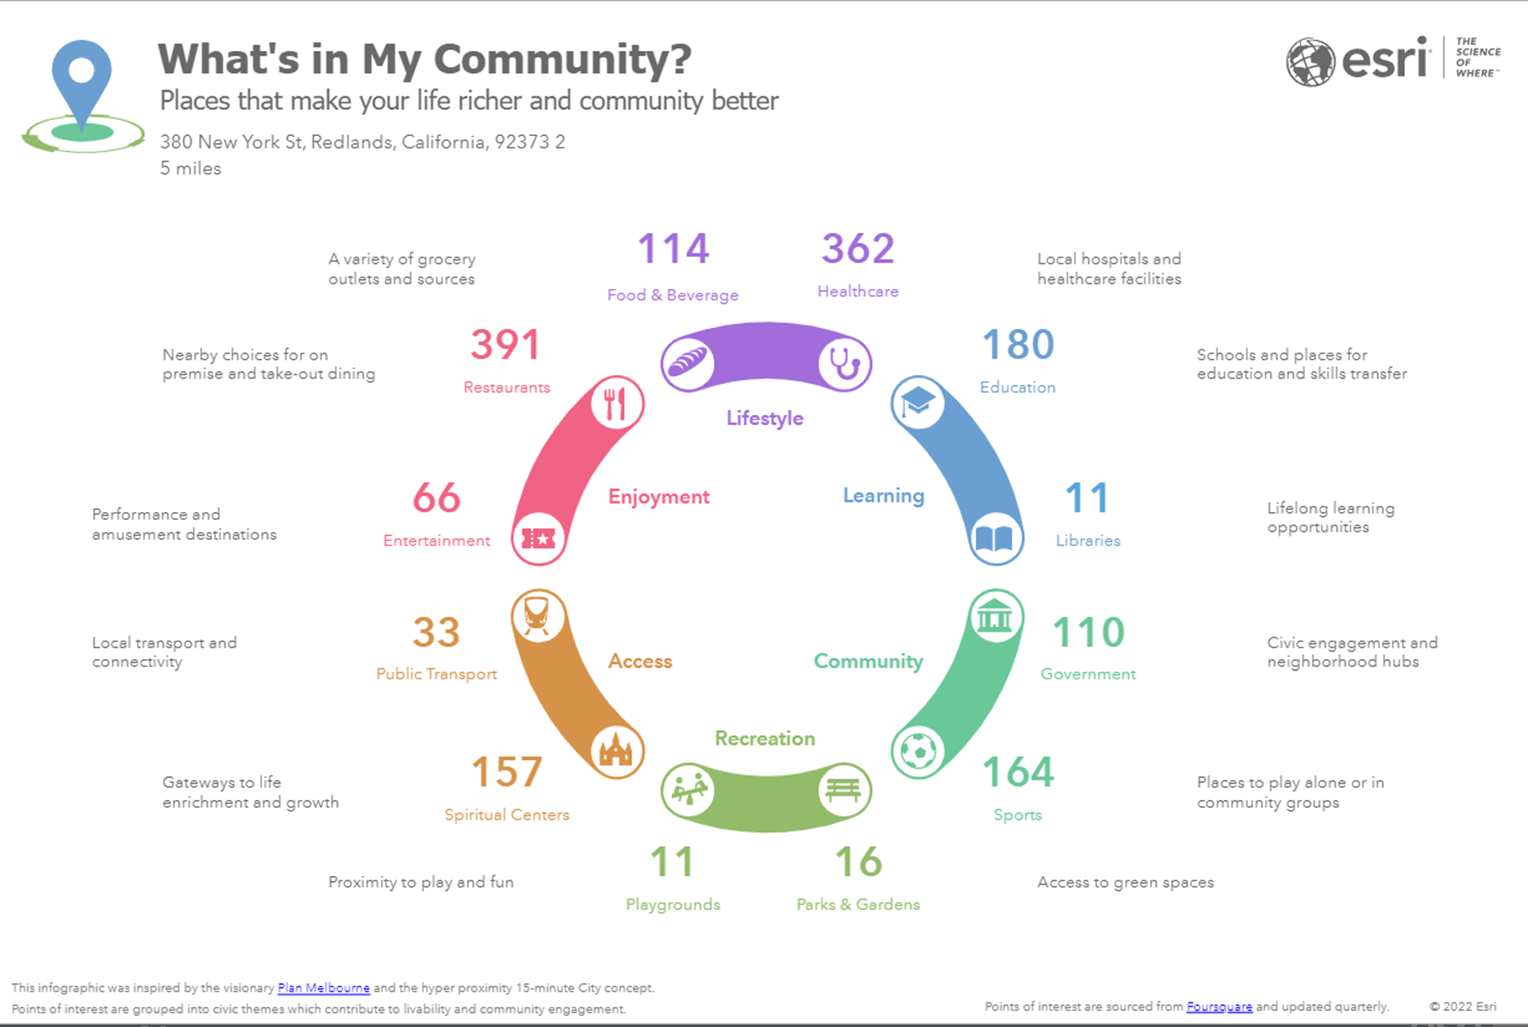
Neighborhood matters, and it is natural for people to want to learn more about the community they belong to. Inspired by the visionary Plan Melbourne and the hyper proximity 15-minute city concept, we designed a new infographic template called “What’s in My Community?” This infographic helps you identify nearby places that make your life richer and your community better, with information on points of interest in your selected neighborhood, such as grocery stores, hospitals, public transport, parks, playgrounds, and more. The infographic will be available for the USA as well as other countries.
Infographic enhancements
Besides adding new reports and infographics, we also worked on infographic enhancements, such as a static map option for batch HTML exports, dashboards, and ArcGIS StoryMaps stories. Additionally, the maximum number of Nearby locations has been increased to 5,000, and there are new conditional styling options for pie and donut charts.
Batch exporting of static maps
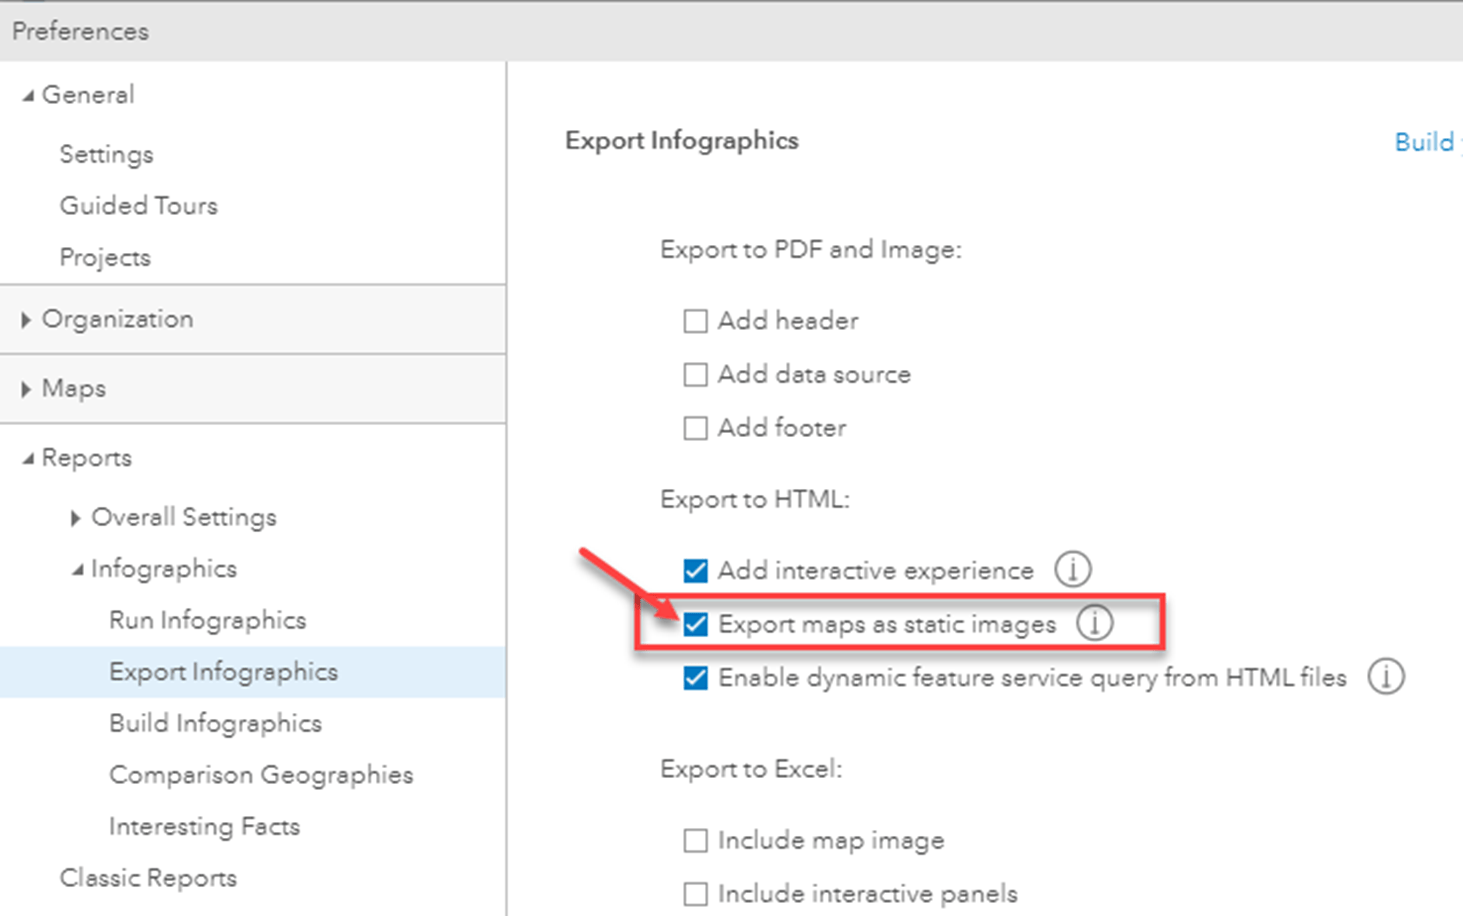
When exporting infographics to dynamic HTML, or sharing to ArcGIS Dashboards or ArcGIS StoryMaps, you will have the option to create static maps (images) for infographic templates that contain interactive map elements. Previously, this option was only available when running and exporting infographics to dynamic HTML one at a time. Because users requested the same capability for batch exporting, we made it available in the upcoming release.
To access this feature, open your Preferences and check the Export maps as static images option when running infographics in the application and when batch exporting. Enabling the Export maps as static images option also means that when exporting infographics in dashboards and stories, the included map will be a static image. Please note that enabling this option will significantly increase the export time.
Nearby locations
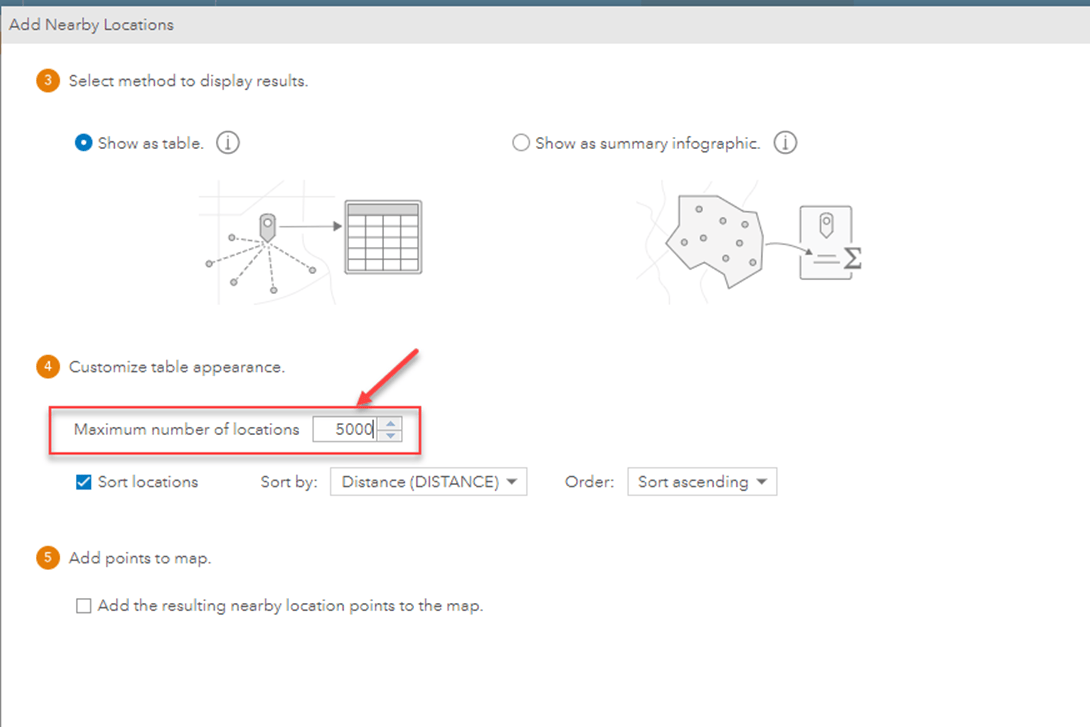
Another enhancement request we received was increasing the maximum number of Nearby locations when building infographics. In the upcoming release, we have increased the limit from 500 to 5,000 (consistent with classic reports) to satisfy custom layer use cases. You can now set the maximum number up to 5,000 locations.
Conditional styling options for pie and donut charts
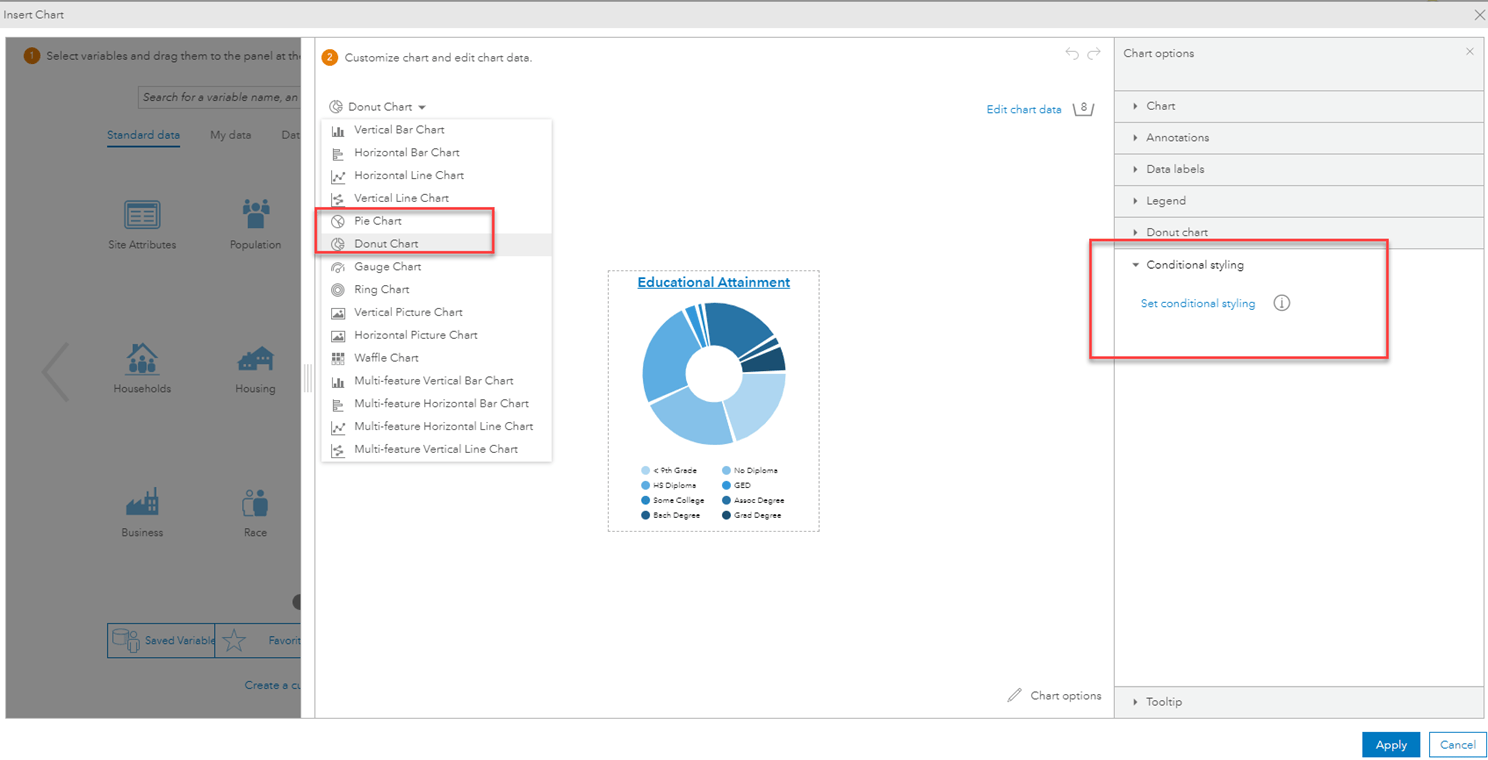
Conditional styling allows you to display different chart colors based on values or ranges you set. This styling option was already available for bar, ring, and waffle charts. Starting from the upcoming release, you can also apply conditional styling for pie and donut charts.
New Canadian infographic templates
When analyzing within Canada, you can employ five new infographic templates to unlock insights about your community, spending facts, real estate, and more. New infographics include:
- Community Profile
- Key Demographic Indicators
- Real Estate
- Segmentation and Spending Facts
- What’s in My Neighbourhood?
New Demographic and Income Profile report
ArcGIS Business Analyst reports are very popular among our users, as they help you learn about a site, outlining key facts such as business and demographic information. The Business Analyst team is working on modernizing and improving classic summary reports. Our goal is not only to make the report look more attractive and reader-friendly, but also to enable our users to interact with the report.
In the upcoming release, you will see our redesigned Demographic and Income Profile report. You will be able to interact with the report’s components – click an icon to view the data as a table or chart or filter the values in the chart. You can share the report in HTML format with others, which allows them to interact with and explore key indicators in the report. The options to export as PDF and Excel files remain available.
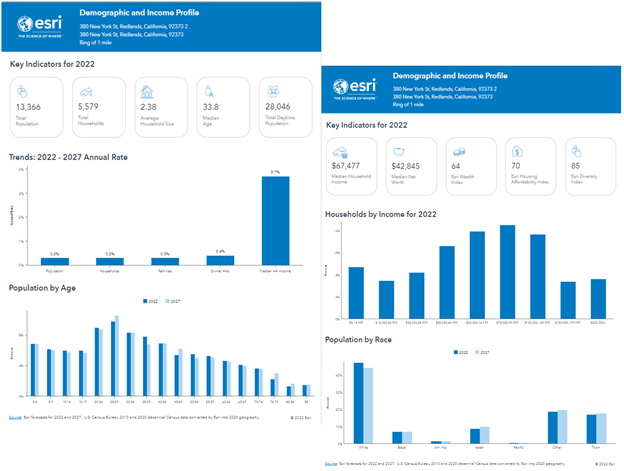
Please note that, at this time, the new template will only be available to users who have an Advanced license and that it is a USA infographic. You can access the report under Build Reports > Build infographics > Add template > Browse gallery > Demographic and Income Profile (Esri 2022). We encourage you to try out the new template and look forward to hearing your feedback.

This is the first step of our effort to modernize and improve our classic reports. The team plans to give other classic reports a new look in our future releases.
Data enhancements
The ArcGIS Business Analyst team works closely with Esri’s Data and Location Services team. We are excited to announce the following data updates for ArcGIS Business Analyst Web, Mobile, ArcGIS Business Analyst Pro using Online data, and ArcGIS Community Analyst:
2022 Canadian demographic data
Esri partners with Environics Analytics to provide advanced demographic datasets for Canada. The November 2022 release contains the annual update to the Environics Analytics datasets. The updated 2022 demographic datasets include Canadian Demographic Estimates and Projections, CensusPlus, Daytime Population, Household Spending, Market Segmentation (PRIZM), and Demographic Trends.
Other data updates include:
- Business locations (Data Axle and Safegraph) for the U.S.
- Traffic data points (Kalibrate) for the U.S.
- Global Points of Interest (Foursquare)
- Michael Bauer Research data updates for 62 countries and regions
Please find more information about the data updates in What’s Coming in Esri Demographics (Nov 2022).
Additional resources
We hope you find the enhancements of the November 2022 release helpful. Additionally, please visit the following sites for more information on ArcGIS Business Analyst:
- Join our LinkedIn Business Analyst User Group
- Join our Business Analyst Esri Community
- Read more Business Analyst blog articles on ArcGIS Blog
- Watch Business Analyst videos
- Visit the Business Analyst Resources page
Sign up for a 21-day free trial of ArcGIS Business Analyst Web App



Article Discussion: