The Generate Customer Derived Trade Areas tool is an important and popular mechanism to understand the coverage area of a customer base.
Here are some examples of how organizations use it:
- For our 500 stores, what areas cover 65% of my closest customers…how about 65% of customers buying my newly launched product – is there geographic difference?
- Our most successful Helsinki urgent care facilities have 40,000 people living within 70% of the total patient base – does our Espoo, Finland location support this?
- Where are we overlapping our corporate-owned franchises based on 55% of our best customers’ residences? Do we have some inefficiencies?
With the release of the ArcGIS Pro 2.2.2 Patch (2 Cubed?!) the Business Analyst team included improvements to how the tool calculates these percentages – the result will be a more accurate geographic representation of customer bases. Dial in the focus!
Here’s a few examples of what you can expect:
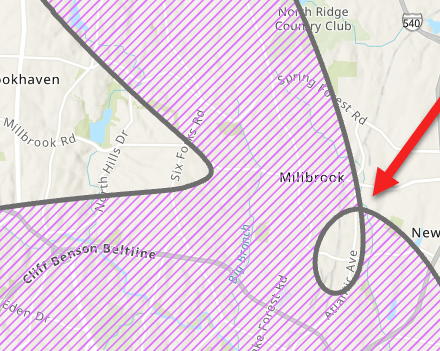
These inverted polys below? Pretty much gone. We improved the way the trade areas are built for oddly shaped customer bases – this often happens when a store is across a bridge, along a coastline, or when there are simply not a lot of customers in an area at all.

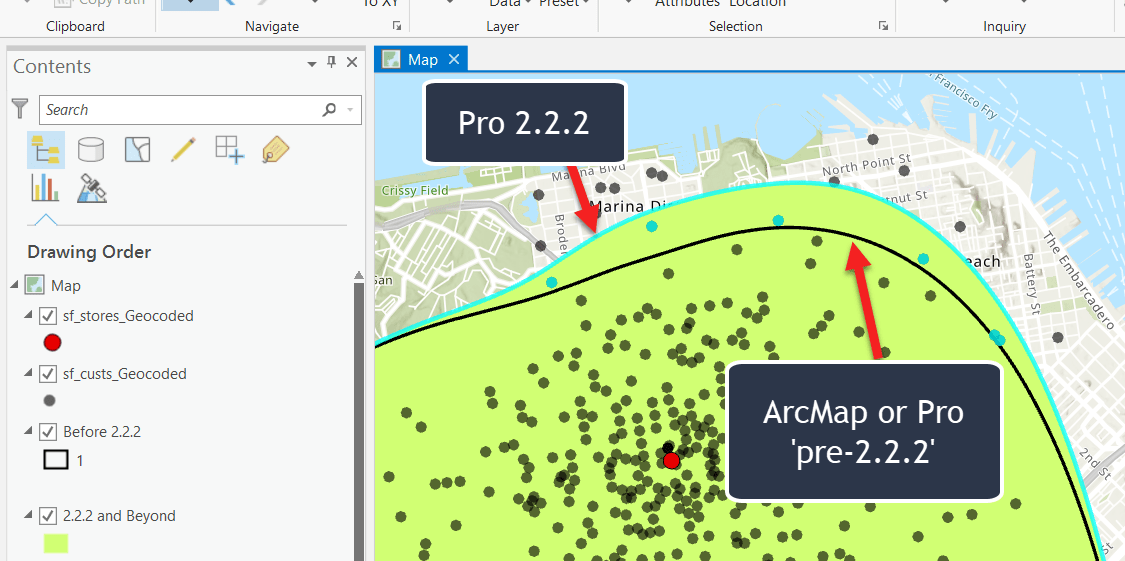
Here’s another issue that is greatly improved – we now calculate a greater point density around customers. This allows the curves to be closer to the customer points, resulting in improved arching and smoothing.
Below shows a BEFORE 2.2.2 and AFTER 2.2.2 example of this scenario using the same inputs.

So there is a visual difference in overall area, but also consider these stats. I add demographic variables to the boundaries using the Enrich Layer tool.
This clearly shows the not-so-subtle impact that the improved algorithm can have on understanding your customer base.

Here again is the 2.2.2 patch download.
Let us know if you have any questions!
Kyle + the Business Analyst Team

Commenting is not enabled for this article.