ArcGIS Business Analyst includes a web app and a mobile app (and a Pro extension, Experience Builder widget, and Enterprise environment—but let’s stay focused here).
The mobile app is a companion to the web app; it offers a subset of capabilities for on-the-go analysis. In this article series, you’ll learn about how you can use the mobile app to create a site, take site photos, compare and customize site facts, and run infographics.

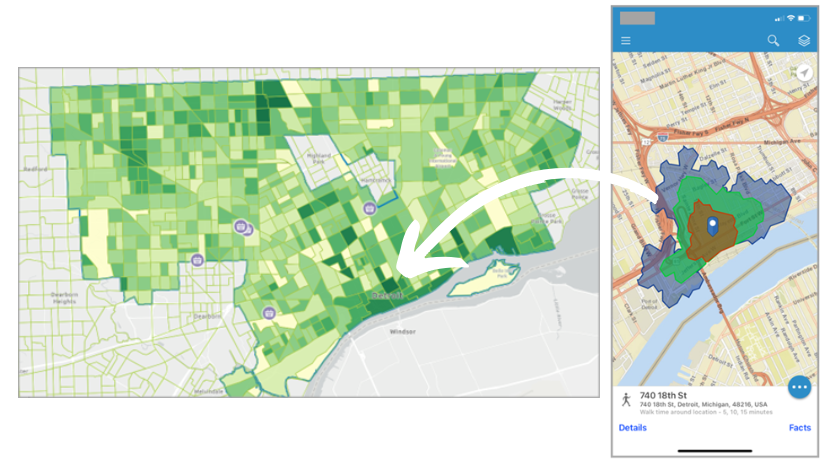
In this blog article, you are a flea market coordinator searching for a site for your pop-up event in Detroit, Michigan. Typically, flea markets are temporary street markets with various vendor booths. You used ArcGIS Business Analyst to locate and create a site. Now you are viewing, customizing, and comparing facts for your potential pop-up flea market at 740 18th St Detroit. This scenario is entirely fictitious, and while it may reference real-world locations, it does not consider zoning laws or actual land permissions.
Facts in ArcGIS Business Analyst Mobile App highlight key business and demographic data. There are two facts lists provided:
- Standard Facts include a curated list of key demographic variables.
- My Facts include a customizable variable list.
You’ll explore Standard Facts, customize your variables in My Facts, and use Compare to compare your site facts with other standard geographies. With standard facts, you can view a curated collection of demographic data for your site, like population and age. With customized facts, you can add consumer spending variables to strategically plan which vendors you want to invite to the flea market. With fact comparisons, you can see how your site’s standard facts compare to other standard geographies, like the local census tract, ZIP code, state, or national averages. You can also compare with another site.
All that said, let’s get started!
View site facts
You’re going to start your fact analysis by first… opening the facts. There are two different ways you can do this in the mobile app.
- Tap Facts.
- Tap Details. On the Location Details screen, tap Facts.

The Facts screen has two tabs: Standard Facts and My Facts. Let’s start by browsing the Standard Facts list, which is a list of curated demographic variables.

By default, the standard facts show the demographic data for the population within the smallest walk time buffer around the potential flea market site (740 18th St Detroit). To change which walk time buffer is used, click on the site address and select a different walk time. The standard facts are automatically updated to show the demographic data for the population within the selected walk time buffer.

You can see that for the 15-minute walk time buffer, that there are about 1,400 people with an average household income of about $66,000. To learn more about the community’s unique socioeconomic and demographic dynamics, tap the Dominant Tapestry Segment variable.

The Dominant Tapestry Segment variable represents the most prevalent ArcGIS Tapestry segment. The ArcGIS Tapestry dataset categorizes residential areas using a segment system based on shared demographic, socioeconomic, and lifestyle characteristics.
Your site’s Dominant Tapestry is K1 Legacy Hills, with higher-than-average age and a preference for shopping locally. This is a good sign for your flea market! Residents who shop locally might be eager to support small businesses at a neighborhood flea market.
Now it will be useful to better understand what the community around your flea markets wants to buy. You can customize your facts by adding consumer spending variables to explore how much money was spent on entertainment, clothing, household goods, and more by residents within your site area.
Browse consumer spending data with customized My Facts
Let’s customize facts with consumer spending variables. Your customized facts list is called My Facts. On the Facts screen, tap My Facts and click the ellipsis (Options). Select Edit My Facts.

You want to create a custom list of consumer spending-related facts. For example, below is how the list may look if it was previously setup to explore health related information. You will remove all variables except for the Vitamin and Supplements spending, which could be useful for your current scenario. In edit mode, select them and tap Remove selected. Then, tap Add variables.

On the next screen, you can search for variables using the search bar at the top or browse available variables. Tap Standard data, and in the list of categories that appears, tap Spending. Flea markets usually feature food vendors, so you will start by looking at Dining Out variables.

Browsing the Dining Out subcategory, you see that there is a variable for spending on mobile food vendors and fast food, which is useful information. Tap the button to the left of a variable to select it. By default, the total spending number is selected but you can tap the arrow to its right and opt to select the Average or Index. Tap Back to return to the previous screen and when done selecting variables, you can tap Add to My Facts to add the selected variables.

Continue adding variables. Utilize the search and browse the other spending subcategories to find more relevant variables and select them. While you’re in edit mode, you can also make these changes to the variables you’ve selected:
- Reorder the variables by tapping the button to the right of a variable and sliding it up or down in the list.
- Tap on a variable to edit its name.
When done, click Save.

You have successfully customized My Facts to include your curated selection of consumer spending-related variables.

You can now open any of your sites and view these facts for it by going to the My Facts tab.
Compare site facts
While demographic and consumer spending data is useful in understanding the population directly around your potential flea market site, it could be helpful to contextualize the data by comparing it to other standard geographies. You can use fact comparisons (Compare Site) in the mobile app to compare the smallest walk time buffer around your site to other standard geographies, like the local ZIP code, city, state, or national averages.
There are three different ways you can launch site comparisons in the mobile app.
- Tap Details. On the Location Details screen, tap Compare.
- Tap the ellipsis button (Site options) and click Compare Site.

By default, the Standard Facts are shown comparing your site’s smallest walk time buffer (in this case, 5 minutes) to the national average.

The standard demographic data comparison shows information like the total population, median age, average household income, and more. You can use this information to get a general understanding of what your hyper-local neighborhood composition is like compared to other standard geographies.
While national average comparisons are useful for large-scale businesses, your flea market pop-up is hyper-local. It would be more helpful analytically to understand the business and demographic qualities of the city of Detroit compared to your site.
To change the comparison from the entire country to the city of Detroit, tap the pencil icon next to United States and click Place from the standard geographies list.

Now you can view demographic information about your potential flea market pop-up compared to the city. Generally, the hyper-local neighborhood is older than the city average with a smaller household size and slightly less average household income. This can inform your view of the types of vendors most likely to be interested in setting up a booth at your flea market location. You can also select another site, which would be useful if you needed to compare it with another prospective site for this flea market.

Let’s recap!
In this tutorial, you viewed facts for your site using different walk time buffers, customized your facts list to include consumer behavior data, and compared your site’s data to national and city averages. With Standard Facts, you gained a general understanding of the demographic composition of your site. To understand the consumer behavior of people within your site, you customized My Facts with consumer spending-related variables. With Compare Site you contextualized your site’s data compared to city and national averages.
You can use this information to strategically determine what kind of vendors you should invite to meet customers’ wants and needs.
What’s next?
You can use the mobile app to run infographics on-the-go. Infographics are unique, presentation-ready templates that you can use to share key data indicators for a variety of purposes, audiences, and industries. To try it for yourself, see the next tutorial in this series: Run an infographic on-the-go — Get started with ArcGIS Business Analyst Mobile App.
This article was originally published on March 29, 2021, with the title “Learn How to compare sites using ArcGIS Business Analyst Mobile App” by Geetha Narayanan. It has been updated and includes content inspired by Geetha’s blog “Explore How to Customize Facts in ArcGIS Business Analyst Mobile App” published on July 29, 2020.


Article Discussion: