ArcGIS Business Analyst includes a web app and a mobile app (and a Pro extension, Experience Builder widget, and Enterprise environment—but let’s stay focused here).
The mobile app is a companion to the web app; it offers a subset of capabilities for on-the-go analysis. In this article series, you’ll learn about how you can use the mobile app to create a site, take site photos, compare and customize site facts, and run infographics.

In this blog article, you are a flea market coordinator searching for a site for your pop-up event in Detroit, Michigan. Typically, flea markets are temporary street markets with various vendor booths. You are looking for a parking lot or open field to host your event. This scenario is entirely fictitious, and while it may reference real-world locations, it does not consider zoning laws or actual land permissions.
To create your site, you’re going to do the following:
- Determine which neighborhood in Detroit could be a viable candidate for the flea market. You’ll use ArcGIS Business Analyst Web App to map flea markets and then perform a suitability analysis to rank block groups based on their consumer spending potential.
- Find the parking lot of your dreams. You’ll use ArcGIS Business Analyst Mobile App in the (fictitious) field to evaluate locations in the area and create a site.
All that said, let’s get started!
Map flea markets
You’re going to start your mapping and analysis with the web app. Use the points of interest (POI) search workflow to map flea markets in Detroit. It might look a little something like this:

To make this exact map, you can use the following parameters:
- For area of interest, use Detroit City, MI. This is the “place” geography area representing the city boundaries.
- For the search, use Data Axle as the data source. Enter flea market in the Category search type and select the matching result. While you could use another search type like keyword or code, the category option usually provides a more curated list of results.
- To see the individual flea market locations, turn off clustering. In the Style section, click Show style options and turn the Cluster points toggle button off.
- For stylistic flair, you can also change the symbol, like using the Market symbol on the POI tab for icons and increasing the icon size to make it pop on the map.
Make sure that you save your layer so that you can access it from the project pane in the future.
Rank block groups by spending potential
Now you can perform a suitability analysis to evaluate which block groups in Detroit have the highest spending potential. With this analysis, your map includes the POI search and suitability analysis layers to give you the full context of your competition and customers. It might look like this:

To make the suitability analysis layer, you can use the following parameters:
- For area of interest, use Detroit City, MI. Like the POI search, this uses the city’s geographic boundaries.
- For the level of detail, use Block Groups. Block groups are the smallest level of detail, meaning it is hyper-local for your analysis.
- For the analysis criteria, expand the featured list group Retail and real estate and select the Spending potential list. This curated collection of variables measures index values of consumer spending on different retail categories, like apparel and personal care products, as well as median disposable income.
- For the Final score scale, use the 0 to 100 option. This option uses a bigger range for the score that provides more nuance to each block group ranking.
- You can also change the color ramp to fit your mapping aesthetic. If you use light green-to-dark green, as pictured above, then the darkest green represents the highest ranked block group for spending potential, and vice versa.
Select your neighborhood of interest
The map shows that the highest spending potential block groups do not currently have local flea markets. There are several options to choose from, but you’re interested in a waterfront location.
The area around Corktown fits these criteria, so zoom in and select the darkest green block group.

That’s it! You’re going to go into the (fictitious) field and explore the block group 261635208.001 using the mobile app. (Now say that ten times fast!)
Explore the block group in the field
Imagine that you are strolling down the sidewalk and exploring the block group that you identified in the web app. You turn to your left and see the best parking lot you’ve ever seen. Recently paved, no potholes, minimal litter. Nice! It’s totally perfect for your flea market. And all you have to do is open the mobile app and create a site using your exact location.
Since you’re not actually walking the streets of Corktown (or, if you are, drop that pin!), you’ll have to rely on your imagination and some old-fashioned tutorial steps.
Create a site with the mobile app
To get started using the mobile app, sign in to the ArcGIS BA app on your phone. You can either use your ArcGIS Online or ArcGIS Enterprise login.
Let’s pick an address that’s within the target block group. Enter this address in the mobile app search field: 740 18th St Detroit. While this address, in reality, brings you to a street view of an empty lot under construction, in the flea-tastic world of your fictitious scenario, this is your ideal flea market spot.

When you create your site, you have to determine how the area around the address is measured. Tap Create Site and use rings, drive times, or walk times to create the site buffer.

- Rings use specified distances.
- Drive times use specified times or are based on road networks to represent the distance traveled to or from the site in a given time.
- Walk times use specified times or distances based on paths and roads that allow pedestrian traffic.
Your target market is locals within walking distance, so you’ll use 5-, 10-, and 15-minute walk times around your location to create your site.

Now that you’ve created your site, it appears on the map in the mobile app and is saved in your Business Analyst project.
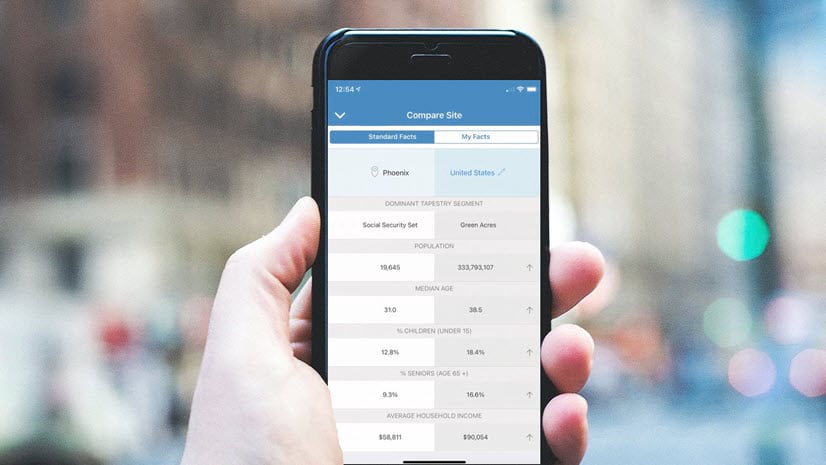
For quick access to actions like running reports, comparing your site facts, taking photos, editing the site, or deleting the site, tap the ellipsis button (Site options). (More on this in the next articles!)

Or you can tap Details to view your site’s location details. This is a great place to take notes during a site visit, like keeping track of a building’s square footage or the building’s facade (frontage). In the case of the flea market pop-up, you could use the Notes section to describe the lot.

For more information on the mobile app interface, check out the Quick reference help documentation.
Let’s recap!
In this tutorial, you evaluated the competition and potential customer base for flea markets in Detroit using the web app and identified a viable area. Then you “went into the field” by exploring the target area, finding your perfect location, and creating a site with the mobile app.
What’s next?
You can use the mobile app to add site photos and take notes while you’re in the field.
To try it for yourself, see the next tutorial in this series: Take site photos for a flea market in Detroit — Get started with ArcGIS Business Analyst Mobile App.
This article was originally published on February 17, 2021, with the title “Learn how to create a site in ArcGIS Business Analyst Mobile App” by Geetha Narayanan. It has been updated.


Article Discussion: