The December 2021 release of ArcGIS Business Analyst features a new workflow: Threshold Areas. Threshold areas are rings or drive times around a site that contain a specified amount of a variable. The analysis starts from the site locations you choose and then expands outward until your threshold is met. For a detailed overview of this new workflow, see Capture your market with threshold areas in Business Analyst.
Threshold areas are very cool. With a few clicks, you’ve got areas on the map containing about 20,000 people who speak Spanish or around 100,000 households with internet access. Did you notice that the previous sentence contained “about” and “around” when describing the values mapped by the workflow? That’s because the threshold value you specify is an ideal value. The algorithm works hard to get as close as possible to this ideal—but the real world is bumpy and weird, informed by all kinds of factors that affect the precision the algorithm can achieve. Location-specific things like population density and placement of census block points mean that the value you enter may not be the value created by the workflow. And you know what? That’s ok.
How the Threshold Areas algorithm works
The workflow is simple: you say where you are interested in, what you are interested in, and how much of that thing you want to capture on the map. The Threshold Areas algorithm starts at the spot you picked and starts measuring, expanding outward in rings or along street networks. The algorithm is iterative, meaning that it runs repeatedly until it satisfies the parameters you specified. Each time it iterates, it assesses four parameters:
- Threshold variable – what you are measuring
- Threshold value – how much of the variable you want
- Target percent difference – how close to the threshold value the final calculation should be
- Increment size – how big of a step the algorithm takes each time it iterates
Let’s say I pick a spot in Cheyenne, Wyoming. I want to create a drive-time area around my point containing 10,000 households with internet access. I define my parameters in the workflow, using the data browser to select the variable 2019 HHs with an Internet Subscription, and then enter 10,000 for my threshold. I leave the default values for target percent difference and increment size. My parameters, then, are:
- Threshold variable – 2019 HHs with an Internet Subscription
- Threshold value – 10,000
- Target percent difference – 5%
- Increment size – 0.5 minutes
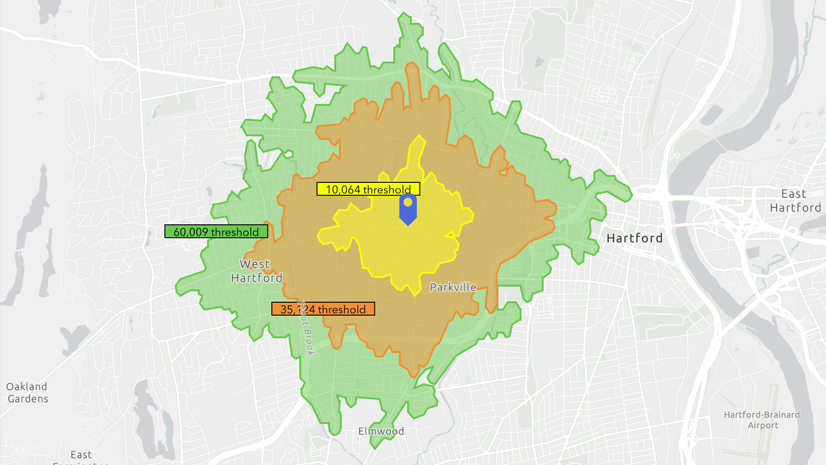
When I click Create Areas, the tool runs and creates the area I requested:

Sweet! I’ve got an area on the map showing me that within a 5.8-minute drive from my point, there are about 10,000 households with internet access. But wait, what does “about 10,000” mean, exactly? My eyes immediately shift over to the workflow panel, where the results are broken down in detail:

Ah, I now see that my actual threshold value is not the same as my ideal threshold value of 10,000. The threshold the algorithm created—9,834 households—represents 98.3% of the threshold value I specified. This falls within the 5 percent difference I’d deemed acceptable in the target percent difference parameter.
The above details show me that the algorithm iterated and reached a value of 9,834. It tried to iterate again, but the next increment larger would have created a threshold value that was less precise. Thus, it reverted back to the most precise value it could attain, given the parameters I specified.
Does this make anyone else want to tinker with those parameters?!
Fine-tuning my parameters
The Threshold settings slider in the workflow allows me to have control over the analysis. I can choose an analysis that either runs with Best Performance or with Best Precision. But what does that really mean? Let’s dive in to learn more about this.

When adjusting the slider, the default values of Target percent difference and Increment size change. For the default “Balanced” position of the slider, the target percent difference is set to 5 and the increment size is set to 0.5 minutes or 0.25 miles (depending on the units you choose). This means two things when running an analysis with the default position of the slider: 1) I am asking the algorithm to get me a threshold value that is within 5% of the threshold value, and 2) I am also limiting the algorithm to iterate with an interval of 0.5 minutes.
Let’s look at an example to see the results when using the default slider position. I am analyzing a bank location in Chicago and one of the requirements of this analysis is to capture Total Population that is within 5% of 150,000 people. I run the analysis, choosing 2021 Total Population as the threshold variable. I select Drive time as my area type and, without changing anything else, I click Create Areas. Here are the results:

The precision level is lower than my requirement of 5%. This means the default threshold slider settings do not work for me and I will have to change the parameters of the analysis.
When re-running the analysis, this time I modify the threshold settings, moving the slider to Best Precision. The target percent difference is set to 1 and the increment size is set to 0.1 minutes. This means that when I run the analysis this time, it will try and get me within 1% of the 150,000 value and will allow the algorithm to iterate at a finer level of 0.1 minutes (as compared to 0.5 minutes in the previous run). Here are the results:

This time the results are exactly what I want. The precision is 98.9%, which means the returned threshold value is indeed within 5% of 150,000.
Reflecting on my two analyses, I can see that the first analysis stopped at 8 minutes. It is possible that the two iterations on either side (7.5 minutes and 8.5 minutes) would have returned a lesser precision compared to the returned threshold. In the second analysis, though, the algorithm had the ability to test values between 7.5 and 8.5 minutes at an interval of 0.1 minutes to get me a more precise result. From the above results, I can see that the second analysis stopped at 7.9 minutes.
Let’s also talk about the impact on the analysis when you change the threshold settings slider. When running the analysis with Best Precision, the algorithm is taking a finer approach (the increment size and target percent difference are smaller) to reach the threshold value. This means the algorithm is more iterative as it tries to find a value that is closest to the requested threshold value. Because it is more iterative, it will consume more credits and the analysis may also run longer. Trust me, the additional wait in many scenarios is worth it! When running the analysis with Best Performance, the algorithm iterates in a more granular way and is less iterative, consuming fewer credits.
As seen in the example above, when running the analysis, I have control over the threshold settings slider. At the same time, I can also manually change the target percent difference and increment size values. I can set an even finer value for the increment size—for example, 0.05 minutes—but 0.05 minutes in a real-world scenario may not necessarily mean anything. After all, how many more people live a three-second drive further? In a big city, the answer may be significant…
The importance of “where”
When choosing the target percent difference and increment size, note that population density and traffic patterns can have a strong impact on the calculation. This is particularly true when creating threshold areas in densely populated urban areas. When large groups of people live clustered together, even the tiniest spot on the map can contain multitudes. Understanding your location can help you decide how best to set your parameters.
For example, imagine you are trying to calculate a threshold area that contains 10,000 people around a site in New York, NY, with best precision (target percent difference of 1% and increment size of 0.1 second). The algorithm iterates and the area expands. It reaches an area that contains 9,500 people. The image below shows the current border of the threshold area in blue, with red dots denoting census block points:

The algorithm iterates once more, expanding the area by the default increment size of 0.1 second. Within this 0.1-second expansion, however, lies another census block point: an apartment building that houses 2,500 people.

This next iteration would expand the area to contain 12,000 people, exceeding the specified threshold value and rendering it less precise than the previous iteration. In this scenario, the algorithm sets the created threshold area back to its previous iteration, the area that contains 9,500 people. This represents the greatest possible precision for the calculation, 95%, which is lower than the precision value you set. The population density of urban areas means that even small increment sizes may yield results with less precision than desired.
It is important to understand that threshold calculations are always necessarily an approximation—when the algorithm runs using real-world conditions, the output differs based on these conditions. The above description is one of many examples when population density, actual placement of census block points, and traffic patterns affect the output.


Article Discussion: