The latest release of ArcGIS Business Analyst Web and ArcGIS Business Analyst Mobile App is here and we are extremely excited to share the new features users have recommended! ArcGIS Business Analyst Web and ArcGIS Business Analyst Mobile App allow users to use data, mapping, and analysis tools to gain market intelligence and stay ahead of competition.
Here are the new features in the December 2021 release of ArcGIS Business Analyst Web and ArcGIS Business Analyst Mobile App:
- Get access to the U.S. Census 2020 redistricting data
- New infographic templates for the 2021 Canadian demographic data
- Use criteria to define an area with threshold areas workflow (Advanced license)
- Improved workflow for creating ArcGIS StoryMaps (Advanced license)
- Ability to share more sites to ArcGIS Dashboards (Advanced license)
- Updated business points and traffic data for the U.S. and business points for Canada
Sign up for a 21-day free trial of ArcGIS Business Analyst Web App to gain access to these new features, get a better understanding of your customers, and optimize your business.
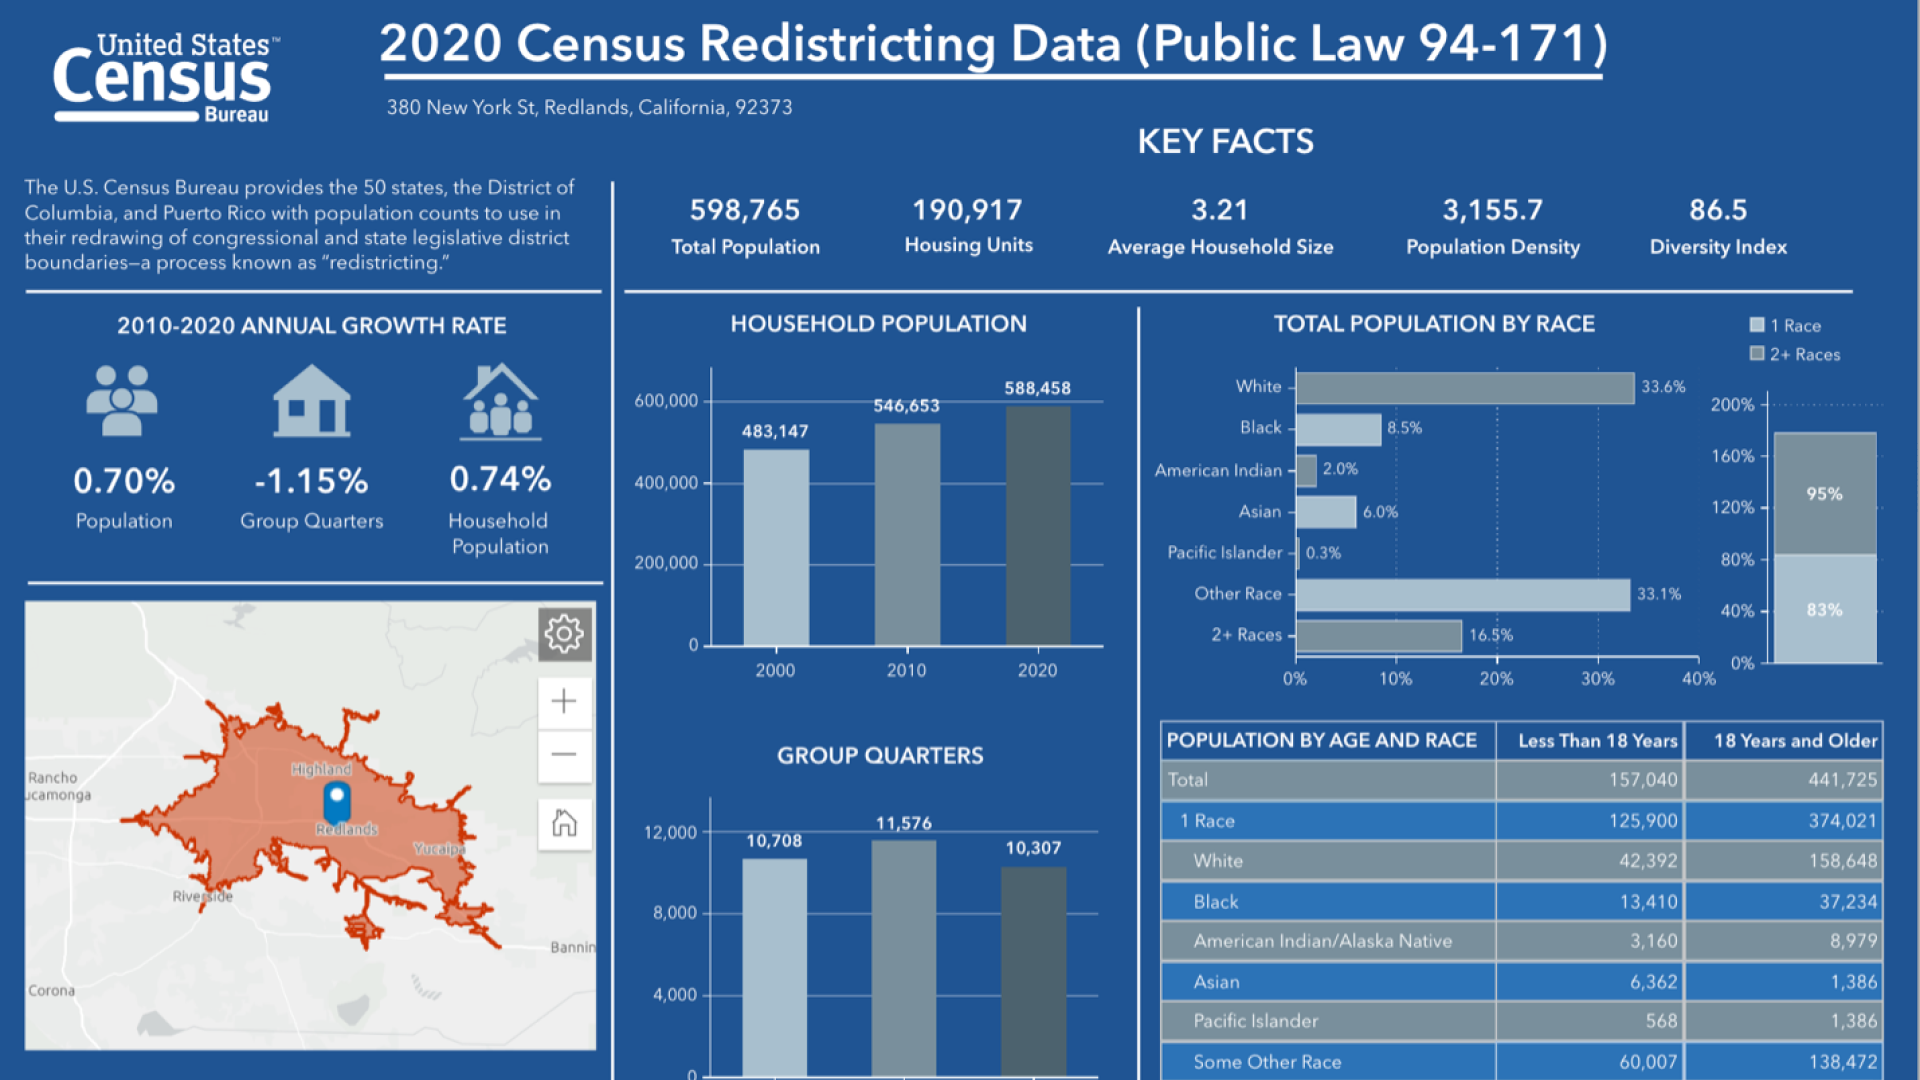
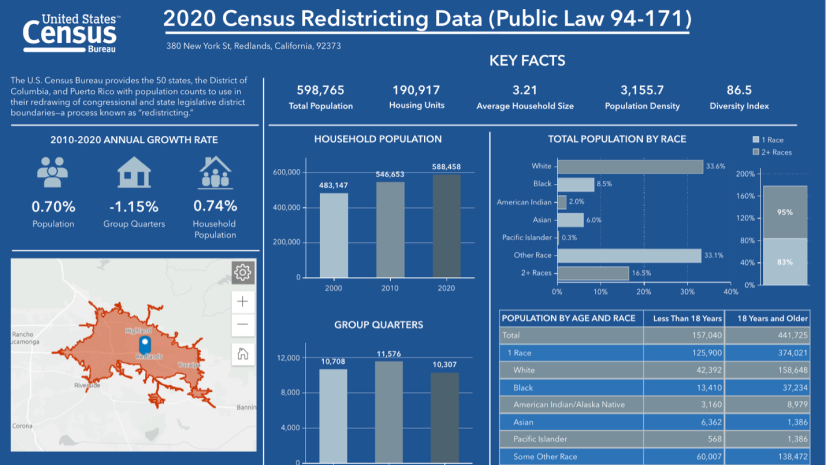
Get access to the U.S. Census 2020 redistricting data
The U.S. Census Bureau’s redistricting data includes updated population variables. This means that ArcGIS Business Analyst users now have access to the most up-to-date site selection and market analysis results. Redistricting data helps you gain a better understanding of different variables and how resources will be distributed over the next ten years. With this new release, you will also gain an additional dataset created by the Esri demographics team. You can easily share and convey the information in a simplified way through the use of infographics, color-coded maps, and multiple analytical tools.
To learn more about why redistricting data matters and how to access this data, read Census 2020 redistricting data coming to ArcGIS Business Analyst.
New infographic templates for the 2021 Canadian Demographic data
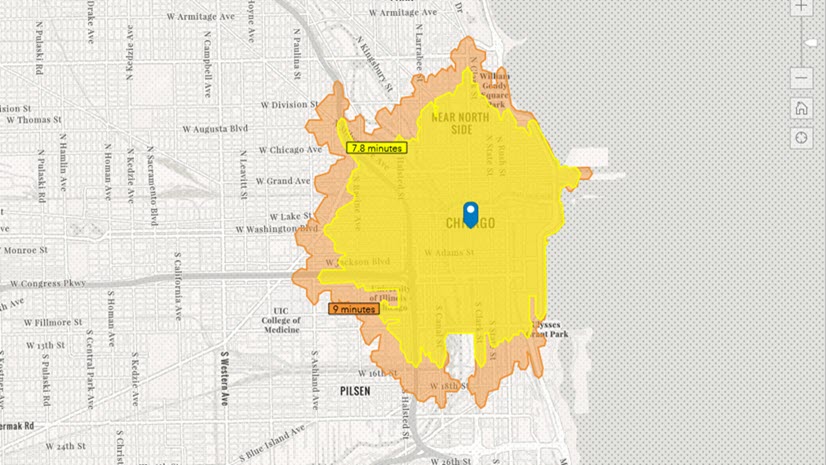
Infographics are a great way to convey key indicators and information quickly and clearly. With this release, we have added new infographic templates and updated the data to the 2021 Canadian Demographic data. The process is simple: first enter an address or a location in the top right corner location search bar. Click the pinned location on the map and add a drive time, walk time, or a simple buffer point. Once the parameters are set, click on Infographics and you will now see the new infographic templates listed below:
- Demographic Profile
- Demographics and Spending
- Economic Development
- Nearby Restaurants
- Population and Household Trends
- Population and Key Indicators
- Poverty Indicators
- PRIZM Key Facts
- Target Market Summary
- Visible Minority
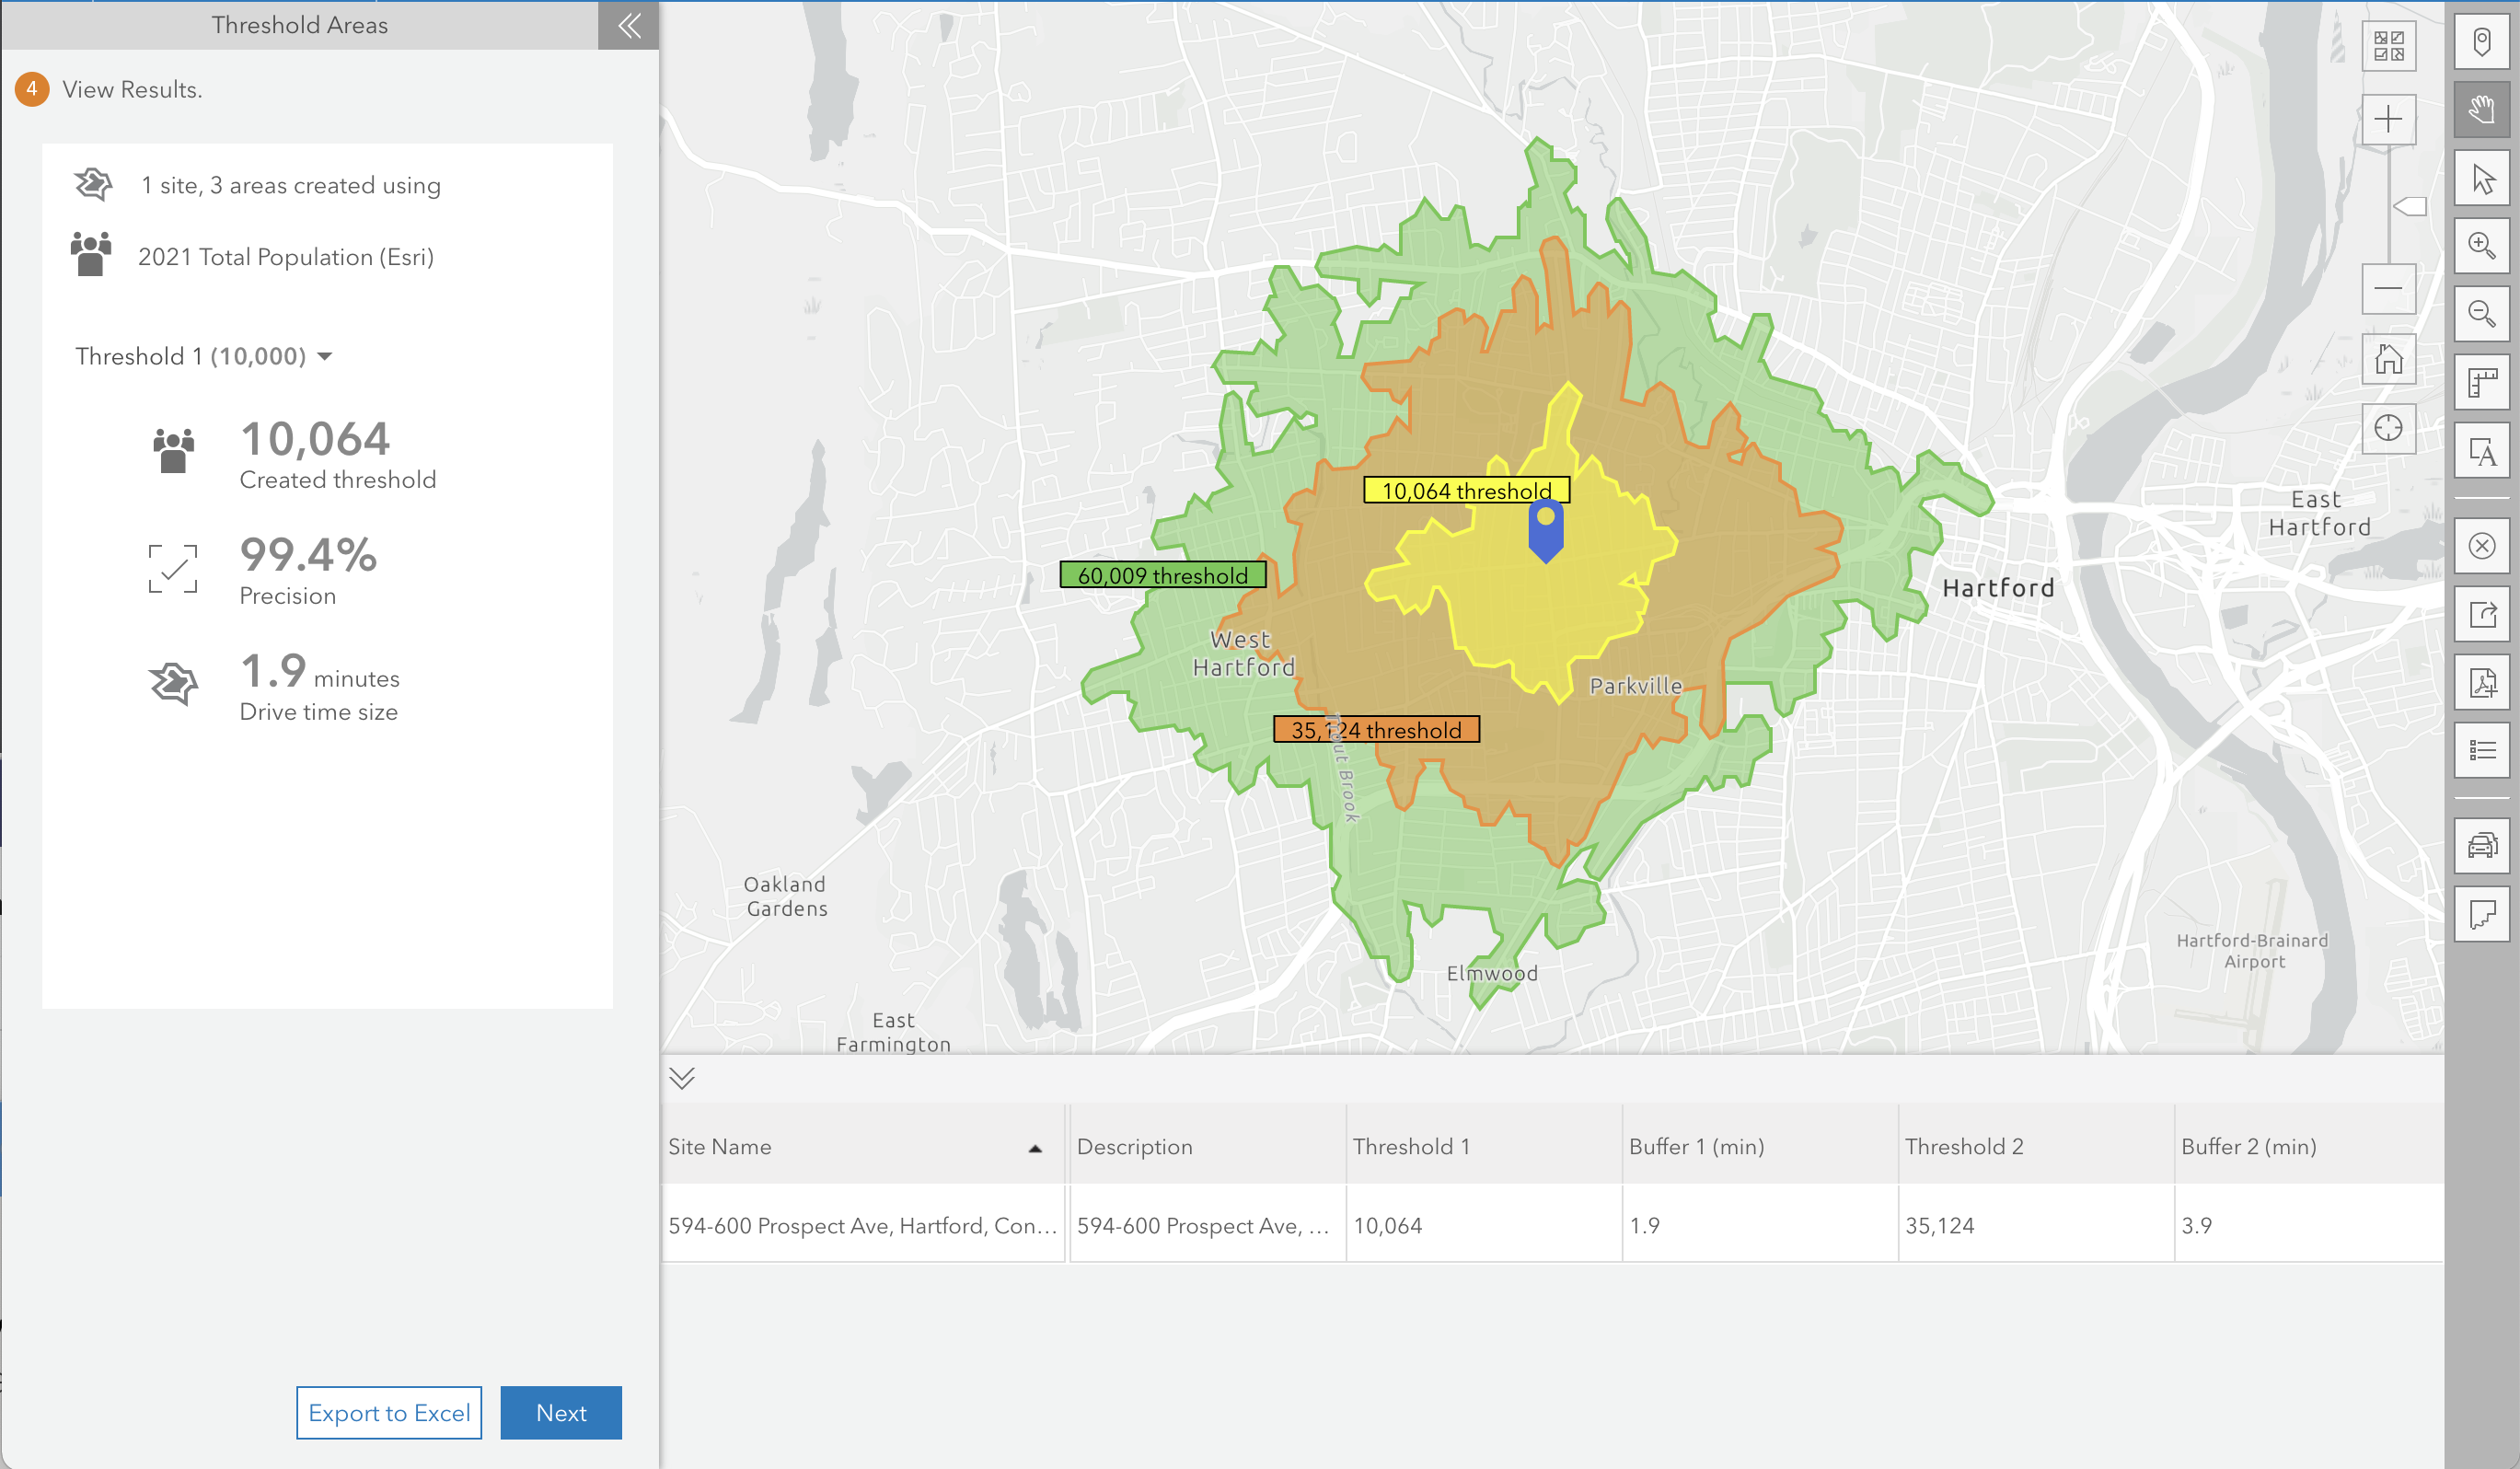
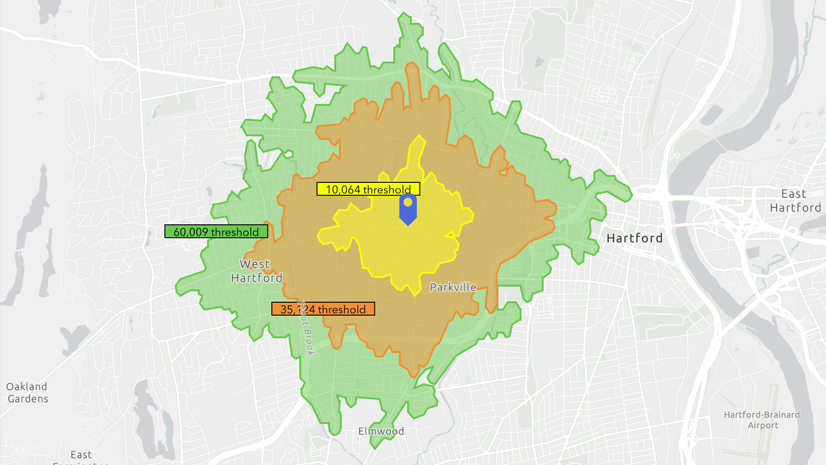
Use criteria to define an area with Threshold Areas workflow (Advanced License)
Business Analyst users frequently define areas by choosing a location and analyzing the demographics around it. With the new Threshold Areas workflow, you can now define your location based on specific criteria. ArcGIS Business Analyst Web App Advanced license users now have access to the new Threshold Areas workflow, which allows users to choose a location, select a variable, and create an area around the location until the criteria is met. Once complete, you can then take the average drive time or ring boundary to calculate possibility of a new market area.
Maybe you are looking for a store or community center that needs a population of 20,000 people that have the minimum income range. You can run the Threshold Areas workflow to calculate the average drive time that captures your market. You can then take this drive time in a new area you are considering, to determine how many of the same demographics are captured in this new market.
If you would like to learn more, read our Capture Your Market with Threshold Areas in Business Analyst blog.
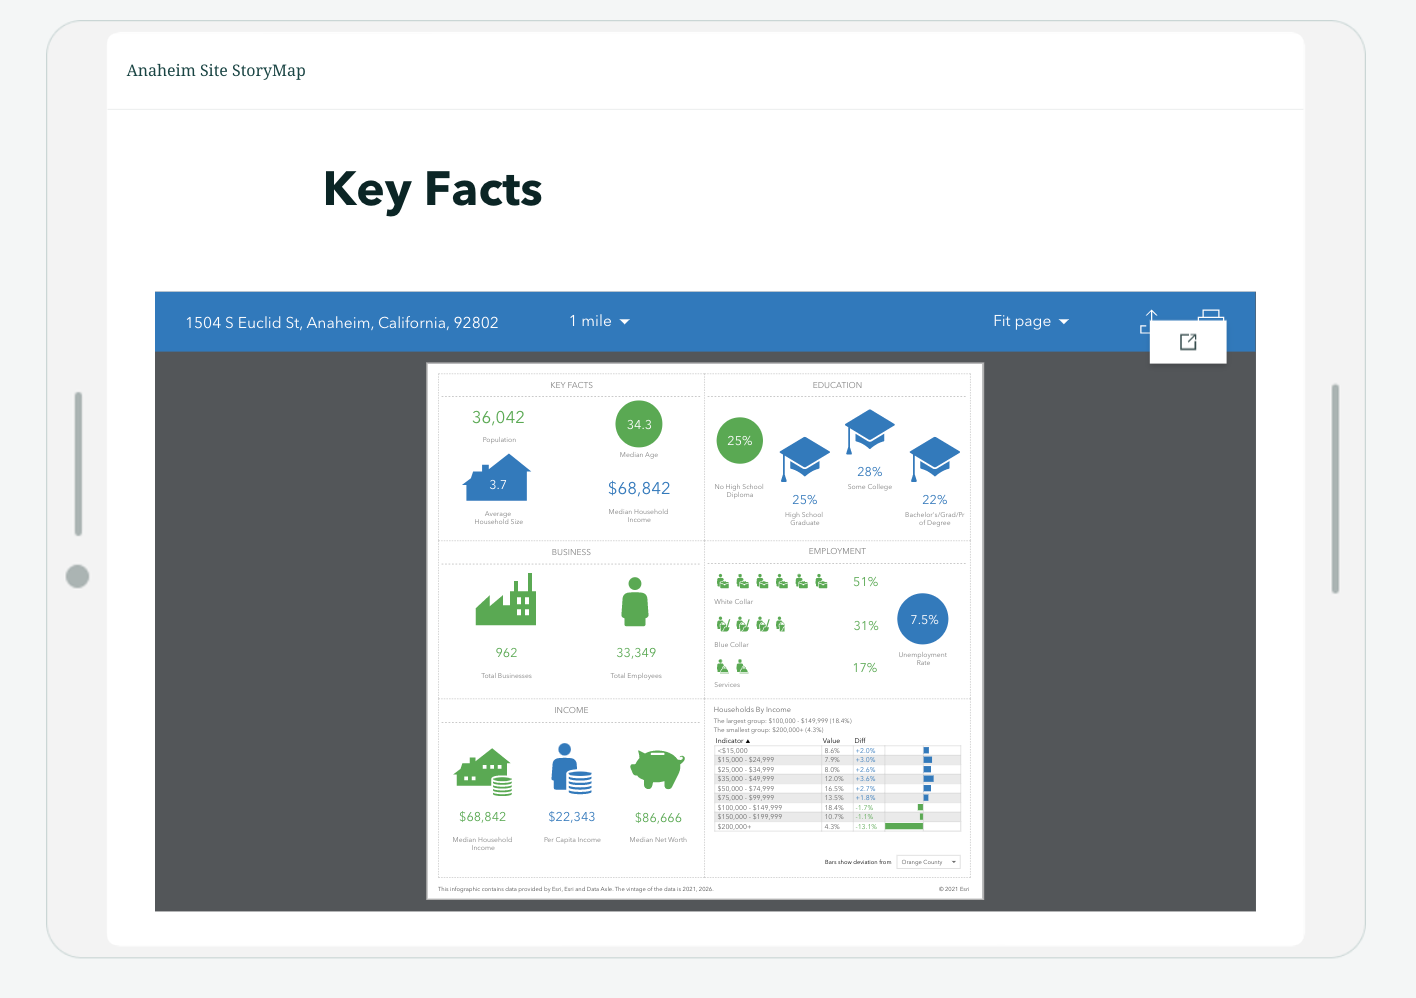
Improved workflow for creating ArcGIS StoryMaps (Advanced license)
In 2019, Esri released the latest generation of its storytelling tool, ArcGIS StoryMaps. This exciting tool includes all the popular storytelling patterns and features, new enhancements every month, and an array of new capabilities. In this release of ArcGIS Business Analyst, users creating new stories with sites and infographics will now default to the modern ArcGIS StoryMaps template. The latest ArcGIS StoryMaps includes new design templates, autosave and more. See why you should use the new ArcGIS StoryMaps.
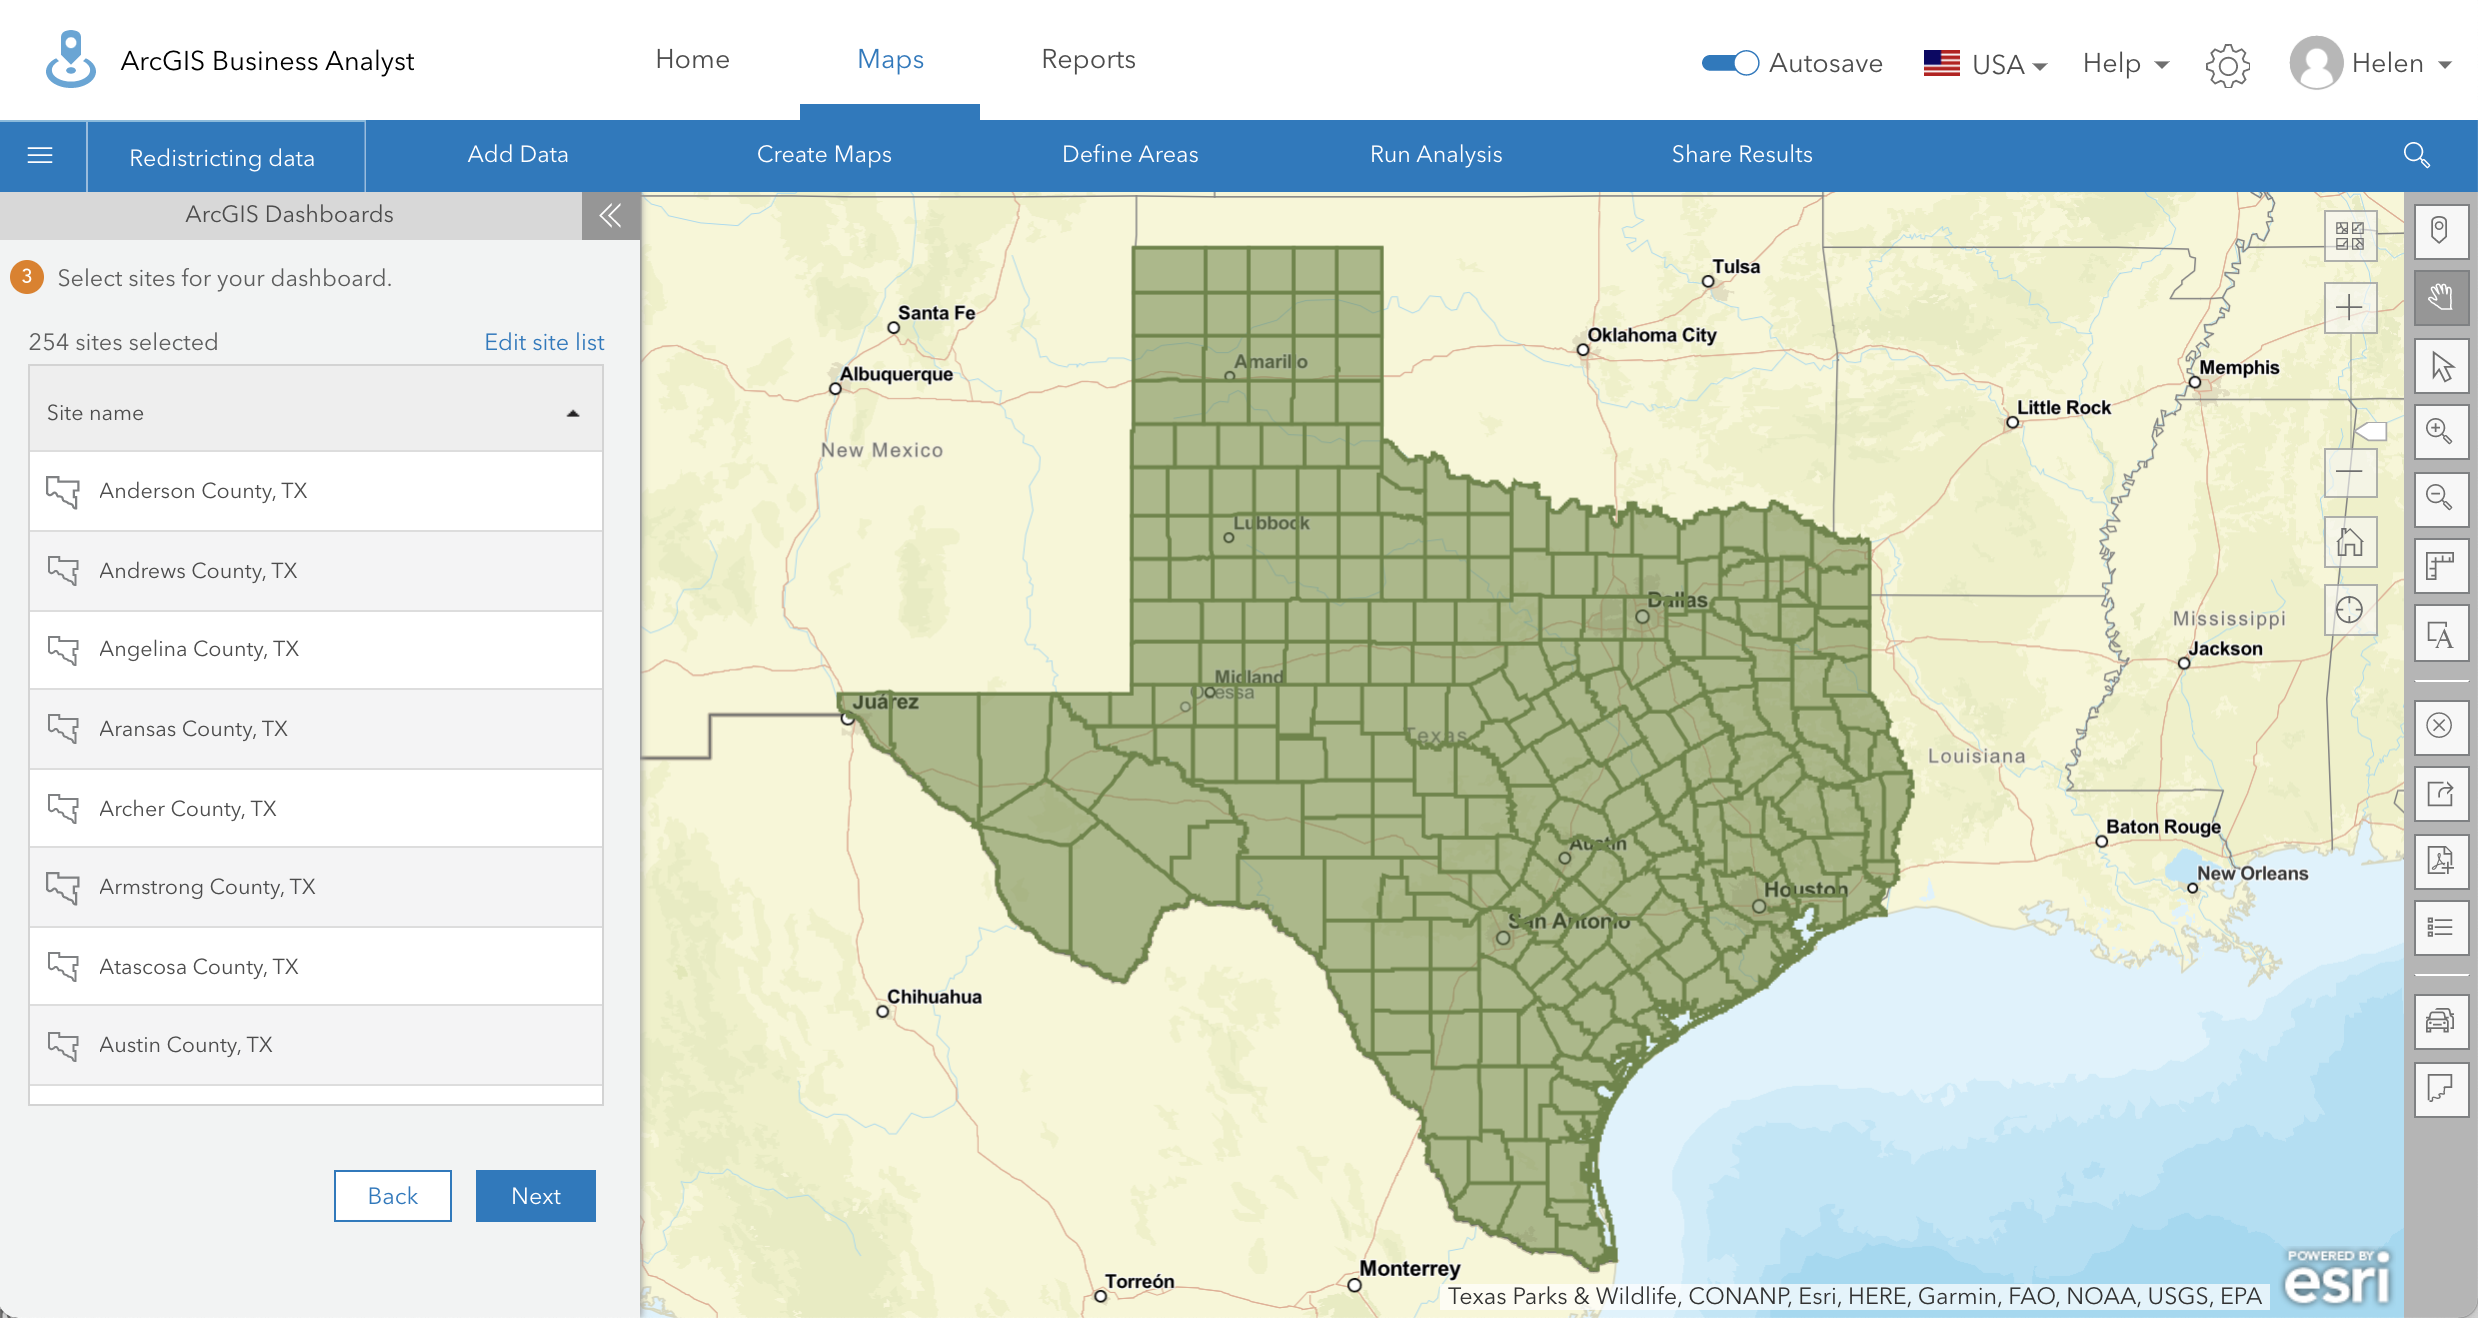
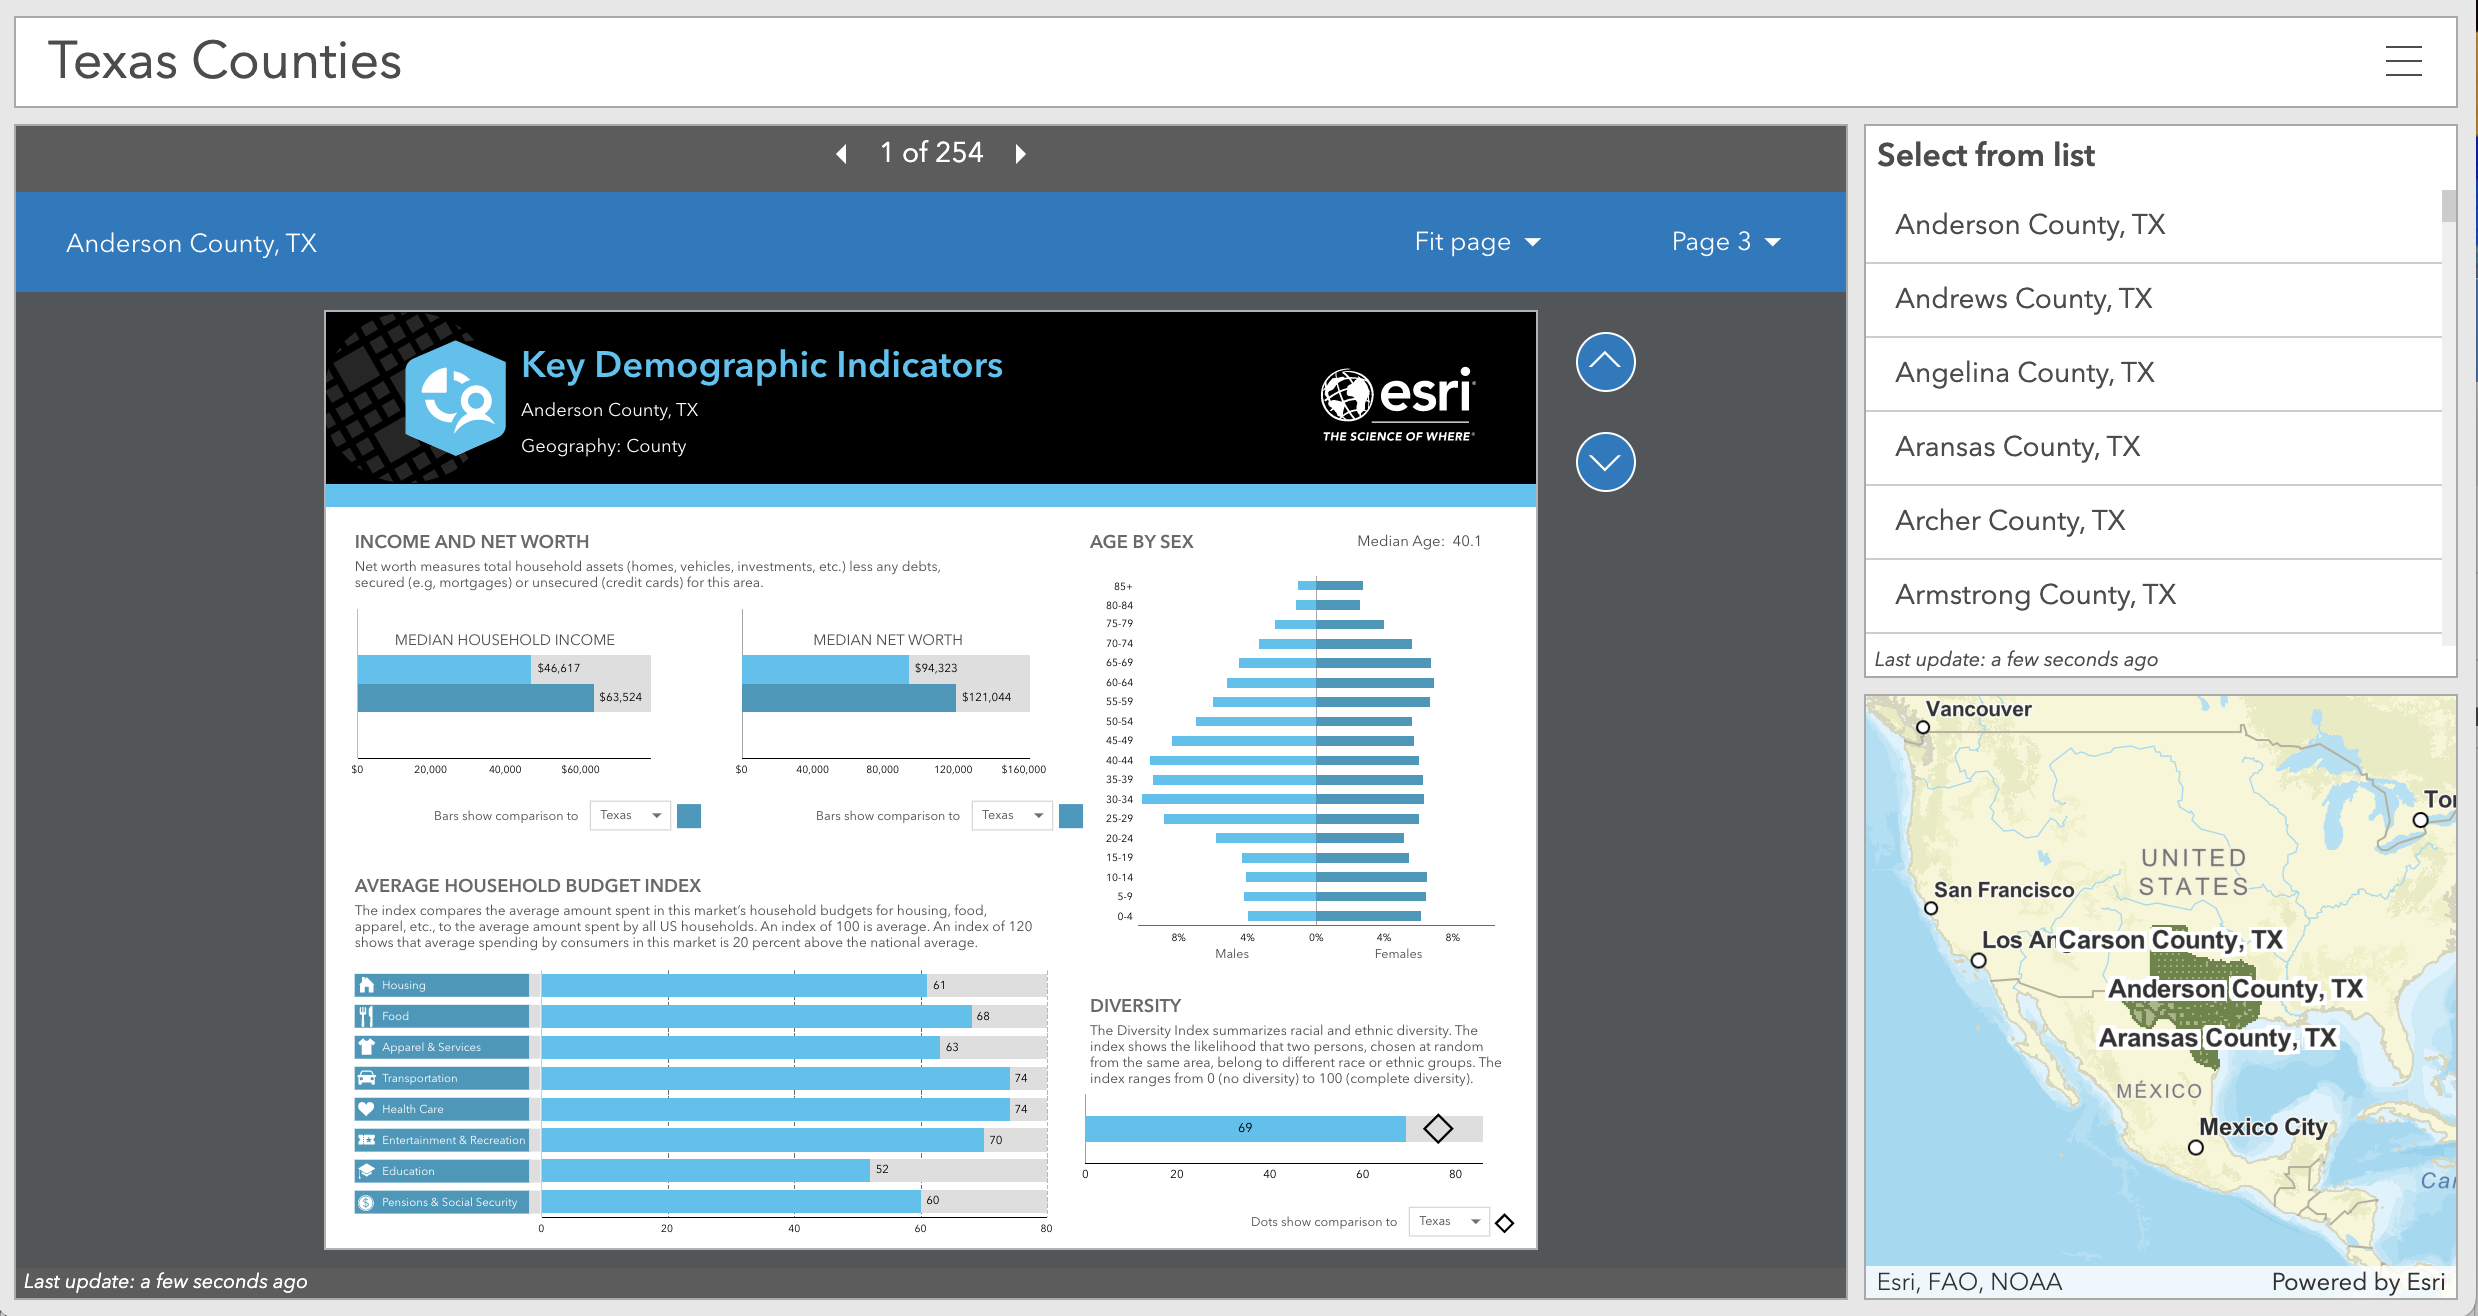
Ability to share more sites to ArcGIS Dashboards (Advanced license)
In September of this year, we created an easy three-click workflow where users can share sites, maps, and infographics via ArcGIS Dashboards. Previously, you were only able to select up to 100 sites. We listened to your feedback, and you can now select up to 500 sites. In the U.S., this enhancement allows you to create complete county-based dashboards for any state.
Updated business points and traffic data for the U.S. and business points for Canada
The December 2021 release of ArcGIS Business Analyst Web and ArcGIS Business Analyst Mobile App includes the following key data updates:
- Business points (Data Axle and SafeGraph) for the U.S.
- Traffic data (Kalibrate) for the U.S.
- Business points (Data Axle) for Canada
Additional Resources
We hope you enjoy the new enhancements in the December 2021 release of ArcGIS Business Analyst Web and Mobile Apps! Please visit the follow links for more information regarding ArcGIS Business Analyst:
- Join our LinkedIn Business Analyst User Group
- Join our Business Analyst Esri Community
- Read more Business Analyst blog articles on ArcGIS Blog
- Watch Business Analyst videos on YouTube
- Visit the Business Analyst Resources page


Article Discussion: