The next release of ArcGIS Community Analyst is planned for prior to early July Esri’s Users Conference. Here are the key highlights of what’s planned:
Access Updated 2019/2024 U.S. Demographics Online Data
- 2019/2024 estimates and projections for U.S. demographics
- 2013-2017 American Community Survey (ACS) Demographics
- 2019 Tapestry segmentation, daytime population, market potential, business locations, traffic counts, and crime indexes
- Consumer Spending data will now include 2024 projections in addition to the latest 2019 estimates
- New variables on Life-stage and Dependency that represent ratios of children and seniors to working population. These ratios help describe the pressure an economy faces in supporting non-working population

- New variables on socioeconomic indicators to help explore the relationship between home value, income, wealth, and home ownership:
- Wealth Index: Measure of the assets of worth owned by a household
- Housing Affordability Index: Ability of a typical resident to purchase an existing home in an area
- Percentage of Income for Mortgage: Part of median household income dedicated to monthly payments on a home priced at the median value
- Michael-Bauer Research data updates for 15+ countries including Puerto Rico, Dominican Republic, Jamaica, Guatemala
Use Historical Data
Access Historical data for the U.S. Population, Households, and Housing Units. Easily create infographics, charts or maps to understand demographic trends in an area. For example, find out if the population is growing or declining around an existing store or in a community. You will be able to use data for previous years back to the last decennial census. For example, with the 2019 update you can use data for 2019, 2018, 2017, and so on – going back to the last decennial census in 2010.

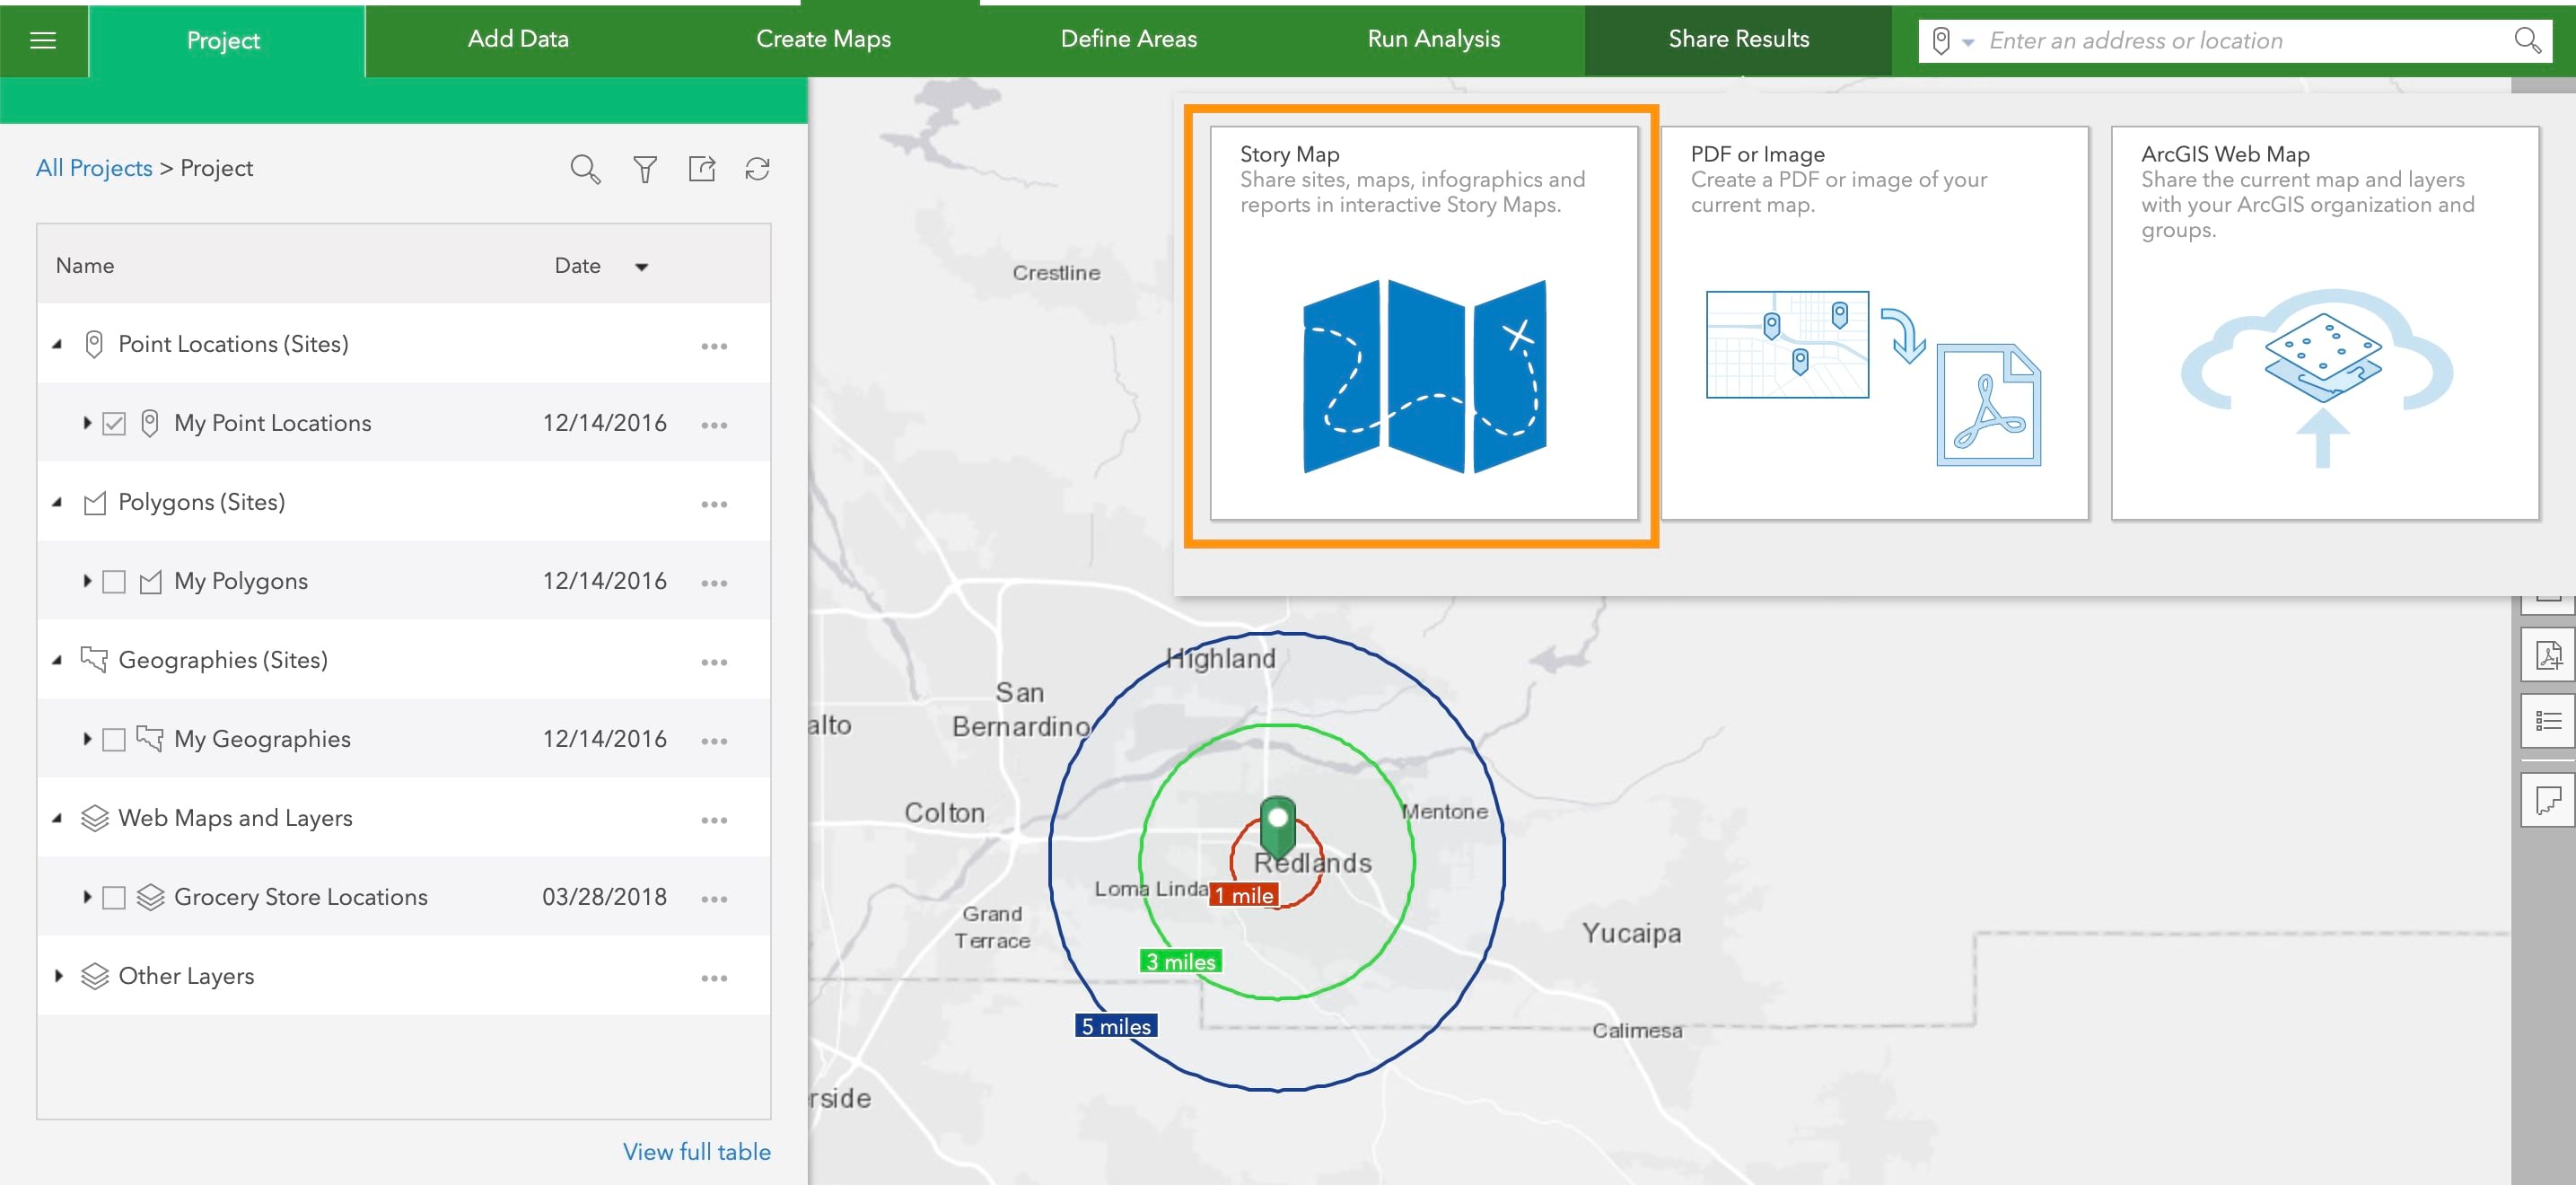
Easily Add Community Analyst Content to StoryMaps
Use a new workflow to add sites, maps, infographics, and reports in interactive StoryMaps in just a few clicks. Select one of the four starter StoryMap templates, choose sites, configure items for the sites such as attributes and notes, infographics, and reports, and add all the selected content in StoryMaps. Customize further using the StoryMaps building experience.
Import and Map Geographic Boundaries
Let’s say you have a spreadsheet of Zip Codes or other standard geographies (e.g. counties, states) that you need to map showing the Zip Code boundaries. With the enhancement to the Import File workflow, you will be able to do this.
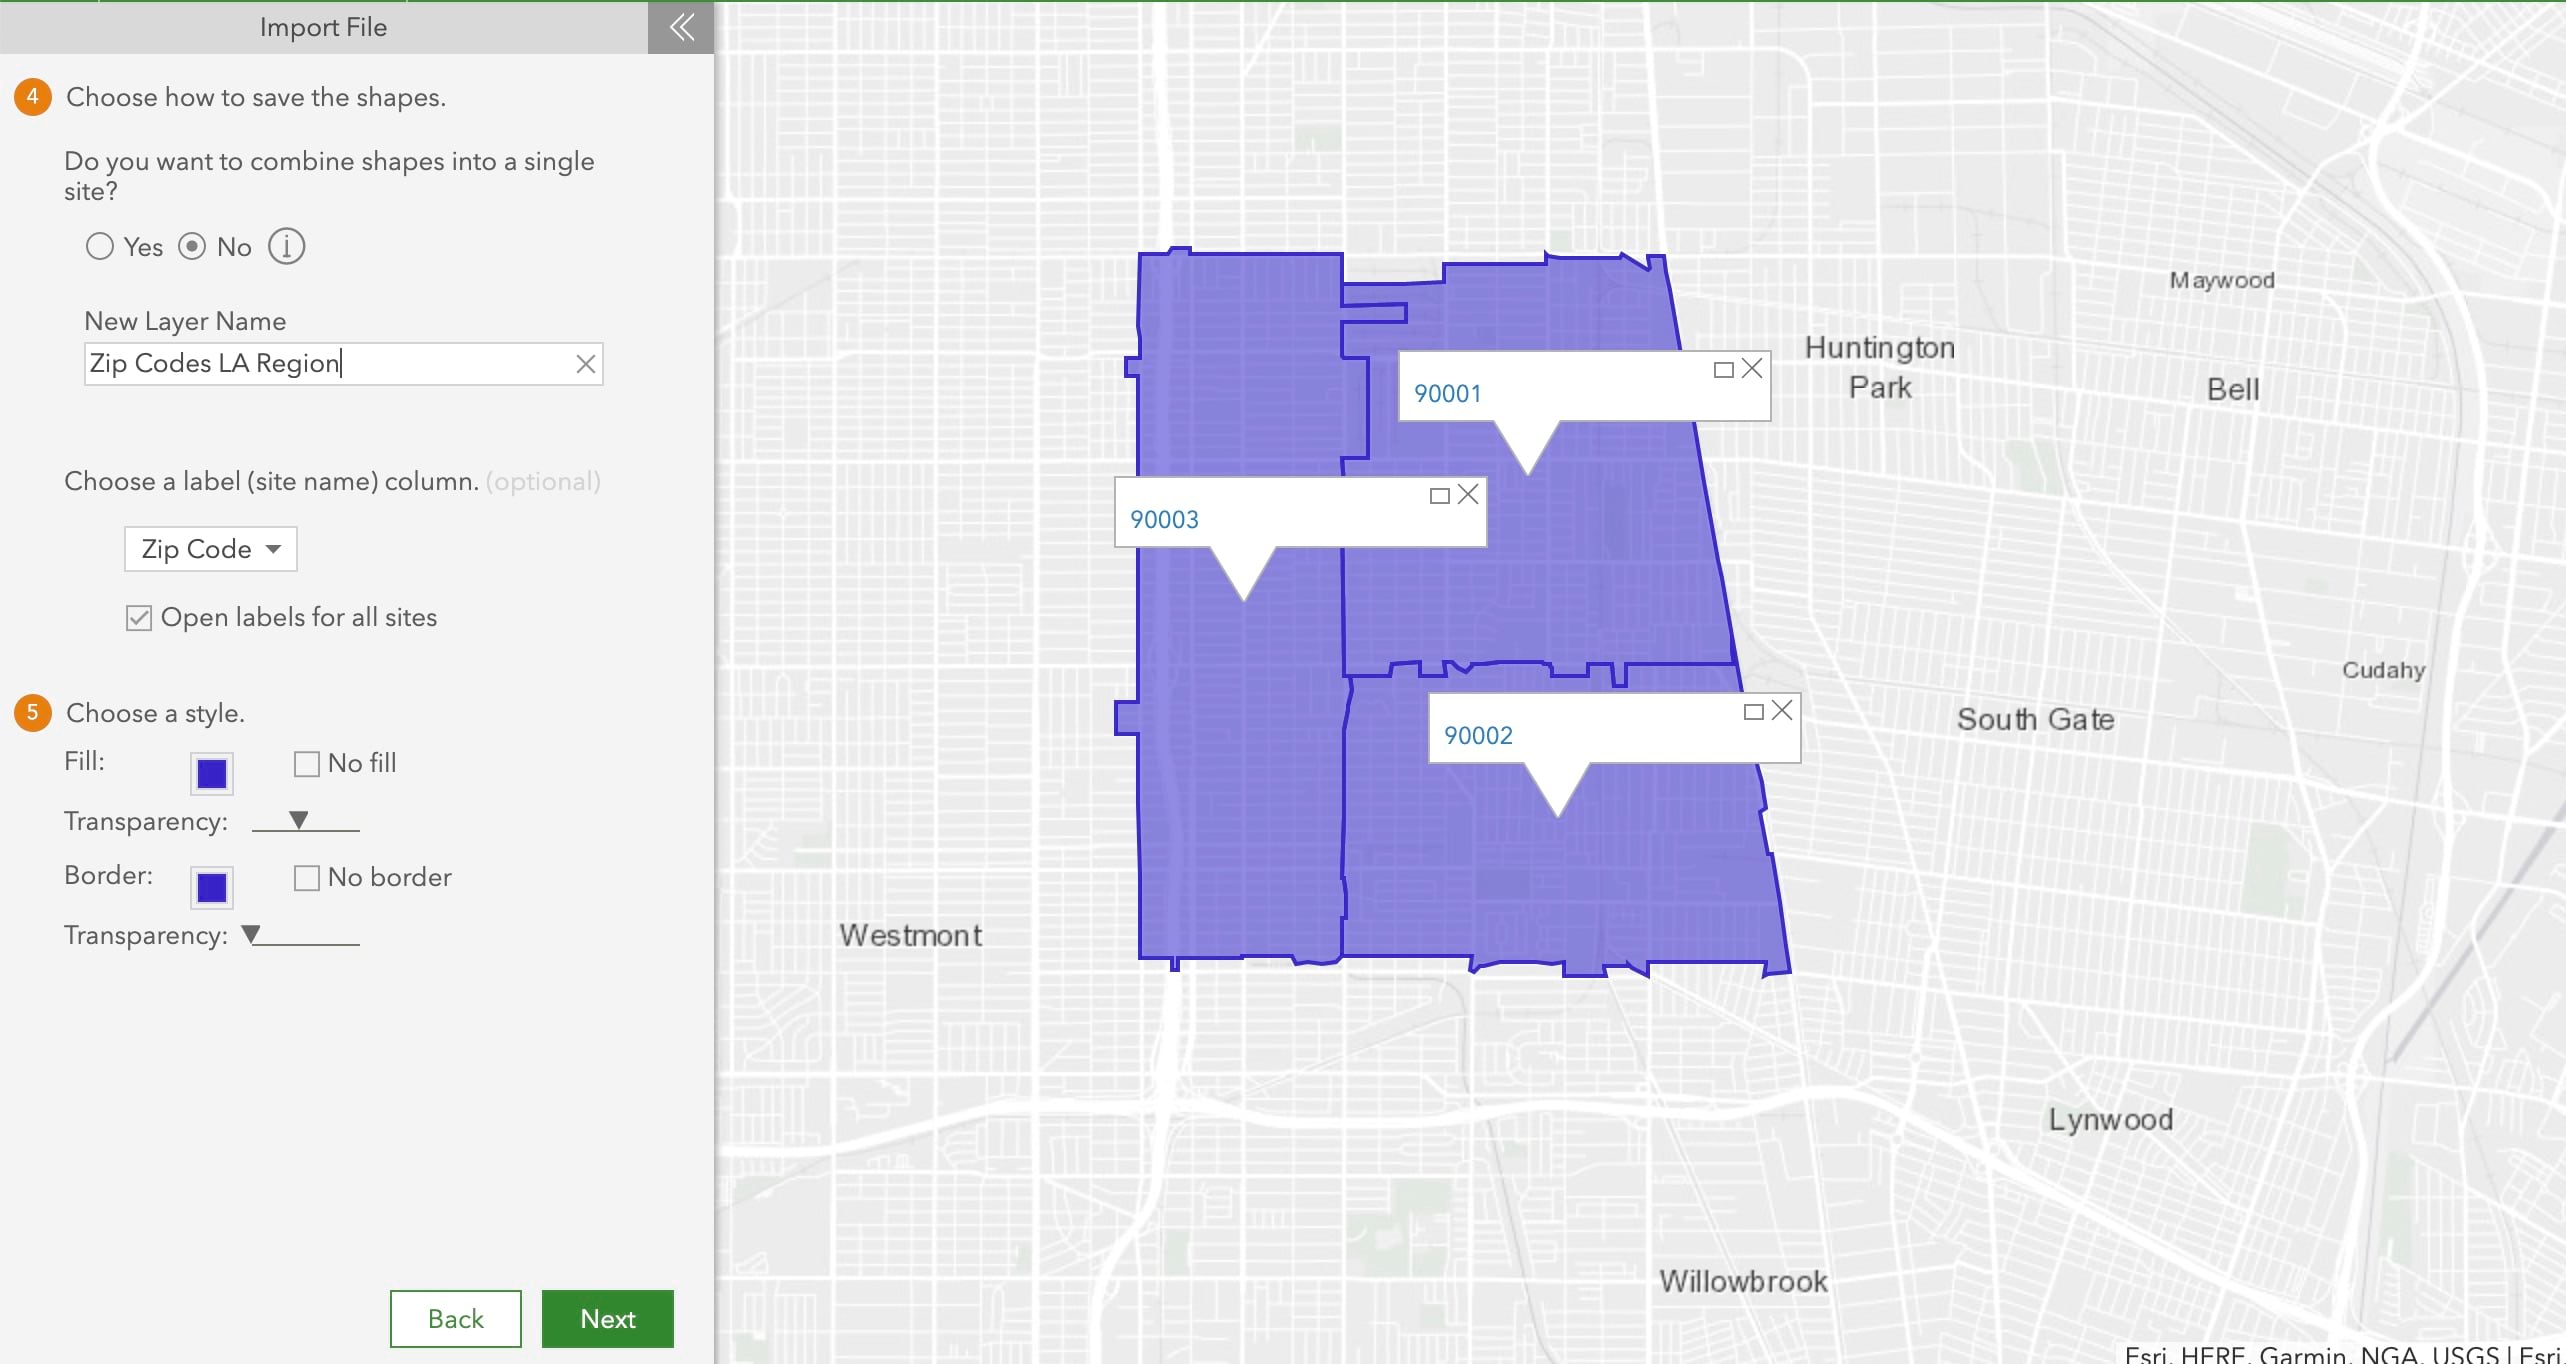
Simply select the Geographic Boundaries option when importing a spreadsheet, choose which column has the geographic boundary information, and generate the map with geographic boundaries. You can save the geocoded result as a polygon layer or convert those to sites.
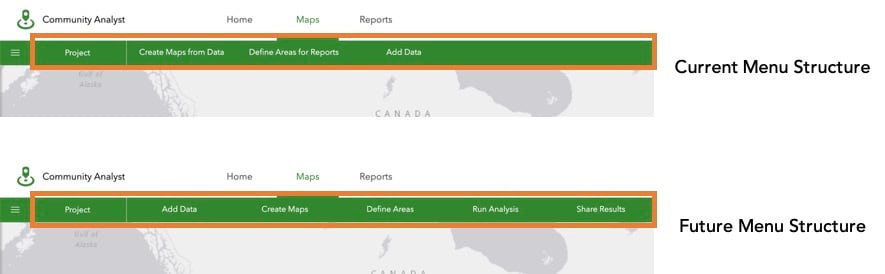
Improved Menu Structure
You will notice a new menu structure and renaming, along with two brand-new menus: Add Data, Create Maps, Define Areas, Run Analysis, Share Results. Common workflows are organized so you can navigate to them quicker. The new structure aligns the menu items in the order they are used in your work and organizes common workflows so you can navigate to them quicker. For example, you can add your own data for the project, create maps using your or Esri Demographic data, define analysis areas, run analysis, and share results with others.
Stay tuned for a comprehensive list of released updates in a post-release what’s new blog.
Please note that all planned updates are subject to change without notice.

Commenting is not enabled for this article.