Last updated: Oct 16, 2025
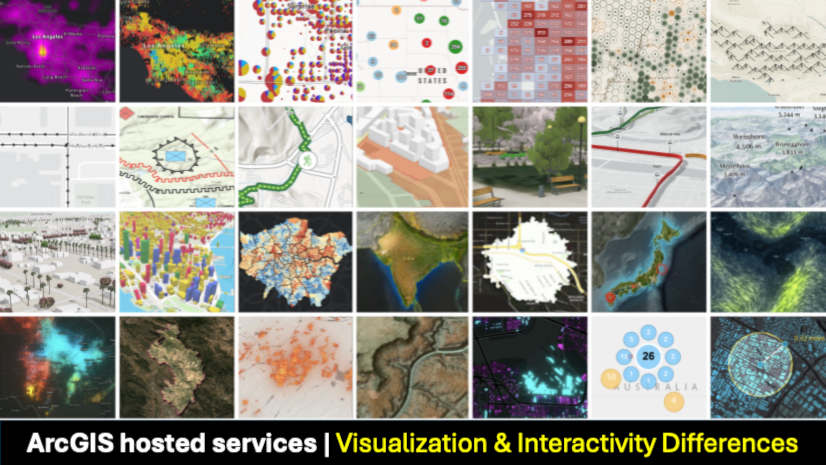
After learning how hosted data services work behind the scenes and the SDK trade-offs, this article compares the visual customization and data interaction capabilities of each service and how they are supported across SDKs.
Note: We will see that most of these capabilities are highly dependent on the client SDK used.
Although this is a technical article, it’s intended for anyone involved in designing the final experience of an application, including client-side developers (web and native), UX/UI designers, technical leads, solution architects, technical product managers, and performance specialists.
We will cover:
- What each service is optimized for
- High resolution support
- Basic client-side interaction
- Advanced client-side interaction
- Basic client-side style customization
- Advanced client-side style customization
- Client-side performance
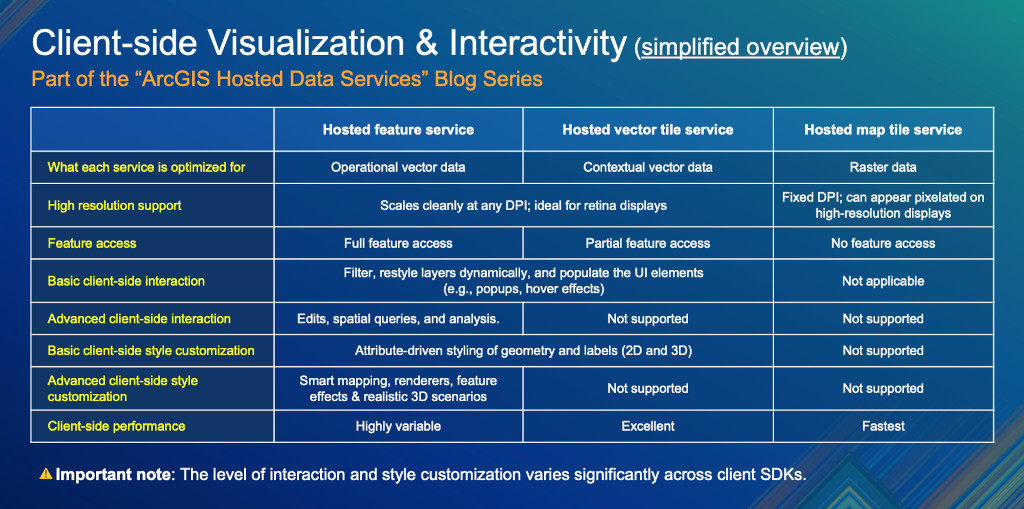
[TL;DR] Short on time? Check this table for the key highlights or jump to the summary:
By the end, you’ll understand which services best fit your needs and how to combine them.
Note: Apps that rely on geospatial data rarely use a single service; instead, they typically utilize a combination of services. That’s why it’s important to select the right one for each type of data and specific functional requirement to optimize performance and deliver a great user experience.
Notes on accuracy: Surviving the test of time …
As introduced in the first article of this series, this series is a unified resource to save you time and clarify differences between similar technologies, based on information from official sources.
Technology evolves rapidly, so some details may become outdated. Each article includes references to official documentation, which contains the most up-to-date information. In case of discrepancies, the official documentation takes precedence.
If you find something unclear or notice an error, contact us at developers@esri.com
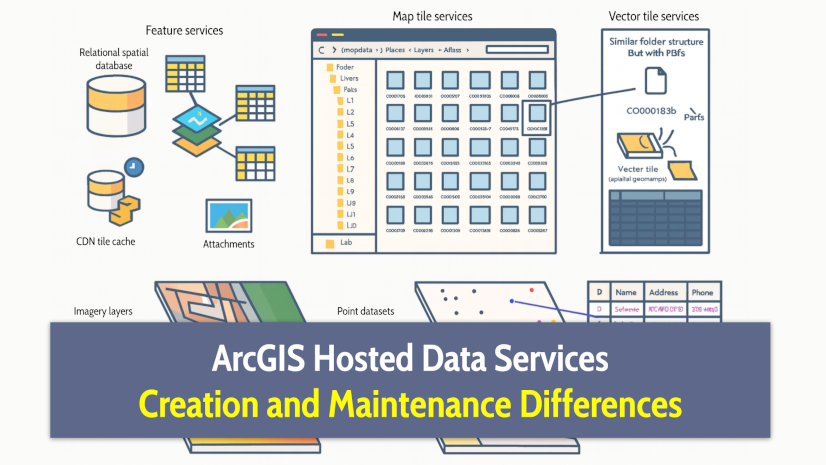
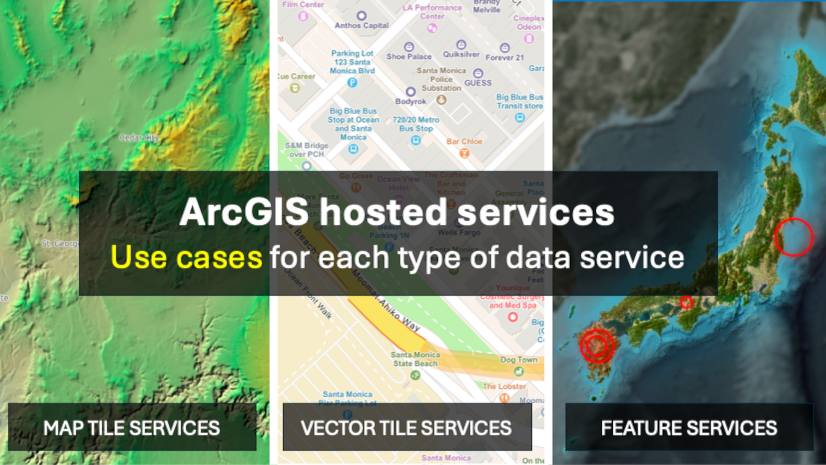
What each service is optimized for
As a reminder from the article on use cases for each ArcGIS hosted service, each service type is designed and optimized for different purposes:
- Hosted map tile services for static raster content (e.g., including basemaps, drone imagery, scanned maps, etc). They provide fast, pre-rendered tiles but are non-interactive.
- Hosted vector tile services are designed for vector data that is relatively stable (i.e., doesn’t change often). They support lighter interactivity, styling, labeling, and zoom-level optimizations, but don’t support advanced queries or editing.
- Hosted feature services for operational, interactive data. They let you query, filter, edit, run spatial analysis, and dynamically style data. They are backed by a database or spatial data store, not just pre-rendered tiles, so they support much richer user interaction.
Reminder: Tile and vector tile services can also be useful when you want to protect sensitive data, since they only expose rendered output, not the underlying features. Map tile services can additionally support clients with limited rendering capabilities.
High resolution support
High-resolution displays (such as Retina) render more pixels in the same physical space, making images and text appear sharper and more detailed.
Each service type behaves differently with respect to DPI (dots per inch) and high-PPI (pixels per inch) support. Here’s how they typically respond:
- Map tile services: By default, pre-rendered raster images are 256×256 pixels and have a standard resolution of 96 DPI. On high-DPI displays, these tiles can appear slightly blurry or pixelated. If that’s your case, remember that you can customize the tiling scheme for higher resolutions, as explained in the previous article.
- Vector tile services and feature services: Deliver vector data that is rendered client-side (drawn dynamically), so it automatically scales cleanly at any DPI. It’s ideal for retina displays, as they remain crisp without requiring extra bandwidth or storage costs (but they consume more CPU).
Basic client-side interaction
Client SDKs enable you to manage layers (show, hide, or disable them), but let’s focus on the interactions that can be applied to individual features.
- Map tile services do not support feature interaction on the client side. When published from a feature service, you can fake it by making server requests to the feature service, as shown in this example.
- Vector tile service: You can filter and restyle layers dynamically on the client, and access attribute data embedded in the tiles to populate the UI (for example, popups or hover effects), as shown here and here. If the vector tile service originates from a feature service, you can still run server-side queries and retrieve the original geometries, though with lower performance on the client.
- Feature services: Like vector tile services, but with some advantages. In addition to simplified geometries, feature services can request full geometries, optimize attribute retrieval from the server, and save edits directly back to the same service. As we will see below, it also supports richer interaction and far more advanced data-driven styling than vector tiles, which is very useful in use cases such as data exploration.
Note: SDKs can’t easily access full feature geometries from vector tiles. Some SDKs can utilize unique feature IDs to reconstruct simplified geometries to expose basic attributes for pop-ups or hover effects, but others, such as the ArcGIS Maps SDKs for Native Apps, treat vector tiles purely as visual layers.
Advanced client-side interaction
Tile-based services are great for performance and visualization, but sometimes we need to go a step further. When your app involves live data exploration, on-the-fly analysis, or collaborative editing, feature services give you more control.
As we discussed (see 1 & 2), feature services store data in ArcGIS-managed relational storage, giving client-side, SQL-aware query engines (such as the ArcGIS Maps SDKs) direct access to the underlying data and enabling a level of interactivity that static tile services can’t provide.
Here are some examples of what you can do with feature services:
- Access to up-to-date data (with full geometries and all attributes) on request.
- Run precise statistical, spatial, and non-spatial queries:
- Server-side, reducing the computational load from the client (e.g., average, standard deviations, query bins, and more). Check this example.
- Client-side, using geometry engines with geometry operations as shown in this population density example, performing on-the-fly reprojections (example), and more.
- Client-side filtering, selection, and highlighting of individual features:
- User-driven interactions, such as text-based search, spatial selections, finding related records, or accessing attachments.
- Developer-defined interactions, such as attribute-based animations in the New York construction example.
- Edit live data directly on the client and save changes to the same service, while maintaining data integrity.
Vector tile service limitations
Vector tiles are designed and optimized for efficient visualization of contextual data, which brings several important limitations when it comes to advanced interaction.
Some key aspects to consider are:
- Limited attributes: Include only the attributes needed for visualization; non-visual attributes are usually excluded.
- Performance trade-off: Adding extra attributes to support interactions such as pop-ups or hover effects increases tile size, which can slow down loading and rendering.
- Simplified and segmented geometries:
- Geometries are generalized to reduce the number of vertices, especially at lower zoom levels.
- Not all zoom levels contain every geometry: if a feature hasn’t been “baked” (preprocessed) for a given level of detail, it won’t be available at that scale.
- Topological relationships (e.g., adjacency, connectivity, contiguity) are not preserved, since the focus is on visual accuracy rather than spatial analysis.
In summary, vector tiles are designed for fast, stylized visualization. However, when applications require advanced interaction like the ones we’ve just seen, feature services remain the best choice.
Basic client-side style customization
Client SDKs support layer-level style customization, such as adjusting opacity, and some even support blend modes.
Let’s look at the styles you can apply to individual features.
- Map tile services, being pre-rendered raster tiles, don’t allow client-side styling or feature customization.
- Vector tile services and feature services support attribute-driven styling of geometries (e.g., color, fill, stroke, rotation, opacity) and labels, as well as scale-dependent visibility.
- 2D: You can manually define feature-level styles (code the symbology logic yourself), but some SDKs (such as the ArcGIS Maps SDK for JavaScript) provide renderers, which are dedicated classes (e.g., unique types, class breaks, visual variables, multivariate, relationship, and predominance) that simplify the process.
- 3D: While all service types can be visualized in 3D, feature services and vector tile services offer greater control and customization options, such as assigning elevation (z-values) to features, icons, and text, and performing attribute-driven extrusion, as demonstrated in the extrusion examples for feature services and vector tile services.
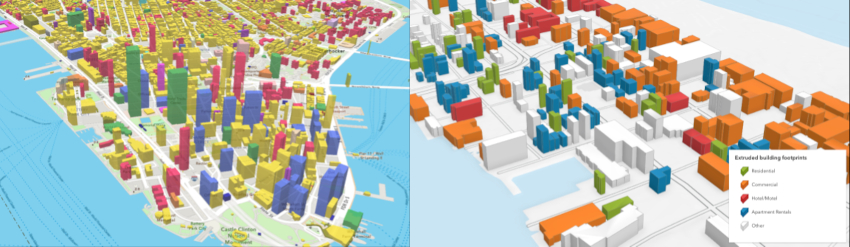
Note: Keep in mind that not all SDKs support extrusion for all service types.
Learn more about what basic style customization means
Access to vector data enables styling, but supported customizations differ widely across services and SDKs.
Depending on the implementation, you might be able to adjust elements like these (not an exhaustive list):
- Geometry symbolization:
- Points: Icon image, icon size, icon color, icon rotation, icon opacity, icon offset (x/y), and icon anchor point.
- Polygons fill: Fill color, fill opacity, outline (stroke) color, outline width, outline opacity, and fill pattern (sprite-based fills such as hatches and landscape textures).
- Lines/Polylines: Line color, line width, line offset, and line opacity, line dash patterns, line joins (miter, bevel, round), and line caps (butt, round, square).
- Label/text styling: fonts, font size, font color, font opacity, text halo color, text halo width, text halo blur, letter spacing, line height, text transform (uppercase, lowercase, none), text justification, text rotation alignment, text anchor, text offset (x/y).
- Scale-dependent visibility: Min zoom / max zoom per layer, scale-dependent size adjustments (e.g., text size, line width, icon size).
Advanced client-side style customization
While basic symbology may cover many use cases, projects that aim for immersive experiences, high-quality cartography, or complex data-driven visualizations benefit from the advanced, client-side styling capabilities suitable for feature services.
Advanced style capabilities:
- Feature-specific styles
- Photoshop-like effects
- Advanced rule-based 2D symbology
- Semi-realistic 3D scenarios
- Advanced renderers
- Smart mapping
Note: Not every SDK supports every advanced visualization feature. We’ll focus on Esri’s Maps SDKs, which provide the deepest integration with feature services. Still, even across Esri’s SDK family, feature support varies.
Note: Although it might be possible to emulate some of these capabilities using other SDKs, the additional effort required to replicate them should not be underestimated.
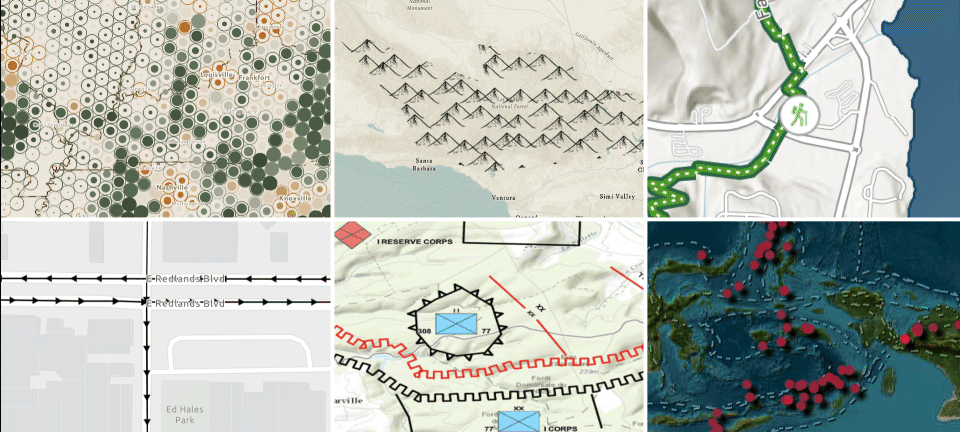
Feature-specific styles
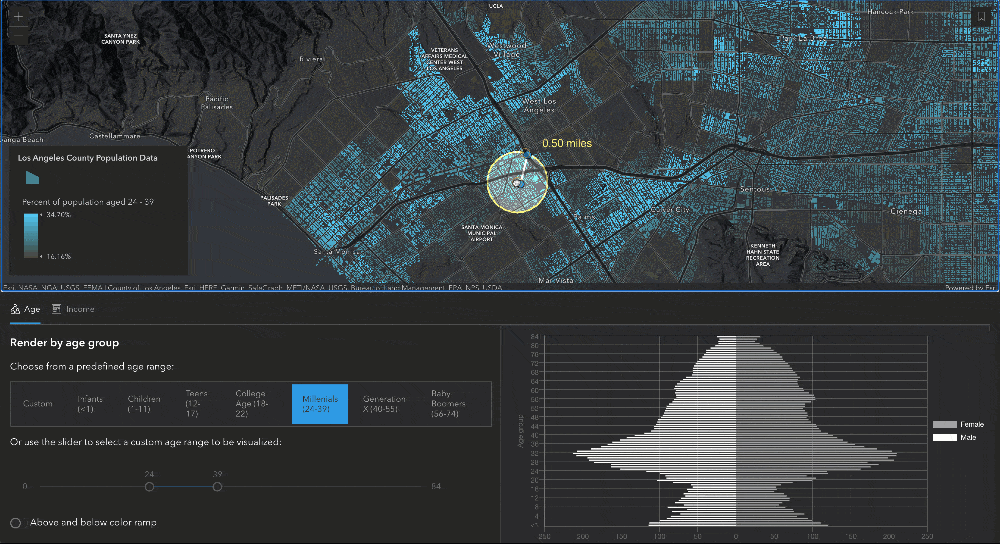
As you have seen, you can search, select, and dynamically apply styles directly to individual features, as shown in the Phoenix Average Age distribution.
Photoshop-like effects
With the ArcGIS Maps SDK for JavaScript, you can apply visual effects to a whole layer (any service type) or individual features (feature services only). They behave much like CSS filters or the image filters you’d find in photo-editing apps.
Learn more about Photoshop-like effects …
Highly recommended resources:
Advanced rule-based 2D symbology
If you need professional-grade symbology, feature services are compatible with Esri’s Cartographic Information Model (CIM), which lets you apply rules to control feature styling (e.g., color, size, rotation).
Note: Don’t confuse this with procedural rules (.rpk), ArcGIS Pro attribute-driven symbology, or conditional style systems used in other mapping tools.
CIM symbols are customizable, multilayer vector symbols that enable advanced, data-driven visualizations, such as multivariate symbology, road styles, military symbology, and custom cluster representations. They can be static or animated, extending far beyond the capabilities of standard symbol types.
Learn more about CIM symbology …
Highly recommended resources:
-
- Dynamic Vector Symbology – ArcGIS API for JavaScript (technical session)
- CIM symbols examples (ArcGIS Maps SDK for JavaScript)
- CIM symbol builders (playground)
- CIMSymbol API reference (ArcGIS Maps SDK for JavaScript)
Semi-realistic 3D scenarios
If you’re working in 3D, you can create semi-realistic 3D scenes by rendering lines and polygons as either flat or volumetric shapes (e.g., realistic animated water). Point features can also use 3D models, including custom GLTF assets, Web Style Symbols, and heatmaps.
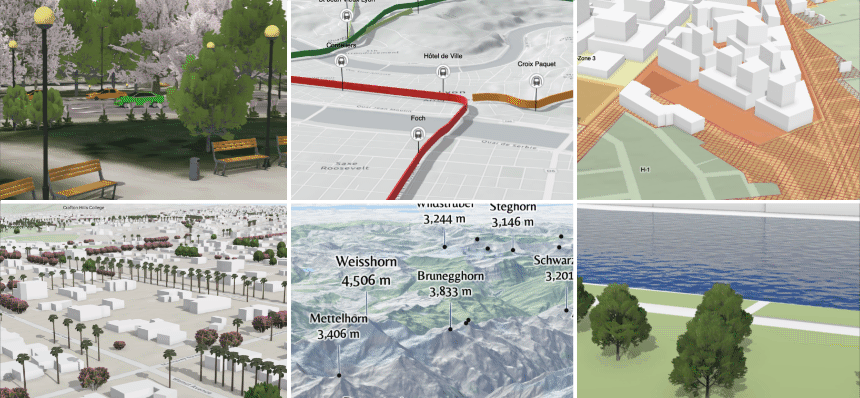
By combining your data with other available 3D layers (such as global 3D basemaps that include trees and buildings), you can create compelling and good-looking visualizations.
Note: For highly realistic scenarios, such as building 3D digital twins of cities, you’ll need to use other service types (more).
Learn more about 3D visualization …
Some recommended resources:
- 3D visualization (ArcGIS Maps SDK for JavaScript)
- Playgrounds: PointSymbol3D, LineSymbol3D, PolygonSymbol3D, and for Picture marker symbol and WebStyleSymbol select “3D”.
- 3D Workflows > 3D visualization
- 3D Technical sessions
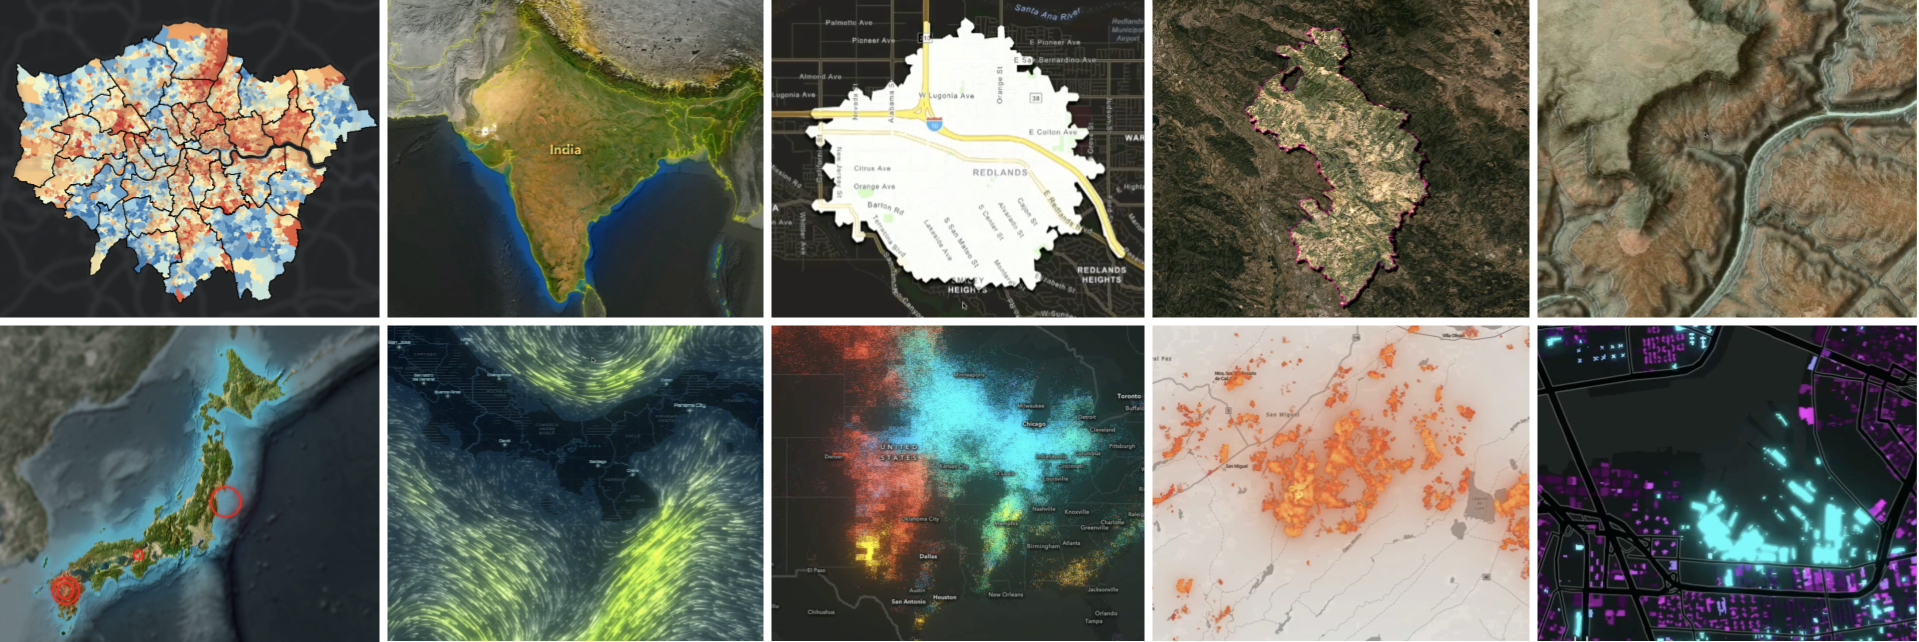
Advanced renderers
In addition to basic renderers, advanced renderers let you uncover deeper spatial patterns and create more sophisticated visual effects or animations.
Beyond the feature-level renderers that style existing geometries, some renderers (such as heatmaps, dot density, and charts) visualize attributes using alternative geometric representations instead of the raw feature shapes.
Aggregated data renderers like clustering and binning are optimized for visualizing high-density datasets. They rely on server-side geospatial statistics to summarize feature concentrations and spatial patterns. This is only possible with feature services, since the server has access to the full feature geometries rather than simplified or tiled representations, allowing for accurate aggregation and realistic distribution patterns.
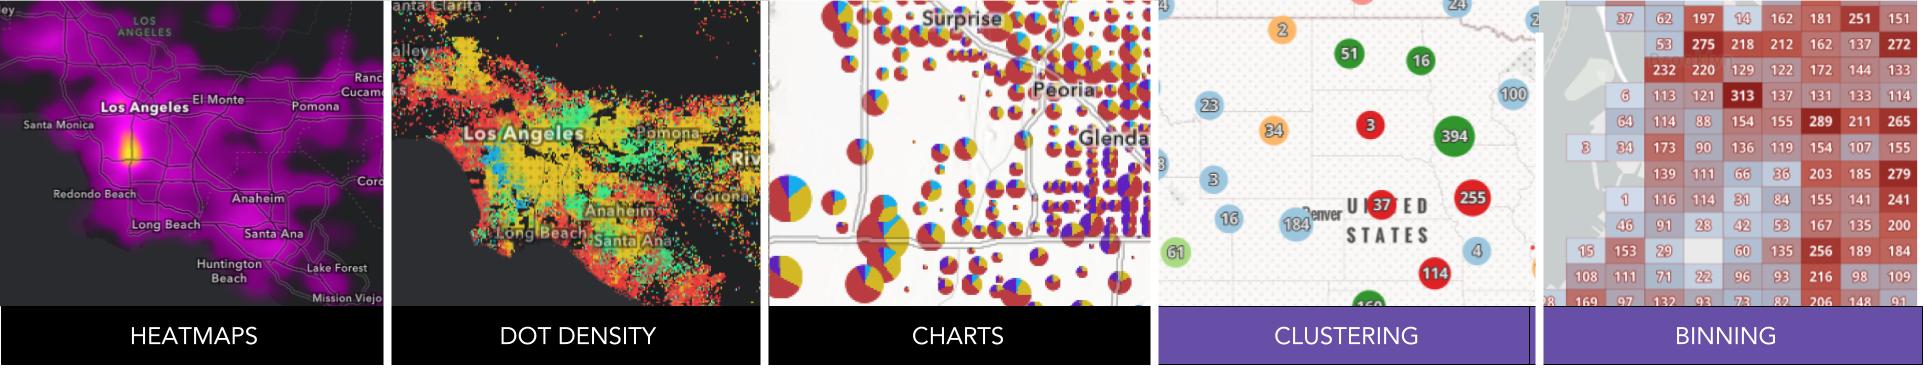
While standard renderers handle most scenarios, custom renderers let you go beyond the limits of the predefined renderers. You have total control over how features are drawn, so you can create anything from animated or 3D symbols to custom clustering, interactive charts, or entirely new visualization styles.
Demos shown above: Pulse by Sean Stone, FlareClusterLayer by Nick Cameron, and Animated Windmills and Animated lines with WebGL by Esri.
Smart mapping
Data visualization has a paradox: to properly visualize a dataset, you first need to be familiar with it; but to understand the data, you usually first have to visualize it.
Thanks to feature services and the analytical endpoint generateRenderer, it is possible to close this gap, reduce trial and error, and prevent misleading visualizations. These capabilities enable SDKs to offer smart mapping tools that help analyze attribute distributions, as does the ArcGIS Maps SDK for JavaScript.
These tools, combined with those that simplify attribute exploration (such as predefined renderers), provide an optimized experience to build applications that require interactive spatial data exploration.
Client-side performance
In the previous article, we explored the inner workings of these services and SDK trade-offs, including the backend factors that affect client-side performance.
Let’s look at a few final factors that influence client-side performance for each service type.
Map tile services
Map tile services are the fastest to render on the client side, but because they’re pre-rendered images, they don’t support any client-side styling or interaction.
Vector tile services
Let’s examine performance from two perspectives:
- Initial loading time:
- When optimized for rendering, vector tiles minimize the amount of data downloaded, offering excellent performance.
- They are particularly efficient for visually complex datasets (with large polygons, polylines, or mixed geometry types, like basemaps).
- Performance is generally consistent across SDKs, since most rely on similar GPU-based rendering pipelines for vector tiles.
- Interaction and dynamic styling:
- Style or filter changes trigger full tile re-evaluation and GPU redraws, so updates can feel slower than in feature services.
- Adding extra attributes enables richer interactivity but increases payload size, which can impact load and draw times, as explained in “Advanced client-side interaction“.
Note: Rendering optimizations like simplification and clipping make drawing fast, but restrict per-feature access, reducing responsiveness for interactive or dynamic updates.
Despite these limitations, vector tiles remain a great choice when visualization speed matters more than interactivity.
Feature services
Feature services are highly flexible, but their performance can vary widely depending on the service configuration, the SDK used, data complexity, and features used.
Looking at performance from the same perspectives:
- Initial loading time: Due to the nature of feature services, the first draw rarely matches the speed of optimized vector tiles. However, the ArcGIS Maps SDK for JavaScript employs client-side techniques such as progressive data loading and snapshot generation to smooth navigation and reduce perceived delay during zooming and panning.
- Interaction and dynamic styling: For interactive or data-driven operations, feature services can outperform vector tile services by allowing direct access to full geometries and attributes.
Here are a few ways these factors can influence performance:
- Service configuration: Private feature services without CDN caching load more slowly.
- SDK: Performance can vary across SDKs and third-party libraries, depending on whether they implement optimizations, as seen in ArcGIS Hosted Data Services: Behind the Scenes and SDK Trade-offs.
- Data complexity: Point data can be as fast as vector tiles, but complex datasets take longer.
- Features used: Advanced renderers and dynamic symbology, like complex CIM symbols, can add overhead.
Note: Feature services are significantly more efficient than using raw vector data sources such as GeoJSON, which typically deliver unsimplified geometries and larger payloads.
Also note that both vector tile and feature services use WebGL or OpenGL for efficient client-side rendering when used with Esri SDKs. Unlike map tile services, their performance also depends on the client device’s hardware.
Summary
From a client-side developer’s perspective, here’s how I would summarize the key points:
- Use map tiles for basemaps, vector tiles for contextual data, and feature services for operational data.
- Use map tile services when rendering performance is critical, you need to protect sensitive data, or you must support older SDKs or low-power devices.
- Use vector tile services for fast, high-quality visualization of contextual data with basic interactivity.
- Use feature services when you need rich interactivity, querying, editing, or advanced 2D and 3D visualization.
- Combine all services strategically to strike a balance between performance and interactivity.
- Consider using ArcGIS Maps SDKs, especially if you work with feature services. Any SDK can be used with any of the services, but when using feature Services, Esri-provided client SDKs offer (by far) the best integration and possibilities.
In the following article, “Terms of Use & Pricing Differences“, we’ll cover additional factors to help you decide which service type and product best fit your project.
More resources on these topics
- Mapping and location services guide > Data visualization
- ArcGIS JavaScript SDK:
- Styles and data visualization chapter
- Introduction to query and filter
- Perform edits using the feature service
- Spatial analysis
- A Look Under the Hood” technical sessions
- ArcGIS Maps SDK for JavaScript: Max Speed & Capabilities of the Feature Layer
- ArcGIS Maps SDK for JavaScript: Developer and Technology Summit 2025 sessions
- ArcGIS Maps SDK for Native Apps
- Game Engine Maps SDKs
- Filtering and modification: Unity, Unreal Engine
- Spatial reference and data analysis: Unity, Unreal Engine
- Game Engine Maps SDKs: Developer and Technology Summit 2025 sessions
- Open source web mapping libraries:
- Data chapter within: Esri Leaflet, MapLibre GL JS, OpenLayers, CesiumJS
- Building web apps with open source mapping APIs
Next steps
You now have a clearer view of each service’s strengths, trade-offs, and how the ArcGIS Maps SDKs fit in. With this understanding, you can make smarter choices about which service and SDK to use for your next project.
If you have questions, join the conversation in Esri Community > Developers, or if you found something confusing or believe you’ve spotted an error or inconsistency in this article, reach out to us at developers@esri.com.
Your input helps us improve the clarity and accuracy of this content.
Finally, if you found this article useful and believe others in your professional network may benefit from it, we would greatly appreciate it if you could share or engage with the post on LinkedIn, Bluesky, or X.
Thank you to everyone who contributed to the content of this article. You rock! Extra special thanks to Matt George, Julie Powell, and Nick Furness.


I’m willing to hear from you!